 Email
Email Print
Print


Silica Fume Market Overview:
Market Snapshot:
Silica Fume Market- Report Coverage:
COVID-19 / Ukraine Crisis - Impact Analysis:
Key Takeaways:
Key Market Players:
Scope of Report:
|
Report
Metric |
Details |
|
Base Year Considered |
2023 |
|
Forecast Period |
2024–2030 |
|
CAGR |
3.1% |
|
Market Size in 2030 |
$720.9 million |
|
Segments Covered |
Source of Metal, Silica Content, Application,
End User and Region |
|
Geographies Covered |
North America, South America, Europe, APAC, Middle
East & Africa |
|
Key Market Players |
Companies in this industry are listed below: 1. Elkem 2. Ferroglobe 3. Wuhan New Reach Micro SiliCA Co. Ltd 4. Sika 5. Cemex 6. Euclid Chemical Company 7. Shanghai Topken Silica Fume Co. Ltd. 8. Sibelco 9. Normet 10. Mapei |
Table 1: Silica Fume Market Overview 2021-2026
Table 2: Silica Fume Market Leader Analysis 2018-2019 (US$)
Table 3: Silica Fume Market Product Analysis 2018-2019 (US$)
Table 4: Silica Fume Market End User Analysis 2018-2019 (US$)
Table 5: Silica Fume Market Patent Analysis 2013-2018* (US$)
Table 6: Silica Fume Market Financial Analysis 2018-2019 (US$)
Table 7: Silica Fume Market Driver Analysis 2018-2019 (US$)
Table 8: Silica Fume Market Challenges Analysis 2018-2019 (US$)
Table 9: Silica Fume Market Constraint Analysis 2018-2019 (US$)
Table 10: Silica Fume Market Supplier Bargaining Power Analysis 2018-2019 (US$)
Table 11: Silica Fume Market Buyer Bargaining Power Analysis 2018-2019 (US$)
Table 12: Silica Fume Market Threat of Substitutes Analysis 2018-2019 (US$)
Table 13: Silica Fume Market Threat of New Entrants Analysis 2018-2019 (US$)
Table 14: Silica Fume Market Degree of Competition Analysis 2018-2019 (US$)
Table 15: Silica Fume Market Value Chain Analysis 2018-2019 (US$)
Table 16: Silica Fume Market Pricing Analysis 2021-2026 (US$)
Table 17: Silica Fume Market Opportunities Analysis 2021-2026 (US$)
Table 18: Silica Fume Market Product Life Cycle Analysis 2021-2026 (US$)
Table 19: Silica Fume Market Supplier Analysis 2018-2019 (US$)
Table 20: Silica Fume Market Distributor Analysis 2018-2019 (US$)
Table 21: Silica Fume Market Trend Analysis 2018-2019 (US$)
Table 22: Silica Fume Market Size 2018 (US$)
Table 23: Silica Fume Market Forecast Analysis 2021-2026 (US$)
Table 24: Silica Fume Market Sales Forecast Analysis 2021-2026 (Units)
Table 25: Silica Fume Market, Revenue & Volume, By Application, 2021-2026 ($)
Table 26: Silica Fume Market By Application, Revenue & Volume, By Construction, 2021-2026 ($)
Table 27: Silica Fume Market By Application, Revenue & Volume, By Chemical Production Operations, 2021-2026 ($)
Table 28: Silica Fume Market By Application, Revenue & Volume, By Oil & Gas Operations, 2021-2026 ($)
Table 29: Silica Fume Market, Revenue & Volume, By Source, 2021-2026 ($)
Table 30: Silica Fume Market By Source, Revenue & Volume, By Silicon Metal, 2021-2026 ($)
Table 31: Silica Fume Market By Source, Revenue & Volume, By Ferrosilicon, 2021-2026 ($)
Table 32: North America Silica Fume Market, Revenue & Volume, By Application, 2021-2026 ($)
Table 33: North America Silica Fume Market, Revenue & Volume, By Source, 2021-2026 ($)
Table 34: South america Silica Fume Market, Revenue & Volume, By Application, 2021-2026 ($)
Table 35: South america Silica Fume Market, Revenue & Volume, By Source, 2021-2026 ($)
Table 36: Europe Silica Fume Market, Revenue & Volume, By Application, 2021-2026 ($)
Table 37: Europe Silica Fume Market, Revenue & Volume, By Source, 2021-2026 ($)
Table 38: APAC Silica Fume Market, Revenue & Volume, By Application, 2021-2026 ($)
Table 39: APAC Silica Fume Market, Revenue & Volume, By Source, 2021-2026 ($)
Table 40: Middle East & Africa Silica Fume Market, Revenue & Volume, By Application, 2021-2026 ($)
Table 41: Middle East & Africa Silica Fume Market, Revenue & Volume, By Source, 2021-2026 ($)
Table 42: Russia Silica Fume Market, Revenue & Volume, By Application, 2021-2026 ($)
Table 43: Russia Silica Fume Market, Revenue & Volume, By Source, 2021-2026 ($)
Table 44: Israel Silica Fume Market, Revenue & Volume, By Application, 2021-2026 ($)
Table 45: Israel Silica Fume Market, Revenue & Volume, By Source, 2021-2026 ($)
Table 46: Top Companies 2018 (US$) Silica Fume Market, Revenue & Volume
Table 47: Product Launch 2018-2019 Silica Fume Market, Revenue & Volume
Table 48: Mergers & Acquistions 2018-2019 Silica Fume Market, Revenue & Volume
List of Figures:
Figure 1: Overview of Silica Fume Market 2021-2026
Figure 2: Market Share Analysis for Silica Fume Market 2018 (US$)
Figure 3: Product Comparison in Silica Fume Market 2018-2019 (US$)
Figure 4: End User Profile for Silica Fume Market 2018-2019 (US$)
Figure 5: Patent Application and Grant in Silica Fume Market 2013-2018* (US$)
Figure 6: Top 5 Companies Financial Analysis in Silica Fume Market 2018-2019 (US$)
Figure 7: Market Entry Strategy in Silica Fume Market 2018-2019
Figure 8: Ecosystem Analysis in Silica Fume Market 2018
Figure 9: Average Selling Price in Silica Fume Market 2021-2026
Figure 10: Top Opportunites in Silica Fume Market 2018-2019
Figure 11: Market Life Cycle Analysis in Silica Fume Market
Figure 12: GlobalBy Application Silica Fume Market Revenue, 2021-2026 ($)
Figure 13: GlobalBy Source Silica Fume Market Revenue, 2021-2026 ($)
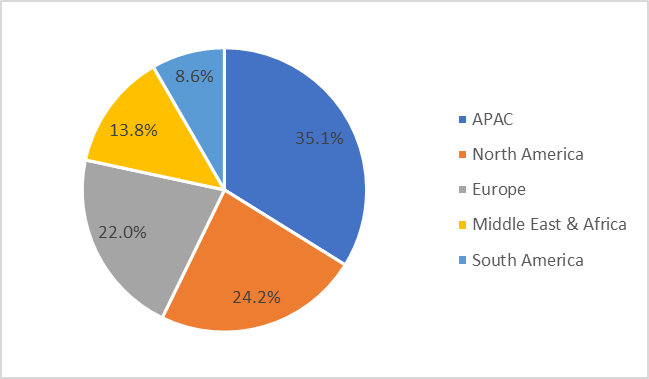
Figure 14: Global Silica Fume Market - By Geography
Figure 15: Global Silica Fume Market Value & Volume, By Geography, 2021-2026 ($)
Figure 16: Global Silica Fume Market CAGR, By Geography, 2021-2026 (%)
Figure 17: North America Silica Fume Market Value & Volume, 2021-2026 ($)
Figure 18: US Silica Fume Market Value & Volume, 2021-2026 ($)
Figure 19: US GDP and Population, 2018-2019 ($)
Figure 20: US GDP – Composition of 2018, By Sector of Origin
Figure 21: US Export and Import Value & Volume, 2018-2019 ($)
Figure 22: Canada Silica Fume Market Value & Volume, 2021-2026 ($)
Figure 23: Canada GDP and Population, 2018-2019 ($)
Figure 24: Canada GDP – Composition of 2018, By Sector of Origin
Figure 25: Canada Export and Import Value & Volume, 2018-2019 ($)
Figure 26: Mexico Silica Fume Market Value & Volume, 2021-2026 ($)
Figure 27: Mexico GDP and Population, 2018-2019 ($)
Figure 28: Mexico GDP – Composition of 2018, By Sector of Origin
Figure 29: Mexico Export and Import Value & Volume, 2018-2019 ($)
Figure 30: South America Silica Fume Market Value & Volume, 2021-2026 ($)
Figure 31: Brazil Silica Fume Market Value & Volume, 2021-2026 ($)
Figure 32: Brazil GDP and Population, 2018-2019 ($)
Figure 33: Brazil GDP – Composition of 2018, By Sector of Origin
Figure 34: Brazil Export and Import Value & Volume, 2018-2019 ($)
Figure 35: Venezuela Silica Fume Market Value & Volume, 2021-2026 ($)
Figure 36: Venezuela GDP and Population, 2018-2019 ($)
Figure 37: Venezuela GDP – Composition of 2018, By Sector of Origin
Figure 38: Venezuela Export and Import Value & Volume, 2018-2019 ($)
Figure 39: Argentina Silica Fume Market Value & Volume, 2021-2026 ($)
Figure 40: Argentina GDP and Population, 2018-2019 ($)
Figure 41: Argentina GDP – Composition of 2018, By Sector of Origin
Figure 42: Argentina Export and Import Value & Volume, 2018-2019 ($)
Figure 43: Ecuador Silica Fume Market Value & Volume, 2021-2026 ($)
Figure 44: Ecuador GDP and Population, 2018-2019 ($)
Figure 45: Ecuador GDP – Composition of 2018, By Sector of Origin
Figure 46: Ecuador Export and Import Value & Volume, 2018-2019 ($)
Figure 47: Peru Silica Fume Market Value & Volume, 2021-2026 ($)
Figure 48: Peru GDP and Population, 2018-2019 ($)
Figure 49: Peru GDP – Composition of 2018, By Sector of Origin
Figure 50: Peru Export and Import Value & Volume, 2018-2019 ($)
Figure 51: Colombia Silica Fume Market Value & Volume, 2021-2026 ($)
Figure 52: Colombia GDP and Population, 2018-2019 ($)
Figure 53: Colombia GDP – Composition of 2018, By Sector of Origin
Figure 54: Colombia Export and Import Value & Volume, 2018-2019 ($)
Figure 55: Costa Rica Silica Fume Market Value & Volume, 2021-2026 ($)
Figure 56: Costa Rica GDP and Population, 2018-2019 ($)
Figure 57: Costa Rica GDP – Composition of 2018, By Sector of Origin
Figure 58: Costa Rica Export and Import Value & Volume, 2018-2019 ($)
Figure 59: Europe Silica Fume Market Value & Volume, 2021-2026 ($)
Figure 60: U.K Silica Fume Market Value & Volume, 2021-2026 ($)
Figure 61: U.K GDP and Population, 2018-2019 ($)
Figure 62: U.K GDP – Composition of 2018, By Sector of Origin
Figure 63: U.K Export and Import Value & Volume, 2018-2019 ($)
Figure 64: Germany Silica Fume Market Value & Volume, 2021-2026 ($)
Figure 65: Germany GDP and Population, 2018-2019 ($)
Figure 66: Germany GDP – Composition of 2018, By Sector of Origin
Figure 67: Germany Export and Import Value & Volume, 2018-2019 ($)
Figure 68: Italy Silica Fume Market Value & Volume, 2021-2026 ($)
Figure 69: Italy GDP and Population, 2018-2019 ($)
Figure 70: Italy GDP – Composition of 2018, By Sector of Origin
Figure 71: Italy Export and Import Value & Volume, 2018-2019 ($)
Figure 72: France Silica Fume Market Value & Volume, 2021-2026 ($)
Figure 73: France GDP and Population, 2018-2019 ($)
Figure 74: France GDP – Composition of 2018, By Sector of Origin
Figure 75: France Export and Import Value & Volume, 2018-2019 ($)
Figure 76: Netherlands Silica Fume Market Value & Volume, 2021-2026 ($)
Figure 77: Netherlands GDP and Population, 2018-2019 ($)
Figure 78: Netherlands GDP – Composition of 2018, By Sector of Origin
Figure 79: Netherlands Export and Import Value & Volume, 2018-2019 ($)
Figure 80: Belgium Silica Fume Market Value & Volume, 2021-2026 ($)
Figure 81: Belgium GDP and Population, 2018-2019 ($)
Figure 82: Belgium GDP – Composition of 2018, By Sector of Origin
Figure 83: Belgium Export and Import Value & Volume, 2018-2019 ($)
Figure 84: Spain Silica Fume Market Value & Volume, 2021-2026 ($)
Figure 85: Spain GDP and Population, 2018-2019 ($)
Figure 86: Spain GDP – Composition of 2018, By Sector of Origin
Figure 87: Spain Export and Import Value & Volume, 2018-2019 ($)
Figure 88: Denmark Silica Fume Market Value & Volume, 2021-2026 ($)
Figure 89: Denmark GDP and Population, 2018-2019 ($)
Figure 90: Denmark GDP – Composition of 2018, By Sector of Origin
Figure 91: Denmark Export and Import Value & Volume, 2018-2019 ($)
Figure 92: APAC Silica Fume Market Value & Volume, 2021-2026 ($)
Figure 93: China Silica Fume Market Value & Volume, 2021-2026
Figure 94: China GDP and Population, 2018-2019 ($)
Figure 95: China GDP – Composition of 2018, By Sector of Origin
Figure 96: China Export and Import Value & Volume, 2018-2019 ($) Silica Fume Market China Export and Import Value & Volume, 2018-2019 ($)
Figure 97: Australia Silica Fume Market Value & Volume, 2021-2026 ($)
Figure 98: Australia GDP and Population, 2018-2019 ($)
Figure 99: Australia GDP – Composition of 2018, By Sector of Origin
Figure 100: Australia Export and Import Value & Volume, 2018-2019 ($)
Figure 101: South Korea Silica Fume Market Value & Volume, 2021-2026 ($)
Figure 102: South Korea GDP and Population, 2018-2019 ($)
Figure 103: South Korea GDP – Composition of 2018, By Sector of Origin
Figure 104: South Korea Export and Import Value & Volume, 2018-2019 ($)
Figure 105: India Silica Fume Market Value & Volume, 2021-2026 ($)
Figure 106: India GDP and Population, 2018-2019 ($)
Figure 107: India GDP – Composition of 2018, By Sector of Origin
Figure 108: India Export and Import Value & Volume, 2018-2019 ($)
Figure 109: Taiwan Silica Fume Market Value & Volume, 2021-2026 ($)
Figure 110: Taiwan GDP and Population, 2018-2019 ($)
Figure 111: Taiwan GDP – Composition of 2018, By Sector of Origin
Figure 112: Taiwan Export and Import Value & Volume, 2018-2019 ($)
Figure 113: Malaysia Silica Fume Market Value & Volume, 2021-2026 ($)
Figure 114: Malaysia GDP and Population, 2018-2019 ($)
Figure 115: Malaysia GDP – Composition of 2018, By Sector of Origin
Figure 116: Malaysia Export and Import Value & Volume, 2018-2019 ($)
Figure 117: Hong Kong Silica Fume Market Value & Volume, 2021-2026 ($)
Figure 118: Hong Kong GDP and Population, 2018-2019 ($)
Figure 119: Hong Kong GDP – Composition of 2018, By Sector of Origin
Figure 120: Hong Kong Export and Import Value & Volume, 2018-2019 ($)
Figure 121: Middle East & Africa Silica Fume Market Middle East & Africa 3D Printing Market Value & Volume, 2021-2026 ($)
Figure 122: Russia Silica Fume Market Value & Volume, 2021-2026 ($)
Figure 123: Russia GDP and Population, 2018-2019 ($)
Figure 124: Russia GDP – Composition of 2018, By Sector of Origin
Figure 125: Russia Export and Import Value & Volume, 2018-2019 ($)
Figure 126: Israel Silica Fume Market Value & Volume, 2021-2026 ($)
Figure 127: Israel GDP and Population, 2018-2019 ($)
Figure 128: Israel GDP – Composition of 2018, By Sector of Origin
Figure 129: Israel Export and Import Value & Volume, 2018-2019 ($)
Figure 130: Entropy Share, By Strategies, 2018-2019* (%) Silica Fume Market
Figure 131: Developments, 2018-2019* Silica Fume Market
Figure 132: Company 1 Silica Fume Market Net Revenue, By Years, 2018-2019* ($)
Figure 133: Company 1 Silica Fume Market Net Revenue Share, By Business segments, 2018 (%)
Figure 134: Company 1 Silica Fume Market Net Sales Share, By Geography, 2018 (%)
Figure 135: Company 2 Silica Fume Market Net Revenue, By Years, 2018-2019* ($)
Figure 136: Company 2 Silica Fume Market Net Revenue Share, By Business segments, 2018 (%)
Figure 137: Company 2 Silica Fume Market Net Sales Share, By Geography, 2018 (%)
Figure 138: Company 3 Silica Fume Market Net Revenue, By Years, 2018-2019* ($)
Figure 139: Company 3 Silica Fume Market Net Revenue Share, By Business segments, 2018 (%)
Figure 140: Company 3 Silica Fume Market Net Sales Share, By Geography, 2018 (%)
Figure 141: Company 4 Silica Fume Market Net Revenue, By Years, 2018-2019* ($)
Figure 142: Company 4 Silica Fume Market Net Revenue Share, By Business segments, 2018 (%)
Figure 143: Company 4 Silica Fume Market Net Sales Share, By Geography, 2018 (%)
Figure 144: Company 5 Silica Fume Market Net Revenue, By Years, 2018-2019* ($)
Figure 145: Company 5 Silica Fume Market Net Revenue Share, By Business segments, 2018 (%)
Figure 146: Company 5 Silica Fume Market Net Sales Share, By Geography, 2018 (%)
Figure 147: Company 6 Silica Fume Market Net Revenue, By Years, 2018-2019* ($)
Figure 148: Company 6 Silica Fume Market Net Revenue Share, By Business segments, 2018 (%)
Figure 149: Company 6 Silica Fume Market Net Sales Share, By Geography, 2018 (%)
Figure 150: Company 7 Silica Fume Market Net Revenue, By Years, 2018-2019* ($)
Figure 151: Company 7 Silica Fume Market Net Revenue Share, By Business segments, 2018 (%)
Figure 152: Company 7 Silica Fume Market Net Sales Share, By Geography, 2018 (%)
Figure 153: Company 8 Silica Fume Market Net Revenue, By Years, 2018-2019* ($)
Figure 154: Company 8 Silica Fume Market Net Revenue Share, By Business segments, 2018 (%)
Figure 155: Company 8 Silica Fume Market Net Sales Share, By Geography, 2018 (%)
Figure 156: Company 9 Silica Fume Market Net Revenue, By Years, 2018-2019* ($)
Figure 157: Company 9 Silica Fume Market Net Revenue Share, By Business segments, 2018 (%)
Figure 158: Company 9 Silica Fume Market Net Sales Share, By Geography, 2018 (%)
Figure 159: Company 10 Silica Fume Market Net Revenue, By Years, 2018-2019* ($)
Figure 160: Company 10 Silica Fume Market Net Revenue Share, By Business segments, 2018 (%)
Figure 161: Company 10 Silica Fume Market Net Sales Share, By Geography, 2018 (%)
Figure 162: Company 11 Silica Fume Market Net Revenue, By Years, 2018-2019* ($)
Figure 163: Company 11 Silica Fume Market Net Revenue Share, By Business segments, 2018 (%)
Figure 164: Company 11 Silica Fume Market Net Sales Share, By Geography, 2018 (%)
Figure 165: Company 12 Silica Fume Market Net Revenue, By Years, 2018-2019* ($)
Figure 166: Company 12 Silica Fume Market Net Revenue Share, By Business segments, 2018 (%)
Figure 167: Company 12 Silica Fume Market Net Sales Share, By Geography, 2018 (%)
Figure 168: Company 13 Silica Fume Market Net Revenue, By Years, 2018-2019* ($)
Figure 169: Company 13 Silica Fume Market Net Revenue Share, By Business segments, 2018 (%)
Figure 170: Company 13 Silica Fume Market Net Sales Share, By Geography, 2018 (%)
Figure 171: Company 14 Silica Fume Market Net Revenue, By Years, 2018-2019* ($)
Figure 172: Company 14 Silica Fume Market Net Revenue Share, By Business segments, 2018 (%)
Figure 173: Company 14 Silica Fume Market Net Sales Share, By Geography, 2018 (%)
Figure 174: Company 15 Silica Fume Market Net Revenue, By Years, 2018-2019* ($)
Figure 175: Company 15 Silica Fume Market Net Revenue Share, By Business segments, 2018 (%)
Figure 176: Company 15 Silica Fume Market Net Sales Share, By Geography, 2018 (%)
The Silica Fume Market is projected to grow at 3.1% CAGR during the forecast period 2024-2030.
Global Silica Fume Market size is estimated to be 581.4 million in 2023 and is projected to reach $720.9 million by 2030.
The leading players in the Silica Fume Market are Elkem, Ferroglobe, Wuhan New Reach Micro SiliCA Co. Ltd, Sika, Cemex and others.
Innovations in applications, there\'s a growing emphasis on sustainability in construction materials, and rising demand in construction are some of the major Silica Fume Market trends in the industry that will create growth opportunities for the market during the forecast period.
Rise in infrastructure construction, growing focus on green construction, growing demand for green cement, and advancements in processing technology for silica fume are the driving factors and opportunities of the market.