 Email
Email Print
Print


The Disconnect Switches Market is estimated to surpass $ 15.35 Billion by 2024 growing at an estimated rate of CAGR 6.1% during 2018 to 2024. Majorly driven by the R& D efforts put to develop technologies to ensure safety and quality in power transmission and distribution network. Further the growing emphasis on publicity and growing concern about safety among consumers is also set to propel the market growth in the future.
What are Disconnect Switches?
Disconnect Switches are also known as safety switches or load break switches which are used in many industrial applications. , The main purpose of Disconnect switches is to provide service entrance and fault protection for motors. These are particularly designed to disconnect manufacturing equipment and heavy machinery from the power source at times of overload. Disconnect switches are of two types such as fusible disconnect switch, non-fusible disconnect switch. These two types of switches are in great demand from customers.
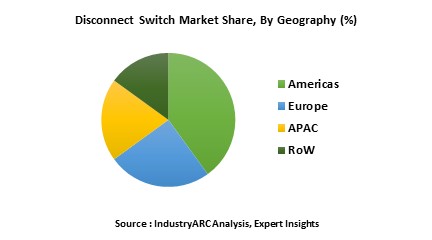
These disconnect switches market is mostly in the APAC region with leading countries such as China, South Korea, Japan, India, and others followed by Europe with leading countries such as the UK, Germany, France, Russia, and others.. Disconnect switch assure that an electrical circuit is completely isolated and de-energized for maintenance or service.
The key drivers for growth of disconnect switches market are rapid industrialization, urbanization, automation, and increasing awareness about safety in factories and manufacturing plants. These are perfectly suitable for many different applications such as motor control centers, switchboards, and in transformers and transmission lines where Disconnect switch acts as a main switch.
This report gives an in-depth assessment of disconnect switches market by current rating, by pole type, by switch type, by voltage types, by applications and geography. The major category of the disconnect switches is product type which were encompassed in the scope includes fusible disconnect switches, and non-fusible disconnect switches.
Who are the major end-users of Disconnect Switches?
The various end users assessed include INDUSTRIAL applications which includes photovoltaic, substation, power transmission & distribution, utilities, power generation, manufacturing & machinery, and COMMERCIAL applications which includes infrastructure, telecom, transportation(railways, aviation, & others), and OTHERS. The highly in demand application is in industrial sector which is currently being explored for safety precautions, which are rising the market of the Disconnect Switches and estimated to have huge growth during the forecast period. The capital expenditure of major companies in the development of product types have also escalated significantly since the last decade.
Market Research and Market Trends of Disconnect Switches
- Coming days, disconnect switches are set to grow with the adoption of new technologies in accordance with customer demand. This will in turn increase the growth of the market.
- Rising emphasis on safety of workspace is an important factors which is driving the market of the disconnect switches globally.
- Non-Contact Safety Switches are mostly used in many applications in industrial and commercial sectors that is the key growth factor of the Disconnect switches market.
- APAC is the leading region of this market valued $ 3.56 billion in 2017 and was estimated to reach $ 6.07 billion by 2024 with an anticipated growth of CAGR 7.7% during the forecast period.
- The important development which led to the growth of the market was the introduction of advanced cable-pull E-stop with patented, microprocessor-based technology by Rockwell.
Who are the Major Players in Disconnect Switches?
The companies referred to in the market research report includes Cooper Industries (Eaton Corporation) (U.S), Emerson Electric (U.S), ABB (Switzerland), Rockwell Automation (Allen Bradley) (U.S), and R.STAHL (Germany).
What is our report scope?
The report incorporates in-depth assessment of the competitive landscape, product market sizing, product benchmarking, market trends, product developments, financial analysis, strategic analysis and so on to gauge the impact forces and potential opportunities of the market. Apart from this the report also includes a study of major developments in the market such as product launches, agreements, acquisitions, collaborations, mergers and so on to comprehend the prevailing market dynamics at present and its impact during the forecast period 2018-2023.
All our reports are customizable to your company needs to a certain extent, we do provide 20 free consulting hours along with purchase of each report, and this will allow you to request any additional data to customize the report to your needs.
Key Takeaways from this Report
- Evaluate market potential through analyzing growth rates (CAGR %), Volume (Units) and Value ($M) data given at country level – for product types, end use applications and by different industry verticals.
- Understand the different dynamics influencing the market – key driving factors, challenges and hidden opportunities.
- Get in-depth insights on your competitor performance – market shares, strategies, financial benchmarking, product benchmarking, SWOT and more.
- Analyze the sales and distribution channels across key geographies to improve top-line revenues.
- Understand the industry supply chain with a deep-dive on the value augmentation at each step, in order to optimize value and bring efficiencies in your processes.
- Get a quick outlook on the market entropy – M&A’s, deals, partnerships, product launches of all key players for the past 4 years.
- Evaluate the supply-demand gaps, import-export statistics and regulatory landscape for more than top 20 countries globally for the market.
1. Disconnect Switches Market Overview
2. Disconnect Switches Market Executive Summary
3. Disconnect Switches Market Landscape
3.1. Market Share Analysis
3.2. Comparative Analysis
3.2.1. Product Benchmarking
3.2.2. End User profiling
3.2.3. Patent Analysis
3.2.4. Top 5 Financials Analysis
4. Disconnect Switches Market Forces
4.1. Market Drivers
4.2. Market Constraints
4.3. Market Challenges
4.4. Attractiveness of the Industry
4.4.1. Power of Suppliers
4.4.2. Power of Customers
4.4.3. Threat of New entrants
4.4.4. Threat of Substitution
4.4.5. Degree of Competition
5. Disconnect Switches Market – Strategic Analysis
5.1. Value Chain Analysis
5.2. Pricing Analysis
5.3. Opportunities Analysis
5.4. Product/Market Life Cycle Analysis
5.5. Suppliers and Distributors
6. Disconnect Switches Market - By Current Rating
6.1. Introduction
6.2. Below 20 A
6.3. 20.1-100 A
6.4. 100.1-200 A
6.5. 200.1-500 A
6.6. Above 500A
7. Disconnect Switches Market - By Pole Type
7.1. Introduction
7.2. 1-Pole
7.3. 2-Pole
7.4. 3-Pole
7.5. 4-Pole & Above
8. Disconnect Switches Market - By Product Type
8.1. Introduction
8.2. Fusible Disconnect Switches
8.3. Non-Fusible Disconnect Switches
9. Disconnect Switches Market - By Type
9.1. Introduction
9.2. Door Mount
9.3. Panel Mount
9.4. DIN
10. Disconnect Switches Market - By Switch Type
10.1. Introduction
10.2. Rotary Disconnect Switches
10.3. Toggle Disconnect Switches
10.4. Others
11. Disconnect Switches Market - By Voltage Range
11.1. Introduction
11.2. Low Voltage Disconnect Switches
11.3. Medium Voltage Disconnect Switches
11.4. High Voltage Disconnect Switches
12. Disconnect Switches Market - By Applications
12.1. Introduction
12.2. Industrial
12.2.1. Photovoltaic
12.2.2. Substation
12.2.3. Power Transmission & Distribution
12.2.4. Power Generation
12.2.5. Manufacturing & Machinery
12.2.6. Others
12.3. Commercial
12.3.1. Infrastructure
12.3.2. Telecom
12.3.3. Transportation
12.3.3.1. Railways
12.3.3.2. Aviation
12.3.3.3. Others
12.4. Others
13. Disconnect Switches Market - By Geography
13.1. Introduction
13.2. Americas
13.2.1. U.S
13.2.2. Canada
13.2.3. Brazil
13.2.4. Others
13.3. Europe
13.3.1. UK
13.3.2. Germany
13.3.3. France
13.3.4. Russia
13.3.5. Rest of Europe
13.4. APAC
13.4.1. China
13.4.2. India
13.4.3. Japan
13.4.4. South Korea
13.4.5. Rest of APAC
13.5. RoW
13.5.1. Middle East
13.5.2. Africa
14. Market Entropy
14.1. New Product Launches
14.2. M&As, Collaborations, JVs, Partnership
15. Company Profiles
15.1. Cooper Industries (Eaton Corporation) (U.S)
15.2. Emerson Electric (U.S)
15.3. ABB (Switzerland)
15.4. Rockwell Automation (Allen Bradley) (U.S)
15.5. Company 5
15.6. Company 6
15.7. Company 7
15.8. Company 8
15.9. Company 9
*More than 10 Companies are profiled in this Research Report*
"*Financials would be provided on a best efforts basis for private companies"
16. Appendix
16.1. Abbreviations
16.2. Sources
16.3. Research Methodology
16.4. Bibliography
16.5. Compilation of Expert Insights
16.6. Disclaimer
List of Tables:
Table 1: Disconnect Switch Market Overview 2021-2026
Table 2: Disconnect Switch Market Leader Analysis 2018-2019 (US$)
Table 3: Disconnect Switch Market Product Analysis 2018-2019 (US$)
Table 4: Disconnect Switch Market End User Analysis 2018-2019 (US$)
Table 5: Disconnect Switch Market Patent Analysis 2013-2018* (US$)
Table 6: Disconnect Switch Market Financial Analysis 2018-2019 (US$)
Table 7: Disconnect Switch Market Driver Analysis 2018-2019 (US$)
Table 8: Disconnect Switch Market Challenges Analysis 2018-2019 (US$)
Table 9: Disconnect Switch Market Constraint Analysis 2018-2019 (US$)
Table 10: Disconnect Switch Market Supplier Bargaining Power Analysis 2018-2019 (US$)
Table 11: Disconnect Switch Market Buyer Bargaining Power Analysis 2018-2019 (US$)
Table 12: Disconnect Switch Market Threat of Substitutes Analysis 2018-2019 (US$)
Table 13: Disconnect Switch Market Threat of New Entrants Analysis 2018-2019 (US$)
Table 14: Disconnect Switch Market Degree of Competition Analysis 2018-2019 (US$)
Table 15: Disconnect Switch Market Value Chain Analysis 2018-2019 (US$)
Table 16: Disconnect Switch Market Pricing Analysis 2021-2026 (US$)
Table 17: Disconnect Switch Market Opportunities Analysis 2021-2026 (US$)
Table 18: Disconnect Switch Market Product Life Cycle Analysis 2021-2026 (US$)
Table 19: Disconnect Switch Market Supplier Analysis 2018-2019 (US$)
Table 20: Disconnect Switch Market Distributor Analysis 2018-2019 (US$)
Table 21: Disconnect Switch Market Trend Analysis 2018-2019 (US$)
Table 22: Disconnect Switch Market Size 2018 (US$)
Table 23: Disconnect Switch Market Forecast Analysis 2021-2026 (US$)
Table 24: Disconnect Switch Market Sales Forecast Analysis 2021-2026 (Units)
Table 25: Disconnect Switch Market, Revenue & Volume, By Current Rating, 2021-2026 ($)
Table 26: Disconnect Switch Market By Current Rating, Revenue & Volume, By Below 20A, 2021-2026 ($)
Table 27: Disconnect Switch Market By Current Rating, Revenue & Volume, By 20.1-100 A, 2021-2026 ($)
Table 28: Disconnect Switch Market By Current Rating, Revenue & Volume, By 100.1-200 A, 2021-2026 ($)
Table 29: Disconnect Switch Market By Current Rating, Revenue & Volume, By 200.1-500 A, 2021-2026 ($)
Table 30: Disconnect Switch Market By Current Rating, Revenue & Volume, By Above 500.1 A, 2021-2026 ($)
Table 31: Disconnect Switch Market, Revenue & Volume, By Pole Type, 2021-2026 ($)
Table 32: Disconnect Switch Market By Pole Type, Revenue & Volume, By 1-Pole, 2021-2026 ($)
Table 33: Disconnect Switch Market By Pole Type, Revenue & Volume, By 2-Pole, 2021-2026 ($)
Table 34: Disconnect Switch Market By Pole Type, Revenue & Volume, By 3-Pole, 2021-2026 ($)
Table 35: Disconnect Switch Market By Pole Type, Revenue & Volume, By 4-Pole, 2021-2026 ($)
Table 36: Disconnect Switch Market, Revenue & Volume, By Product Type, 2021-2026 ($)
Table 37: Disconnect Switch Market By Product Type, Revenue & Volume, By Fusible Disconnector Switch, 2021-2026 ($)
Table 38: Disconnect Switch Market By Product Type, Revenue & Volume, By Non-Fusible Disconnector Switch, 2021-2026 ($)
Table 39: Disconnect Switch Market, Revenue & Volume, By Application, 2021-2026 ($)
Table 40: Disconnect Switch Market By Application, Revenue & Volume, By Industrial, 2021-2026 ($)
Table 41: Disconnect Switch Market By Application, Revenue & Volume, By Commercial, 2021-2026 ($)
Table 42: Disconnect Switch Market, Revenue & Volume, By Switch Type, 2021-2026 ($)
Table 43: Disconnect Switch Market By Switch Type, Revenue & Volume, By Rotary Disconnector Switch, 2021-2026 ($)
Table 44: Disconnect Switch Market By Switch Type, Revenue & Volume, By Toggle Disconnector Switch, 2021-2026 ($)
Table 45: North America Disconnect Switch Market, Revenue & Volume, By Current Rating, 2021-2026 ($)
Table 46: North America Disconnect Switch Market, Revenue & Volume, By Pole Type, 2021-2026 ($)
Table 47: North America Disconnect Switch Market, Revenue & Volume, By Product Type, 2021-2026 ($)
Table 48: North America Disconnect Switch Market, Revenue & Volume, By Application, 2021-2026 ($)
Table 49: North America Disconnect Switch Market, Revenue & Volume, By Switch Type, 2021-2026 ($)
Table 50: South america Disconnect Switch Market, Revenue & Volume, By Current Rating, 2021-2026 ($)
Table 51: South america Disconnect Switch Market, Revenue & Volume, By Pole Type, 2021-2026 ($)
Table 52: South america Disconnect Switch Market, Revenue & Volume, By Product Type, 2021-2026 ($)
Table 53: South america Disconnect Switch Market, Revenue & Volume, By Application, 2021-2026 ($)
Table 54: South america Disconnect Switch Market, Revenue & Volume, By Switch Type, 2021-2026 ($)
Table 55: Europe Disconnect Switch Market, Revenue & Volume, By Current Rating, 2021-2026 ($)
Table 56: Europe Disconnect Switch Market, Revenue & Volume, By Pole Type, 2021-2026 ($)
Table 57: Europe Disconnect Switch Market, Revenue & Volume, By Product Type, 2021-2026 ($)
Table 58: Europe Disconnect Switch Market, Revenue & Volume, By Application, 2021-2026 ($)
Table 59: Europe Disconnect Switch Market, Revenue & Volume, By Switch Type, 2021-2026 ($)
Table 60: APAC Disconnect Switch Market, Revenue & Volume, By Current Rating, 2021-2026 ($)
Table 61: APAC Disconnect Switch Market, Revenue & Volume, By Pole Type, 2021-2026 ($)
Table 62: APAC Disconnect Switch Market, Revenue & Volume, By Product Type, 2021-2026 ($)
Table 63: APAC Disconnect Switch Market, Revenue & Volume, By Application, 2021-2026 ($)
Table 64: APAC Disconnect Switch Market, Revenue & Volume, By Switch Type, 2021-2026 ($)
Table 65: Middle East & Africa Disconnect Switch Market, Revenue & Volume, By Current Rating, 2021-2026 ($)
Table 66: Middle East & Africa Disconnect Switch Market, Revenue & Volume, By Pole Type, 2021-2026 ($)
Table 67: Middle East & Africa Disconnect Switch Market, Revenue & Volume, By Product Type, 2021-2026 ($)
Table 68: Middle East & Africa Disconnect Switch Market, Revenue & Volume, By Application, 2021-2026 ($)
Table 69: Middle East & Africa Disconnect Switch Market, Revenue & Volume, By Switch Type, 2021-2026 ($)
Table 70: Russia Disconnect Switch Market, Revenue & Volume, By Current Rating, 2021-2026 ($)
Table 71: Russia Disconnect Switch Market, Revenue & Volume, By Pole Type, 2021-2026 ($)
Table 72: Russia Disconnect Switch Market, Revenue & Volume, By Product Type, 2021-2026 ($)
Table 73: Russia Disconnect Switch Market, Revenue & Volume, By Application, 2021-2026 ($)
Table 74: Russia Disconnect Switch Market, Revenue & Volume, By Switch Type, 2021-2026 ($)
Table 75: Israel Disconnect Switch Market, Revenue & Volume, By Current Rating, 2021-2026 ($)
Table 76: Israel Disconnect Switch Market, Revenue & Volume, By Pole Type, 2021-2026 ($)
Table 77: Israel Disconnect Switch Market, Revenue & Volume, By Product Type, 2021-2026 ($)
Table 78: Israel Disconnect Switch Market, Revenue & Volume, By Application, 2021-2026 ($)
Table 79: Israel Disconnect Switch Market, Revenue & Volume, By Switch Type, 2021-2026 ($)
Table 80: Top Companies 2018 (US$) Disconnect Switch Market, Revenue & Volume
Table 81: Product Launch 2018-2019 Disconnect Switch Market, Revenue & Volume
Table 82: Mergers & Acquistions 2018-2019 Disconnect Switch Market, Revenue & Volume
List of Figures:
Figure 1: Overview of Disconnect Switch Market 2021-2026
Figure 2: Market Share Analysis for Disconnect Switch Market 2018 (US$)
Figure 3: Product Comparison in Disconnect Switch Market 2018-2019 (US$)
Figure 4: End User Profile for Disconnect Switch Market 2018-2019 (US$)
Figure 5: Patent Application and Grant in Disconnect Switch Market 2013-2018* (US$)
Figure 6: Top 5 Companies Financial Analysis in Disconnect Switch Market 2018-2019 (US$)
Figure 7: Market Entry Strategy in Disconnect Switch Market 2018-2019
Figure 8: Ecosystem Analysis in Disconnect Switch Market 2018
Figure 9: Average Selling Price in Disconnect Switch Market 2021-2026
Figure 10: Top Opportunites in Disconnect Switch Market 2018-2019
Figure 11: Market Life Cycle Analysis in Disconnect Switch Market
Figure 12: GlobalBy Current Rating Disconnect Switch Market Revenue, 2021-2026 ($)
Figure 13: GlobalBy Pole Type Disconnect Switch Market Revenue, 2021-2026 ($)
Figure 14: GlobalBy Product Type Disconnect Switch Market Revenue, 2021-2026 ($)
Figure 15: GlobalBy Application Disconnect Switch Market Revenue, 2021-2026 ($)
Figure 16: GlobalBy Switch Type Disconnect Switch Market Revenue, 2021-2026 ($)
Figure 17: Global Disconnect Switch Market - By Geography
Figure 18: Global Disconnect Switch Market Value & Volume, By Geography, 2021-2026 ($)
Figure 19: Global Disconnect Switch Market CAGR, By Geography, 2021-2026 (%)
Figure 20: North America Disconnect Switch Market Value & Volume, 2021-2026 ($)
Figure 21: US Disconnect Switch Market Value & Volume, 2021-2026 ($)
Figure 22: US GDP and Population, 2018-2019 ($)
Figure 23: US GDP – Composition of 2018, By Sector of Origin
Figure 24: US Export and Import Value & Volume, 2018-2019 ($)
Figure 25: Canada Disconnect Switch Market Value & Volume, 2021-2026 ($)
Figure 26: Canada GDP and Population, 2018-2019 ($)
Figure 27: Canada GDP – Composition of 2018, By Sector of Origin
Figure 28: Canada Export and Import Value & Volume, 2018-2019 ($)
Figure 29: Mexico Disconnect Switch Market Value & Volume, 2021-2026 ($)
Figure 30: Mexico GDP and Population, 2018-2019 ($)
Figure 31: Mexico GDP – Composition of 2018, By Sector of Origin
Figure 32: Mexico Export and Import Value & Volume, 2018-2019 ($)
Figure 33: South America Disconnect Switch Market Value & Volume, 2021-2026 ($)
Figure 34: Brazil Disconnect Switch Market Value & Volume, 2021-2026 ($)
Figure 35: Brazil GDP and Population, 2018-2019 ($)
Figure 36: Brazil GDP – Composition of 2018, By Sector of Origin
Figure 37: Brazil Export and Import Value & Volume, 2018-2019 ($)
Figure 38: Venezuela Disconnect Switch Market Value & Volume, 2021-2026 ($)
Figure 39: Venezuela GDP and Population, 2018-2019 ($)
Figure 40: Venezuela GDP – Composition of 2018, By Sector of Origin
Figure 41: Venezuela Export and Import Value & Volume, 2018-2019 ($)
Figure 42: Argentina Disconnect Switch Market Value & Volume, 2021-2026 ($)
Figure 43: Argentina GDP and Population, 2018-2019 ($)
Figure 44: Argentina GDP – Composition of 2018, By Sector of Origin
Figure 45: Argentina Export and Import Value & Volume, 2018-2019 ($)
Figure 46: Ecuador Disconnect Switch Market Value & Volume, 2021-2026 ($)
Figure 47: Ecuador GDP and Population, 2018-2019 ($)
Figure 48: Ecuador GDP – Composition of 2018, By Sector of Origin
Figure 49: Ecuador Export and Import Value & Volume, 2018-2019 ($)
Figure 50: Peru Disconnect Switch Market Value & Volume, 2021-2026 ($)
Figure 51: Peru GDP and Population, 2018-2019 ($)
Figure 52: Peru GDP – Composition of 2018, By Sector of Origin
Figure 53: Peru Export and Import Value & Volume, 2018-2019 ($)
Figure 54: Colombia Disconnect Switch Market Value & Volume, 2021-2026 ($)
Figure 55: Colombia GDP and Population, 2018-2019 ($)
Figure 56: Colombia GDP – Composition of 2018, By Sector of Origin
Figure 57: Colombia Export and Import Value & Volume, 2018-2019 ($)
Figure 58: Costa Rica Disconnect Switch Market Value & Volume, 2021-2026 ($)
Figure 59: Costa Rica GDP and Population, 2018-2019 ($)
Figure 60: Costa Rica GDP – Composition of 2018, By Sector of Origin
Figure 61: Costa Rica Export and Import Value & Volume, 2018-2019 ($)
Figure 62: Europe Disconnect Switch Market Value & Volume, 2021-2026 ($)
Figure 63: U.K Disconnect Switch Market Value & Volume, 2021-2026 ($)
Figure 64: U.K GDP and Population, 2018-2019 ($)
Figure 65: U.K GDP – Composition of 2018, By Sector of Origin
Figure 66: U.K Export and Import Value & Volume, 2018-2019 ($)
Figure 67: Germany Disconnect Switch Market Value & Volume, 2021-2026 ($)
Figure 68: Germany GDP and Population, 2018-2019 ($)
Figure 69: Germany GDP – Composition of 2018, By Sector of Origin
Figure 70: Germany Export and Import Value & Volume, 2018-2019 ($)
Figure 71: Italy Disconnect Switch Market Value & Volume, 2021-2026 ($)
Figure 72: Italy GDP and Population, 2018-2019 ($)
Figure 73: Italy GDP – Composition of 2018, By Sector of Origin
Figure 74: Italy Export and Import Value & Volume, 2018-2019 ($)
Figure 75: France Disconnect Switch Market Value & Volume, 2021-2026 ($)
Figure 76: France GDP and Population, 2018-2019 ($)
Figure 77: France GDP – Composition of 2018, By Sector of Origin
Figure 78: France Export and Import Value & Volume, 2018-2019 ($)
Figure 79: Netherlands Disconnect Switch Market Value & Volume, 2021-2026 ($)
Figure 80: Netherlands GDP and Population, 2018-2019 ($)
Figure 81: Netherlands GDP – Composition of 2018, By Sector of Origin
Figure 82: Netherlands Export and Import Value & Volume, 2018-2019 ($)
Figure 83: Belgium Disconnect Switch Market Value & Volume, 2021-2026 ($)
Figure 84: Belgium GDP and Population, 2018-2019 ($)
Figure 85: Belgium GDP – Composition of 2018, By Sector of Origin
Figure 86: Belgium Export and Import Value & Volume, 2018-2019 ($)
Figure 87: Spain Disconnect Switch Market Value & Volume, 2021-2026 ($)
Figure 88: Spain GDP and Population, 2018-2019 ($)
Figure 89: Spain GDP – Composition of 2018, By Sector of Origin
Figure 90: Spain Export and Import Value & Volume, 2018-2019 ($)
Figure 91: Denmark Disconnect Switch Market Value & Volume, 2021-2026 ($)
Figure 92: Denmark GDP and Population, 2018-2019 ($)
Figure 93: Denmark GDP – Composition of 2018, By Sector of Origin
Figure 94: Denmark Export and Import Value & Volume, 2018-2019 ($)
Figure 95: APAC Disconnect Switch Market Value & Volume, 2021-2026 ($)
Figure 96: China Disconnect Switch Market Value & Volume, 2021-2026
Figure 97: China GDP and Population, 2018-2019 ($)
Figure 98: China GDP – Composition of 2018, By Sector of Origin
Figure 99: China Export and Import Value & Volume, 2018-2019 ($) Disconnect Switch Market China Export and Import Value & Volume, 2018-2019 ($)
Figure 100: Australia Disconnect Switch Market Value & Volume, 2021-2026 ($)
Figure 101: Australia GDP and Population, 2018-2019 ($)
Figure 102: Australia GDP – Composition of 2018, By Sector of Origin
Figure 103: Australia Export and Import Value & Volume, 2018-2019 ($)
Figure 104: South Korea Disconnect Switch Market Value & Volume, 2021-2026 ($)
Figure 105: South Korea GDP and Population, 2018-2019 ($)
Figure 106: South Korea GDP – Composition of 2018, By Sector of Origin
Figure 107: South Korea Export and Import Value & Volume, 2018-2019 ($)
Figure 108: India Disconnect Switch Market Value & Volume, 2021-2026 ($)
Figure 109: India GDP and Population, 2018-2019 ($)
Figure 110: India GDP – Composition of 2018, By Sector of Origin
Figure 111: India Export and Import Value & Volume, 2018-2019 ($)
Figure 112: Taiwan Disconnect Switch Market Value & Volume, 2021-2026 ($)
Figure 113: Taiwan GDP and Population, 2018-2019 ($)
Figure 114: Taiwan GDP – Composition of 2018, By Sector of Origin
Figure 115: Taiwan Export and Import Value & Volume, 2018-2019 ($)
Figure 116: Malaysia Disconnect Switch Market Value & Volume, 2021-2026 ($)
Figure 117: Malaysia GDP and Population, 2018-2019 ($)
Figure 118: Malaysia GDP – Composition of 2018, By Sector of Origin
Figure 119: Malaysia Export and Import Value & Volume, 2018-2019 ($)
Figure 120: Hong Kong Disconnect Switch Market Value & Volume, 2021-2026 ($)
Figure 121: Hong Kong GDP and Population, 2018-2019 ($)
Figure 122: Hong Kong GDP – Composition of 2018, By Sector of Origin
Figure 123: Hong Kong Export and Import Value & Volume, 2018-2019 ($)
Figure 124: Middle East & Africa Disconnect Switch Market Middle East & Africa 3D Printing Market Value & Volume, 2021-2026 ($)
Figure 125: Russia Disconnect Switch Market Value & Volume, 2021-2026 ($)
Figure 126: Russia GDP and Population, 2018-2019 ($)
Figure 127: Russia GDP – Composition of 2018, By Sector of Origin
Figure 128: Russia Export and Import Value & Volume, 2018-2019 ($)
Figure 129: Israel Disconnect Switch Market Value & Volume, 2021-2026 ($)
Figure 130: Israel GDP and Population, 2018-2019 ($)
Figure 131: Israel GDP – Composition of 2018, By Sector of Origin
Figure 132: Israel Export and Import Value & Volume, 2018-2019 ($)
Figure 133: Entropy Share, By Strategies, 2018-2019* (%) Disconnect Switch Market
Figure 134: Developments, 2018-2019* Disconnect Switch Market
Figure 135: Company 1 Disconnect Switch Market Net Revenue, By Years, 2018-2019* ($)
Figure 136: Company 1 Disconnect Switch Market Net Revenue Share, By Business segments, 2018 (%)
Figure 137: Company 1 Disconnect Switch Market Net Sales Share, By Geography, 2018 (%)
Figure 138: Company 2 Disconnect Switch Market Net Revenue, By Years, 2018-2019* ($)
Figure 139: Company 2 Disconnect Switch Market Net Revenue Share, By Business segments, 2018 (%)
Figure 140: Company 2 Disconnect Switch Market Net Sales Share, By Geography, 2018 (%)
Figure 141: Company 3 Disconnect Switch Market Net Revenue, By Years, 2018-2019* ($)
Figure 142: Company 3 Disconnect Switch Market Net Revenue Share, By Business segments, 2018 (%)
Figure 143: Company 3 Disconnect Switch Market Net Sales Share, By Geography, 2018 (%)
Figure 144: Company 4 Disconnect Switch Market Net Revenue, By Years, 2018-2019* ($)
Figure 145: Company 4 Disconnect Switch Market Net Revenue Share, By Business segments, 2018 (%)
Figure 146: Company 4 Disconnect Switch Market Net Sales Share, By Geography, 2018 (%)
Figure 147: Company 5 Disconnect Switch Market Net Revenue, By Years, 2018-2019* ($)
Figure 148: Company 5 Disconnect Switch Market Net Revenue Share, By Business segments, 2018 (%)
Figure 149: Company 5 Disconnect Switch Market Net Sales Share, By Geography, 2018 (%)
Figure 150: Company 6 Disconnect Switch Market Net Revenue, By Years, 2018-2019* ($)
Figure 151: Company 6 Disconnect Switch Market Net Revenue Share, By Business segments, 2018 (%)
Figure 152: Company 6 Disconnect Switch Market Net Sales Share, By Geography, 2018 (%)
Figure 153: Company 7 Disconnect Switch Market Net Revenue, By Years, 2018-2019* ($)
Figure 154: Company 7 Disconnect Switch Market Net Revenue Share, By Business segments, 2018 (%)
Figure 155: Company 7 Disconnect Switch Market Net Sales Share, By Geography, 2018 (%)
Figure 156: Company 8 Disconnect Switch Market Net Revenue, By Years, 2018-2019* ($)
Figure 157: Company 8 Disconnect Switch Market Net Revenue Share, By Business segments, 2018 (%)
Figure 158: Company 8 Disconnect Switch Market Net Sales Share, By Geography, 2018 (%)
Figure 159: Company 9 Disconnect Switch Market Net Revenue, By Years, 2018-2019* ($)
Figure 160: Company 9 Disconnect Switch Market Net Revenue Share, By Business segments, 2018 (%)
Figure 161: Company 9 Disconnect Switch Market Net Sales Share, By Geography, 2018 (%)
Figure 162: Company 10 Disconnect Switch Market Net Revenue, By Years, 2018-2019* ($)
Figure 163: Company 10 Disconnect Switch Market Net Revenue Share, By Business segments, 2018 (%)
Figure 164: Company 10 Disconnect Switch Market Net Sales Share, By Geography, 2018 (%)
Figure 165: Company 11 Disconnect Switch Market Net Revenue, By Years, 2018-2019* ($)
Figure 166: Company 11 Disconnect Switch Market Net Revenue Share, By Business segments, 2018 (%)
Figure 167: Company 11 Disconnect Switch Market Net Sales Share, By Geography, 2018 (%)
Figure 168: Company 12 Disconnect Switch Market Net Revenue, By Years, 2018-2019* ($)
Figure 169: Company 12 Disconnect Switch Market Net Revenue Share, By Business segments, 2018 (%)
Figure 170: Company 12 Disconnect Switch Market Net Sales Share, By Geography, 2018 (%)
Figure 171: Company 13 Disconnect Switch Market Net Revenue, By Years, 2018-2019* ($)
Figure 172: Company 13 Disconnect Switch Market Net Revenue Share, By Business segments, 2018 (%)
Figure 173: Company 13 Disconnect Switch Market Net Sales Share, By Geography, 2018 (%)
Figure 174: Company 14 Disconnect Switch Market Net Revenue, By Years, 2018-2019* ($)
Figure 175: Company 14 Disconnect Switch Market Net Revenue Share, By Business segments, 2018 (%)
Figure 176: Company 14 Disconnect Switch Market Net Sales Share, By Geography, 2018 (%)
Figure 177: Company 15 Disconnect Switch Market Net Revenue, By Years, 2018-2019* ($)
Figure 178: Company 15 Disconnect Switch Market Net Revenue Share, By Business segments, 2018 (%)
Figure 179: Company 15 Disconnect Switch Market Net Sales Share, By Geography, 2018 (%)