 Email
Email Print
Print


Adipic acid is a white transparent fine particle in appearance. This organic composite is essential and commercially available as synthetic dicarboxylic acid, mostly used as a key ingredient for the making of nylon. Adipic acid is also used in the chemical industry to create other polymers, coatings, plasticizers and detergents. Nearly all adipic acid are formed from cyclohexane, though some are made from phenol. Adipic acid is also used for creating consumer products such as dish washing tablets. For making such consumer products suitable regulations are there in order to safeguard the end product by specifying it on the packaging. Adipic acid is used in various applications such as polyamides, adipate/Adipic esters, polyurethane, polyester polyols, food additives, pharmaceuticals and others. The Adipic acid is broadly divided into material types such as engineering, plastics, fibres, and others.
Nylon polymers and polyester polyols are used in the production of hot-melt adhesives mainly for shoe soles and other, witness to grow swiftly in market. Nylon 66 industrial filament will be the one of the rapidly growing market for adipic acid in the forecast period, focused by advancement in China. The global market for Adipic acid was estimated to be $XX billion in 2015 and is predictable to grow at a CAGR of XX% and is estimate to reach $XX billion by 2021. Nylon 66 & Polyurethane are forecast to have the highest growth of X% during the forecast period 2016-2021.
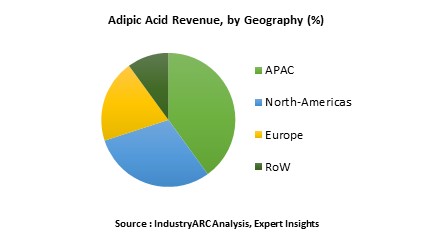
Asia-Pacific (APAC) is the leading market for Adipic acid and is forecast to have highest growth in the next few years due to growing hot-melt adhesives application. North America Adipic acid market accounts to XX% of the global market for Adipic acid and is the next fastest growing market followed by Europe.
Nylon polymers and polyester polyols are used in the production of hot-melt adhesives mainly for shoe soles and other, witness to grow swiftly in market. Nylon 66 industrial filament will be the one of the rapidly growing market for adipic acid in the forecast period, focused by advancement in China. The global market for Adipic acid was estimated to be $XX billion in 2015 and is predictable to grow at a CAGR of XX% and is estimate to reach $XX billion by 2021. Nylon 66 & Polyurethane are forecast to have the highest growth of X% during the forecast period 2016-2021.
Asia-Pacific (APAC) is the leading market for Adipic acid and is forecast to have highest growth in the next few years due to growing hot-melt adhesives application. North America Adipic acid market accounts to XX% of the global market for Adipic acid and is the next fastest growing market followed by Europe.
Sample Companies Profiled in this Report are:
- BioAmber Inc.
- DuPont Chemicals
- Radici Group
- Teknor Apex Company
- Zell-Metal Engineering Plastics
- 10+.
1. Market Overview
2. Executive Summary
3. Adipic Acid Market Landscape
3.1. Market Share Analysis
3.2. Comparative Analysis
3.2.1. Product Benchmarking
3.2.2. End User Profiling
3.2.3. Top 5 Financials Analysis
4. Adipic Acid Market Forces
4.1. Market Drivers
4.2. Market Constraints & Challenges
4.3. Attractiveness Of The Adipic Acid Industry
4.3.1. Power Of Suppliers
4.3.2. Threats From New Entrants
4.3.3. Power Of Buyer
4.3.4. Threat From Substitute Product
4.3.5. Degree Of Competition
5. Adipic Acid Market-Strategic Analysis
5.1. Adipic Acid Market - Value Chain Analysis
5.2. Pricing Analysis
5.3. Opportunity Analysis
5.4. Product Life Cycle
5.5. Suppliers And Distributors
6. Adipic Acid Market -By Application
6.1. Polyamides
6.1.1. Nylon Polymer
6.1.2. Nylon 66 Fiber
6.1.3. Nylon 66 Resin
6.1.4. Kelvar
6.2. Adipate /Adipic Esters(Plasticizers)
6.3. Polyurethane
6.4. Polyester Polyols
6.5. Food Additives
6.6. Pharmaceuticals
6.7. Others
7. Adipic Acid Market -By Material Type
7.1. Engineering
7.2. Plastics
7.2.1. Packaging Films And Coatings
7.2.2. Wire And Cable
7.2.3. Consumer Goods
7.2.4. Automotive
7.3. Fibres
7.3.1. Textile Filament
7.3.2. Staple Fiber
7.3.3. Industrial Filament
7.3.4. Carpet Filament
7.4. Others
8. Adipic Acid Market-By Geography
8.1. Americas
8.1.1. U.S.
8.1.2. Canada
8.1.3. Mexico
8.1.4. Brazil
8.1.5. Others
8.2. Europe
8.2.1. U.K.
8.2.2. Germany
8.2.3. Italy
8.2.4. Others
8.3. Asia-Pacific
8.3.1. China
8.3.2. South Korea
8.3.3. Japan
8.3.4. India
8.3.5. Others
8.4. Rest Of The World (Row)
9. Adipic Acid Market Entropy
9.1. New Product Developments
9.2. Product Launches, JVs , Mergers and Acquisitions
10. Company Profiles
"*Financials would be provided on a best efforts basis for private companies"
2. Executive Summary
3. Adipic Acid Market Landscape
3.1. Market Share Analysis
3.2. Comparative Analysis
3.2.1. Product Benchmarking
3.2.2. End User Profiling
3.2.3. Top 5 Financials Analysis
4. Adipic Acid Market Forces
4.1. Market Drivers
4.2. Market Constraints & Challenges
4.3. Attractiveness Of The Adipic Acid Industry
4.3.1. Power Of Suppliers
4.3.2. Threats From New Entrants
4.3.3. Power Of Buyer
4.3.4. Threat From Substitute Product
4.3.5. Degree Of Competition
5. Adipic Acid Market-Strategic Analysis
5.1. Adipic Acid Market - Value Chain Analysis
5.2. Pricing Analysis
5.3. Opportunity Analysis
5.4. Product Life Cycle
5.5. Suppliers And Distributors
6. Adipic Acid Market -By Application
6.1. Polyamides
6.1.1. Nylon Polymer
6.1.2. Nylon 66 Fiber
6.1.3. Nylon 66 Resin
6.1.4. Kelvar
6.2. Adipate /Adipic Esters(Plasticizers)
6.3. Polyurethane
6.4. Polyester Polyols
6.5. Food Additives
6.6. Pharmaceuticals
6.7. Others
7. Adipic Acid Market -By Material Type
7.1. Engineering
7.2. Plastics
7.2.1. Packaging Films And Coatings
7.2.2. Wire And Cable
7.2.3. Consumer Goods
7.2.4. Automotive
7.3. Fibres
7.3.1. Textile Filament
7.3.2. Staple Fiber
7.3.3. Industrial Filament
7.3.4. Carpet Filament
7.4. Others
8. Adipic Acid Market-By Geography
8.1. Americas
8.1.1. U.S.
8.1.2. Canada
8.1.3. Mexico
8.1.4. Brazil
8.1.5. Others
8.2. Europe
8.2.1. U.K.
8.2.2. Germany
8.2.3. Italy
8.2.4. Others
8.3. Asia-Pacific
8.3.1. China
8.3.2. South Korea
8.3.3. Japan
8.3.4. India
8.3.5. Others
8.4. Rest Of The World (Row)
9. Adipic Acid Market Entropy
9.1. New Product Developments
9.2. Product Launches, JVs , Mergers and Acquisitions
10. Company Profiles
10.1. Company 1
10.2. Company 2
10.3. Company 3
10.4. Company 4
10.5. Company 5
10.6. Company 6
10.7. Company 7
10.8. Company 8
10.9. Company 9
10.10. Company 10
*More than 10 Companies are profiled in this Research Report*"*Financials would be provided on a best efforts basis for private companies"
11. Appendix
11.1. Abbreviations
11.2. Sources
11.3. Research Methodology
11.4. Bibliography
11.5. Compilation of Expert Insights
11.6. Disclaimer
List of Tables:
Table 1: Adipic Acid Market Overview 2021-2026
Table 2: Adipic Acid Market Leader Analysis 2018-2019 (US$)
Table 3: Adipic Acid Market Product Analysis 2018-2019 (US$)
Table 4: Adipic Acid Market End User Analysis 2018-2019 (US$)
Table 5: Adipic Acid Market Patent Analysis 2013-2018* (US$)
Table 6: Adipic Acid Market Financial Analysis 2018-2019 (US$)
Table 7: Adipic Acid Market Driver Analysis 2018-2019 (US$)
Table 8: Adipic Acid Market Challenges Analysis 2018-2019 (US$)
Table 9: Adipic Acid Market Constraint Analysis 2018-2019 (US$)
Table 10: Adipic Acid Market Supplier Bargaining Power Analysis 2018-2019 (US$)
Table 11: Adipic Acid Market Buyer Bargaining Power Analysis 2018-2019 (US$)
Table 12: Adipic Acid Market Threat of Substitutes Analysis 2018-2019 (US$)
Table 13: Adipic Acid Market Threat of New Entrants Analysis 2018-2019 (US$)
Table 14: Adipic Acid Market Degree of Competition Analysis 2018-2019 (US$)
Table 15: Adipic Acid Market Value Chain Analysis 2018-2019 (US$)
Table 16: Adipic Acid Market Pricing Analysis 2021-2026 (US$)
Table 17: Adipic Acid Market Opportunities Analysis 2021-2026 (US$)
Table 18: Adipic Acid Market Product Life Cycle Analysis 2021-2026 (US$)
Table 19: Adipic Acid Market Supplier Analysis 2018-2019 (US$)
Table 20: Adipic Acid Market Distributor Analysis 2018-2019 (US$)
Table 21: Adipic Acid Market Trend Analysis 2018-2019 (US$)
Table 22: Adipic Acid Market Size 2018 (US$)
Table 23: Adipic Acid Market Forecast Analysis 2021-2026 (US$)
Table 24: Adipic Acid Market Sales Forecast Analysis 2021-2026 (Units)
Table 25: Adipic Acid Market, Revenue & Volume,By Material Type, 2021-2026 ($)
Table 26: Adipic Acid Market By Material Type, Revenue & Volume,By Engineering, 2021-2026 ($)
Table 27: Adipic Acid Market By Material Type, Revenue & Volume,By Plastics, 2021-2026 ($)
Table 28: Adipic Acid Market By Material Type, Revenue & Volume,By Fibres, 2021-2026 ($)
Table 29: Adipic Acid Market, Revenue & Volume,By Application, 2021-2026 ($)
Table 30: Adipic Acid Market By Application, Revenue & Volume,By Polyamides, 2021-2026 ($)
Table 31: Adipic Acid Market By Application, Revenue & Volume,By Adipate /Adipic Esters(Plasticizers), 2021-2026 ($)
Table 32: Adipic Acid MarketBy Application, Revenue & Volume,By Polyurethane, 2021-2026 ($)
Table 33: Adipic Acid MarketBy Application, Revenue & Volume,By Polyester Polyols, 2021-2026 ($)
Table 34: Adipic Acid MarketBy Application, Revenue & Volume,By Food Additives, 2021-2026 ($)
Table 35: North America Adipic Acid Market, Revenue & Volume,By Material Type, 2021-2026 ($)
Table 36: North America Adipic Acid Market, Revenue & Volume,By Application, 2021-2026 ($)
Table 37: South america Adipic Acid Market, Revenue & Volume,By Material Type, 2021-2026 ($)
Table 38: South america Adipic Acid Market, Revenue & Volume,By Application, 2021-2026 ($)
Table 39: Europe Adipic Acid Market, Revenue & Volume,By Material Type, 2021-2026 ($)
Table 40: Europe Adipic Acid Market, Revenue & Volume,By Application, 2021-2026 ($)
Table 41: APAC Adipic Acid Market, Revenue & Volume,By Material Type, 2021-2026 ($)
Table 42: APAC Adipic Acid Market, Revenue & Volume,By Application, 2021-2026 ($)
Table 43: Middle East & Africa Adipic Acid Market, Revenue & Volume,By Material Type, 2021-2026 ($)
Table 44: Middle East & Africa Adipic Acid Market, Revenue & Volume,By Application, 2021-2026 ($)
Table 45: Russia Adipic Acid Market, Revenue & Volume,By Material Type, 2021-2026 ($)
Table 46: Russia Adipic Acid Market, Revenue & Volume,By Application, 2021-2026 ($)
Table 47: Israel Adipic Acid Market, Revenue & Volume,By Material Type, 2021-2026 ($)
Table 48: Israel Adipic Acid Market, Revenue & Volume,By Application, 2021-2026 ($)
Table 49: Top Companies 2018 (US$)Adipic Acid Market, Revenue & Volume,,
Table 50: Product Launch 2018-2019Adipic Acid Market, Revenue & Volume,,
Table 51: Mergers & Acquistions 2018-2019Adipic Acid Market, Revenue & Volume,,
List of Figures:
Figure 1: Overview of Adipic Acid Market 2021-2026
Figure 2: Market Share Analysis for Adipic Acid Market 2018 (US$)
Figure 3: Product Comparison in Adipic Acid Market 2018-2019 (US$)
Figure 4: End User Profile for Adipic Acid Market 2018-2019 (US$)
Figure 5: Patent Application and Grant in Adipic Acid Market 2013-2018* (US$)
Figure 6: Top 5 Companies Financial Analysis in Adipic Acid Market 2018-2019 (US$)
Figure 7: Market Entry Strategy in Adipic Acid Market 2018-2019
Figure 8: Ecosystem Analysis in Adipic Acid Market2018
Figure 9: Average Selling Price in Adipic Acid Market 2021-2026
Figure 10: Top Opportunites in Adipic Acid Market 2018-2019
Figure 11: Market Life Cycle Analysis in Adipic Acid Market
Figure 12: GlobalBy Material TypeAdipic Acid Market Revenue, 2021-2026 ($)
Figure 13: GlobalBy ApplicationAdipic Acid Market Revenue, 2021-2026 ($)
Figure 14: Global Adipic Acid Market - By Geography
Figure 15: Global Adipic Acid Market Value & Volume, By Geography, 2021-2026 ($)
Figure 16: Global Adipic Acid Market CAGR, By Geography, 2021-2026 (%)
Figure 17: North America Adipic Acid Market Value & Volume, 2021-2026 ($)
Figure 18: US Adipic Acid Market Value & Volume, 2021-2026 ($)
Figure 19: US GDP and Population, 2018-2019 ($)
Figure 20: US GDP – Composition of 2018, By Sector of Origin
Figure 21: US Export and Import Value & Volume, 2018-2019 ($)
Figure 22: Canada Adipic Acid Market Value & Volume, 2021-2026 ($)
Figure 23: Canada GDP and Population, 2018-2019 ($)
Figure 24: Canada GDP – Composition of 2018, By Sector of Origin
Figure 25: Canada Export and Import Value & Volume, 2018-2019 ($)
Figure 26: Mexico Adipic Acid Market Value & Volume, 2021-2026 ($)
Figure 27: Mexico GDP and Population, 2018-2019 ($)
Figure 28: Mexico GDP – Composition of 2018, By Sector of Origin
Figure 29: Mexico Export and Import Value & Volume, 2018-2019 ($)
Figure 30: South America Adipic Acid MarketSouth America 3D Printing Market Value & Volume, 2021-2026 ($)
Figure 31: Brazil Adipic Acid Market Value & Volume, 2021-2026 ($)
Figure 32: Brazil GDP and Population, 2018-2019 ($)
Figure 33: Brazil GDP – Composition of 2018, By Sector of Origin
Figure 34: Brazil Export and Import Value & Volume, 2018-2019 ($)
Figure 35: Venezuela Adipic Acid Market Value & Volume, 2021-2026 ($)
Figure 36: Venezuela GDP and Population, 2018-2019 ($)
Figure 37: Venezuela GDP – Composition of 2018, By Sector of Origin
Figure 38: Venezuela Export and Import Value & Volume, 2018-2019 ($)
Figure 39: Argentina Adipic Acid Market Value & Volume, 2021-2026 ($)
Figure 40: Argentina GDP and Population, 2018-2019 ($)
Figure 41: Argentina GDP – Composition of 2018, By Sector of Origin
Figure 42: Argentina Export and Import Value & Volume, 2018-2019 ($)
Figure 43: Ecuador Adipic Acid Market Value & Volume, 2021-2026 ($)
Figure 44: Ecuador GDP and Population, 2018-2019 ($)
Figure 45: Ecuador GDP – Composition of 2018, By Sector of Origin
Figure 46: Ecuador Export and Import Value & Volume, 2018-2019 ($)
Figure 47: Peru Adipic Acid Market Value & Volume, 2021-2026 ($)
Figure 48: Peru GDP and Population, 2018-2019 ($)
Figure 49: Peru GDP – Composition of 2018, By Sector of Origin
Figure 50: Peru Export and Import Value & Volume, 2018-2019 ($)
Figure 51: Colombia Adipic Acid Market Value & Volume, 2021-2026 ($)
Figure 52: Colombia GDP and Population, 2018-2019 ($)
Figure 53: Colombia GDP – Composition of 2018, By Sector of Origin
Figure 54: Colombia Export and Import Value & Volume, 2018-2019 ($)
Figure 55: Costa Rica Adipic Acid MarketCosta Rica 3D Printing Market Value & Volume, 2021-2026 ($)
Figure 56: Costa Rica GDP and Population, 2018-2019 ($)
Figure 57: Costa Rica GDP – Composition of 2018, By Sector of Origin
Figure 58: Costa Rica Export and Import Value & Volume, 2018-2019 ($)
Figure 59: Europe Adipic Acid Market Value & Volume, 2021-2026 ($)
Figure 60: U.K Adipic Acid Market Value & Volume, 2021-2026 ($)
Figure 61: U.K GDP and Population, 2018-2019 ($)
Figure 62: U.K GDP – Composition of 2018, By Sector of Origin
Figure 63: U.K Export and Import Value & Volume, 2018-2019 ($)
Figure 64: Germany Adipic Acid Market Value & Volume, 2021-2026 ($)
Figure 65: Germany GDP and Population, 2018-2019 ($)
Figure 66: Germany GDP – Composition of 2018, By Sector of Origin
Figure 67: Germany Export and Import Value & Volume, 2018-2019 ($)
Figure 68: Italy Adipic Acid Market Value & Volume, 2021-2026 ($)
Figure 69: Italy GDP and Population, 2018-2019 ($)
Figure 70: Italy GDP – Composition of 2018, By Sector of Origin
Figure 71: Italy Export and Import Value & Volume, 2018-2019 ($)
Figure 72: France Adipic Acid Market Value & Volume, 2021-2026 ($)
Figure 73: France GDP and Population, 2018-2019 ($)
Figure 74: France GDP – Composition of 2018, By Sector of Origin
Figure 75: France Export and Import Value & Volume, 2018-2019 ($)
Figure 76: Netherlands Adipic Acid Market Value & Volume, 2021-2026 ($)
Figure 77: Netherlands GDP and Population, 2018-2019 ($)
Figure 78: Netherlands GDP – Composition of 2018, By Sector of Origin
Figure 79: Netherlands Export and Import Value & Volume, 2018-2019 ($)
Figure 80: Belgium Adipic Acid Market Value & Volume, 2021-2026 ($)
Figure 81: Belgium GDP and Population, 2018-2019 ($)
Figure 82: Belgium GDP – Composition of 2018, By Sector of Origin
Figure 83: Belgium Export and Import Value & Volume, 2018-2019 ($)
Figure 84: Spain Adipic Acid Market Value & Volume, 2021-2026 ($)
Figure 85: Spain GDP and Population, 2018-2019 ($)
Figure 86: Spain GDP – Composition of 2018, By Sector of Origin
Figure 87: Spain Export and Import Value & Volume, 2018-2019 ($)
Figure 88: Denmark Adipic Acid Market Value & Volume, 2021-2026 ($)
Figure 89: Denmark GDP and Population, 2018-2019 ($)
Figure 90: Denmark GDP – Composition of 2018, By Sector of Origin
Figure 91: Denmark Export and Import Value & Volume, 2018-2019 ($)
Figure 92: APAC Adipic Acid Market Value & Volume, 2021-2026 ($)
Figure 93: China Adipic Acid MarketValue & Volume, 2021-2026
Figure 94: China GDP and Population, 2018-2019 ($)
Figure 95: China GDP – Composition of 2018, By Sector of Origin
Figure 96: China Export and Import Value & Volume, 2018-2019 ($)Adipic Acid MarketChina Export and Import Value & Volume, 2018-2019 ($)
Figure 97: Australia Adipic Acid Market Value & Volume, 2021-2026 ($)
Figure 98: Australia GDP and Population, 2018-2019 ($)
Figure 99: Australia GDP – Composition of 2018, By Sector of Origin
Figure 100: Australia Export and Import Value & Volume, 2018-2019 ($)
Figure 101: South Korea Adipic Acid Market Value & Volume, 2021-2026 ($)
Figure 102: South Korea GDP and Population, 2018-2019 ($)
Figure 103: South Korea GDP – Composition of 2018, By Sector of Origin
Figure 104: South Korea Export and Import Value & Volume, 2018-2019 ($)
Figure 105: India Adipic Acid Market Value & Volume, 2021-2026 ($)
Figure 106: India GDP and Population, 2018-2019 ($)
Figure 107: India GDP – Composition of 2018, By Sector of Origin
Figure 108: India Export and Import Value & Volume, 2018-2019 ($)
Figure 109: Taiwan Adipic Acid MarketTaiwan 3D Printing Market Value & Volume, 2021-2026 ($)
Figure 110: Taiwan GDP and Population, 2018-2019 ($)
Figure 111: Taiwan GDP – Composition of 2018, By Sector of Origin
Figure 112: Taiwan Export and Import Value & Volume, 2018-2019 ($)
Figure 113: Malaysia Adipic Acid MarketMalaysia 3D Printing Market Value & Volume, 2021-2026 ($)
Figure 114: Malaysia GDP and Population, 2018-2019 ($)
Figure 115: Malaysia GDP – Composition of 2018, By Sector of Origin
Figure 116: Malaysia Export and Import Value & Volume, 2018-2019 ($)
Figure 117: Hong Kong Adipic Acid MarketHong Kong 3D Printing Market Value & Volume, 2021-2026 ($)
Figure 118: Hong Kong GDP and Population, 2018-2019 ($)
Figure 119: Hong Kong GDP – Composition of 2018, By Sector of Origin
Figure 120: Hong Kong Export and Import Value & Volume, 2018-2019 ($)
Figure 121: Middle East & Africa Adipic Acid MarketMiddle East & Africa 3D Printing Market Value & Volume, 2021-2026 ($)
Figure 122: Russia Adipic Acid MarketRussia 3D Printing Market Value & Volume, 2021-2026 ($)
Figure 123: Russia GDP and Population, 2018-2019 ($)
Figure 124: Russia GDP – Composition of 2018, By Sector of Origin
Figure 125: Russia Export and Import Value & Volume, 2018-2019 ($)
Figure 126: Israel Adipic Acid Market Value & Volume, 2021-2026 ($)
Figure 127: Israel GDP and Population, 2018-2019 ($)
Figure 128: Israel GDP – Composition of 2018, By Sector of Origin
Figure 129: Israel Export and Import Value & Volume, 2018-2019 ($)
Figure 130: Entropy Share, By Strategies, 2018-2019* (%)Adipic Acid Market
Figure 131: Developments, 2018-2019*Adipic Acid Market
Figure 132: Company 1 Adipic Acid Market Net Revenue, By Years, 2018-2019* ($)
Figure 133: Company 1 Adipic Acid Market Net Revenue Share, By Business segments, 2018 (%)
Figure 134: Company 1 Adipic Acid Market Net Sales Share, By Geography, 2018 (%)
Figure 135: Company 2 Adipic Acid Market Net Revenue, By Years, 2018-2019* ($)
Figure 136: Company 2 Adipic Acid Market Net Revenue Share, By Business segments, 2018 (%)
Figure 137: Company 2 Adipic Acid Market Net Sales Share, By Geography, 2018 (%)
Figure 138: Company 3Adipic Acid Market Net Revenue, By Years, 2018-2019* ($)
Figure 139: Company 3Adipic Acid Market Net Revenue Share, By Business segments, 2018 (%)
Figure 140: Company 3Adipic Acid Market Net Sales Share, By Geography, 2018 (%)
Figure 141: Company 4 Adipic Acid Market Net Revenue, By Years, 2018-2019* ($)
Figure 142: Company 4 Adipic Acid Market Net Revenue Share, By Business segments, 2018 (%)
Figure 143: Company 4 Adipic Acid Market Net Sales Share, By Geography, 2018 (%)
Figure 144: Company 5 Adipic Acid Market Net Revenue, By Years, 2018-2019* ($)
Figure 145: Company 5 Adipic Acid Market Net Revenue Share, By Business segments, 2018 (%)
Figure 146: Company 5 Adipic Acid Market Net Sales Share, By Geography, 2018 (%)
Figure 147: Company 6 Adipic Acid Market Net Revenue, By Years, 2018-2019* ($)
Figure 148: Company 6 Adipic Acid Market Net Revenue Share, By Business segments, 2018 (%)
Figure 149: Company 6 Adipic Acid Market Net Sales Share, By Geography, 2018 (%)
Figure 150: Company 7 Adipic Acid Market Net Revenue, By Years, 2018-2019* ($)
Figure 151: Company 7 Adipic Acid Market Net Revenue Share, By Business segments, 2018 (%)
Figure 152: Company 7 Adipic Acid Market Net Sales Share, By Geography, 2018 (%)
Figure 153: Company 8 Adipic Acid Market Net Revenue, By Years, 2018-2019* ($)
Figure 154: Company 8 Adipic Acid Market Net Revenue Share, By Business segments, 2018 (%)
Figure 155: Company 8 Adipic Acid Market Net Sales Share, By Geography, 2018 (%)
Figure 156: Company 9 Adipic Acid Market Net Revenue, By Years, 2018-2019* ($)
Figure 157: Company 9 Adipic Acid Market Net Revenue Share, By Business segments, 2018 (%)
Figure 158: Company 9 Adipic Acid Market Net Sales Share, By Geography, 2018 (%)
Figure 159: Company 10 Adipic Acid Market Net Revenue, By Years, 2018-2019* ($)
Figure 160: Company 10 Adipic Acid Market Net Revenue Share, By Business segments, 2018 (%)
Figure 161: Company 10 Adipic Acid Market Net Sales Share, By Geography, 2018 (%)
Figure 162: Company 11 Adipic Acid Market Net Revenue, By Years, 2018-2019* ($)
Figure 163: Company 11 Adipic Acid Market Net Revenue Share, By Business segments, 2018 (%)
Figure 164: Company 11 Adipic Acid Market Net Sales Share, By Geography, 2018 (%)
Figure 165: Company 12 Adipic Acid Market Net Revenue, By Years, 2018-2019* ($)
Figure 166: Company 12 Adipic Acid Market Net Revenue Share, By Business segments, 2018 (%)
Figure 167: Company 12 Adipic Acid Market Net Sales Share, By Geography, 2018 (%)
Figure 168: Company 13Adipic Acid Market Net Revenue, By Years, 2018-2019* ($)
Figure 169: Company 13Adipic Acid Market Net Revenue Share, By Business segments, 2018 (%)
Figure 170: Company 13Adipic Acid Market Net Sales Share, By Geography, 2018 (%)
Figure 171: Company 14 Adipic Acid Market Net Revenue, By Years, 2018-2019* ($)
Figure 172: Company 14 Adipic Acid Market Net Revenue Share, By Business segments, 2018 (%)
Figure 173: Company 14 Adipic Acid Market Net Sales Share, By Geography, 2018 (%)
Figure 174: Company 15 Adipic Acid Market Net Revenue, By Years, 2018-2019* ($)
Figure 175: Company 15 Adipic Acid Market Net Revenue Share, By Business segments, 2018 (%)
Figure 176: Company 15 Adipic Acid Market Net Sales Share, By Geography, 2018 (%)