 Email
Email Print
Print


Gas Turbines Market Overview:
Over the past few years gas turbines have witnessed exponential growth due to the technological advances that have resulted in the design and development of highly efficient gas turbine units. Gas turbines are used in diversified services from jet engines and simple mechanical drives on land, sea and air to sophisticated gas lasers and supersonic wind tunnels. In the aerospace applications these units are referred to as jets, turbojets, turbofans, and turboprops. In land and sea based applications these units are referred to as mechanical drive gas turbines. Gas turbines are increasingly being used in power plants both in the utility and power sectors for their tremendous energy producing capacity, compactness, inherent flexibility, high performance, operational availability and multiple fuel capability. Aerospace sector seems to be the most promising sector in future due increasing investments in manufacturing and migration across various regions.
Based on the design type of gas turbines commercially available, this market is classified as industrial, heavy duty and aero derivative. Due to the rise in population and rapid industrialization, the dependence on natural gas is increasing which can be impetuous in gas turbines. Various turbines are used for different applications depending up on the power requirement. Another important trend that drives growth for the gas turbine is growing aerospace industry.
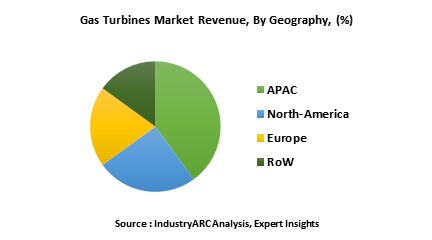
The gas turbines market is scrutinized by segments including design type, capacity, technology, application and geography. Based on technology in accordance to the operation cycles, the market is segmented into combined cycle and open cycle. The report also comprises of the region wise study of the global market including Americas, Europe, Asia-Pacific and Rest of the World.
Amongst the applications, aerospace has the highest CAGR of 4.78% for the forecast period 2017 to 2021. Industrial turbines held the major share in gas turbines market for 2016, during the forecast period of 2017 to 2021. Escalating demand less GHG emissive fossil fuel for power generation is propelling the growth of gas turbines market.
Sample companies profiled in this report are:
- Siemens AG
- General Electric Company
- Solar Turbines
- Ansaldo Energia
- 10+
1. Gas Turbines Market - Overview
1.1. Definitions and Scope
2. Gas Turbines Market - Executive summary
2.1. Market Revenue, Market Size and Key Trends by Company
2.2. Key Trends by type of Application
2.3. Key Trends segmented by Geography
3. Gas Turbines Market
3.1. Comparative analysis
3.1.1. Product Benchmarking - Top 10 companies
3.1.2. Top 5 Financials Analysis
3.1.3. Market Value split by Top 10 companies
3.1.4. Patent Analysis - Top 10 companies
3.1.5. Pricing Analysis
4. Gas Turbines Market – Startup companies Scenario Premium
4.1. Top 10 startup company Analysis by
4.1.1. Investment
4.1.2. Revenue
4.1.3. Market Shares
4.1.4. Market Size and Application Analysis
4.1.5. Venture Capital and Funding Scenario
5. Gas Turbines Market – Industry Market Entry Scenario Premium
5.1. Regulatory Framework Overview
5.2. New Business and Ease of Doing business index
5.3. Case studies of successful ventures
5.4. Customer Analysis – Top 10 companies
6. Gas Turbines Market Forces
6.1. Drivers
6.2. Constraints
6.3. Challenges
6.4. Porters five force model
6.4.1. Bargaining power of suppliers
6.4.2. Bargaining powers of customers
6.4.3. Threat of new entrants
6.4.4. Rivalry among existing players
6.4.5. Threat of substitutes
7. Gas Turbines Market -Strategic analysis
7.1. Value chain analysis
7.2. Opportunities analysis
7.3. Product life cycle
7.4. Suppliers and distributors Market Share
8. Gas Turbines Market – By Design Type (Market Size -$Million / $Billion)
8.1. Market Size and Market Share Analysis
8.2. Application Revenue and Trend Research
8.3. Product Segment Analysis
8.3.1. Heavy Duty
8.3.2. Industrial
8.3.3. Aero Derivative
9. Gas Turbines Market – By Capacity (Market Size -$Million / $Billion)
9.1. 1-40 MW
9.2. 40-150 MW
9.3. 150-300 MW
9.4. Above 300 MW
10. Gas Turbines Market – By Technology (Market Size -$Million / $Billion)
10.1. Open Cycle
10.2. Combined Cycle
11. Gas Turbines Market – By Application (Market Size -$Million / $Billion)
11.1. Power Generation
11.2. Oil & Gas
11.3. Marine
11.4. Aerospace
11.5. Others
12. Gas Turbines - By Geography (Market Size -$Million / $Billion)
12.1. Gas Turbines Market - North America Segment Research
12.2. North America Market Research (Million / $Billion)
12.2.1. Segment type Size and Market Size Analysis
12.2.2. Revenue and Trends
12.2.3. Application Revenue and Trends by type of Application
12.2.4. Company Revenue and Product Analysis
12.2.5. North America Product type and Application Market Size
12.2.5.1. U.S.
12.2.5.2. Canada
12.2.5.3. Mexico
12.2.5.4. Rest of North America
12.3. Gas Turbines - South America Segment Research
12.4. South America Market Research (Market Size -$Million / $Billion)
12.4.1. Segment type Size and Market Size Analysis
12.4.2. Revenue and Trends
12.4.3. Application Revenue and Trends by type of Application
12.4.4. Company Revenue and Product Analysis
12.4.5. South America Product type and Application Market Size
12.4.5.1. Brazil
12.4.5.2. Venezuela
12.4.5.3. Argentina
12.4.5.4. Ecuador
12.4.5.5. Peru
12.4.5.6. Colombia
12.4.5.7. Costa Rica
12.4.5.8. Rest of South America
12.5. Gas Turbines - Europe Segment Research
12.6. Europe Market Research (Market Size -$Million / $Billion)
12.6.1. Segment type Size and Market Size Analysis
12.6.2. Revenue and Trends
12.6.3. Application Revenue and Trends by type of Application
12.6.4. Company Revenue and Product Analysis
12.6.5. Europe Segment Product type and Application Market Size
12.6.5.1. U.K
12.6.5.2. Germany
12.6.5.3. Italy
12.6.5.4. France
12.6.5.5. Netherlands
12.6.5.6. Belgium
12.6.5.7. Spain
12.6.5.8. Denmark
12.6.5.9. Rest of Europe
12.7. Gas Turbines – APAC Segment Research
12.8. APAC Market Research (Market Size -$Million / $Billion)
12.8.1. Segment type Size and Market Size Analysis
12.8.2. Revenue and Trends
12.8.3. Application Revenue and Trends by type of Application
12.8.4. Company Revenue and Product Analysis
12.8.5. APAC Segment – Product type and Application Market Size
12.8.5.1. China
12.8.5.2. Australia
12.8.5.3. Japan
12.8.5.4. South Korea
12.8.5.5. India
12.8.5.6. Taiwan
12.8.5.7. Malaysia
13. Gas Turbines Market - Entropy
13.1. New product launches
13.2. M&A's, collaborations, JVs and partnerships
14. Gas Turbines Market – Industry / Segment Competition landscape Premium
14.1. Market Share Analysis
14.1.1. Market Share by Country- Top companies
14.1.2. Market Share by Region- Top 10 companies
14.1.3. Market Share by type of Application – Top 10 companies
14.1.4. Market Share by type of Product / Product category- Top 10 companies
14.1.5. Market Share at global level- Top 10 companies
14.1.6. Best Practises for companies
15. Gas Turbines Market – Key Company List by Country Premium
16. Gas Turbines Market Company Analysis
16.1. Market Share, Company Revenue, Products, M&A, Developments
16.2. Siemens A.G.
16.3. General Electric
16.4. Mitsubishi Heavy Industries
16.5. Ansaldo Energia
16.6. Solar Turbines
16.7. United Engine Corporation
16.8. Zorya Mashproekt Corporation
16.9. MAN Turbomachinery
16.10. Power Machines
16.11. Opra Turbines B.V.
16.12. Company 11
16.13. Company 12
16.14. Company 13
"*Financials would be provided on a best efforts basis for private companies"
17. Gas Turbines Market -Appendix
17.1. Abbreviations
17.2. Sources
18. Gas Turbines Market -Methodology Premium
18.1. Research Methodology
18.1.1. Company Expert Interviews
18.1.2. Industry Databases
18.1.3. Associations
18.1.4. Company News
18.1.5. Company Annual Reports
18.1.6. Application Trends
18.1.7. New Products and Product database
18.1.8. Company Transcripts
18.1.9. R&D Trends
18.1.10. Key Opinion Leaders Interviews
18.1.11. Supply and Demand Trends
List of Tables
Table 1: Gas Turbines Market Overview 2021-2026
Table 2: Gas Turbines Market Leader Analysis 2018-2019 (US$)
Table 3: Gas Turbines Market Product Analysis 2018-2019 (US$)
Table 4: Gas Turbines Market End User Analysis 2018-2019 (US$)
Table 5: Gas Turbines Market Patent Analysis 2013-2018* (US$)
Table 6: Gas Turbines Market Financial Analysis 2018-2019 (US$)
Table 7: Gas Turbines Market Driver Analysis 2018-2019 (US$)
Table 8: Gas Turbines Market Challenges Analysis 2018-2019 (US$)
Table 9: Gas Turbines Market Constraint Analysis 2018-2019 (US$)
Table 10: Gas Turbines Market Supplier Bargaining Power Analysis 2018-2019 (US$)
Table 11: Gas Turbines Market Buyer Bargaining Power Analysis 2018-2019 (US$)
Table 12: Gas Turbines Market Threat of Substitutes Analysis 2018-2019 (US$)
Table 13: Gas Turbines Market Threat of New Entrants Analysis 2018-2019 (US$)
Table 14: Gas Turbines Market Degree of Competition Analysis 2018-2019 (US$)
Table 15: Gas Turbines Market Value Chain Analysis 2018-2019 (US$)
Table 16: Gas Turbines Market Pricing Analysis 2021-2026 (US$)
Table 17: Gas Turbines Market Opportunities Analysis 2021-2026 (US$)
Table 18: Gas Turbines Market Product Life Cycle Analysis 2021-2026 (US$)
Table 19: Gas Turbines Market Supplier Analysis 2018-2019 (US$)
Table 20: Gas Turbines Market Distributor Analysis 2018-2019 (US$)
Table 21: Gas Turbines Market Trend Analysis 2018-2019 (US$)
Table 22: Gas Turbines Market Size 2018 (US$)
Table 23: Gas Turbines Market Forecast Analysis 2021-2026 (US$)
Table 24: Gas Turbines Market Sales Forecast Analysis 2021-2026 (Units)
Table 25: Gas Turbines Market, Revenue & Volume, By Capacity, 2021-2026 ($)
Table 26: Gas Turbines Market By Capacity, Revenue & Volume, By 1-40 MW, 2021-2026 ($)
Table 27: Gas Turbines Market By Capacity, Revenue & Volume, By 40-150 MW, 2021-2026 ($)
Table 28: Gas Turbines Market By Capacity, Revenue & Volume, By 150-300 MW, 2021-2026 ($)
Table 29: Gas Turbines Market By Capacity, Revenue & Volume, By Above 300 MW, 2021-2026 ($)
Table 30: Gas Turbines Market, Revenue & Volume, By Design Type, 2021-2026 ($)
Table 31: Gas Turbines Market By Design Type, Revenue & Volume, By Heavy Duty, 2021-2026 ($)
Table 32: Gas Turbines Market By Design Type, Revenue & Volume, By Industrial, 2021-2026 ($)
Table 33: Gas Turbines Market By Design Type, Revenue & Volume, By Aero Derivative, 2021-2026 ($)
Table 34: Gas Turbines Market, Revenue & Volume, By Technology, 2021-2026 ($)
Table 35: Gas Turbines Market By Technology, Revenue & Volume, By Open Cycle, 2021-2026 ($)
Table 36: Gas Turbines Market By Technology, Revenue & Volume, By Combined Cycle, 2021-2026 ($)
Table 37: Gas Turbines Market, Revenue & Volume, By Application, 2021-2026 ($)
Table 38: Gas Turbines Market By Application, Revenue & Volume, By Power Generation, 2021-2026 ($)
Table 39: Gas Turbines Market By Application, Revenue & Volume, By Oil & Gas, 2021-2026 ($)
Table 40: Gas Turbines Market By Application, Revenue & Volume, By Marine, 2021-2026 ($)
Table 41: Gas Turbines Market By Application, Revenue & Volume, By Aerospace, 2021-2026 ($)
Table 42: North America Gas Turbines Market, Revenue & Volume, By Capacity, 2021-2026 ($)
Table 43: North America Gas Turbines Market, Revenue & Volume, By Design Type, 2021-2026 ($)
Table 44: North America Gas Turbines Market, Revenue & Volume, By Technology, 2021-2026 ($)
Table 45: North America Gas Turbines Market, Revenue & Volume, By Application, 2021-2026 ($)
Table 46: South america Gas Turbines Market, Revenue & Volume, By Capacity, 2021-2026 ($)
Table 47: South america Gas Turbines Market, Revenue & Volume, By Design Type, 2021-2026 ($)
Table 48: South america Gas Turbines Market, Revenue & Volume, By Technology, 2021-2026 ($)
Table 49: South america Gas Turbines Market, Revenue & Volume, By Application, 2021-2026 ($)
Table 50: Europe Gas Turbines Market, Revenue & Volume, By Capacity, 2021-2026 ($)
Table 51: Europe Gas Turbines Market, Revenue & Volume, By Design Type, 2021-2026 ($)
Table 52: Europe Gas Turbines Market, Revenue & Volume, By Technology, 2021-2026 ($)
Table 53: Europe Gas Turbines Market, Revenue & Volume, By Application, 2021-2026 ($)
Table 54: APAC Gas Turbines Market, Revenue & Volume, By Capacity, 2021-2026 ($)
Table 55: APAC Gas Turbines Market, Revenue & Volume, By Design Type, 2021-2026 ($)
Table 56: APAC Gas Turbines Market, Revenue & Volume, By Technology, 2021-2026 ($)
Table 57: APAC Gas Turbines Market, Revenue & Volume, By Application, 2021-2026 ($)
Table 58: Middle East & Africa Gas Turbines Market, Revenue & Volume, By Capacity, 2021-2026 ($)
Table 59: Middle East & Africa Gas Turbines Market, Revenue & Volume, By Design Type, 2021-2026 ($)
Table 60: Middle East & Africa Gas Turbines Market, Revenue & Volume, By Technology, 2021-2026 ($)
Table 61: Middle East & Africa Gas Turbines Market, Revenue & Volume, By Application, 2021-2026 ($)
Table 62: Russia Gas Turbines Market, Revenue & Volume, By Capacity, 2021-2026 ($)
Table 63: Russia Gas Turbines Market, Revenue & Volume, By Design Type, 2021-2026 ($)
Table 64: Russia Gas Turbines Market, Revenue & Volume, By Technology, 2021-2026 ($)
Table 65: Russia Gas Turbines Market, Revenue & Volume, By Application, 2021-2026 ($)
Table 66: Israel Gas Turbines Market, Revenue & Volume, By Capacity, 2021-2026 ($)
Table 67: Israel Gas Turbines Market, Revenue & Volume, By Design Type, 2021-2026 ($)
Table 68: Israel Gas Turbines Market, Revenue & Volume, By Technology, 2021-2026 ($)
Table 69: Israel Gas Turbines Market, Revenue & Volume, By Application, 2021-2026 ($)
Table 70: Top Companies 2018 (US$)Gas Turbines Market, Revenue & Volume
Table 71: Product Launch 2018-2019Gas Turbines Market, Revenue & Volume
Table 72: Mergers & Acquistions 2018-2019Gas Turbines Market, Revenue & Volume
List of Figures
Figure 1: Overview of Gas Turbines Market 2021-2026
Figure 2: Market Share Analysis for Gas Turbines Market 2018 (US$)
Figure 3: Product Comparison in Gas Turbines Market 2018-2019 (US$)
Figure 4: End User Profile for Gas Turbines Market 2018-2019 (US$)
Figure 5: Patent Application and Grant in Gas Turbines Market 2013-2018* (US$)
Figure 6: Top 5 Companies Financial Analysis in Gas Turbines Market 2018-2019 (US$)
Figure 7: Market Entry Strategy in Gas Turbines Market 2018-2019
Figure 8: Ecosystem Analysis in Gas Turbines Market 2018
Figure 9: Average Selling Price in Gas Turbines Market 2021-2026
Figure 10: Top Opportunites in Gas Turbines Market 2018-2019
Figure 11: Market Life Cycle Analysis in Gas Turbines Market
Figure 12: GlobalBy CapacityGas Turbines Market Revenue, 2021-2026 ($)
Figure 13: GlobalBy Design TypeGas Turbines Market Revenue, 2021-2026 ($)
Figure 14: GlobalBy TechnologyGas Turbines Market Revenue, 2021-2026 ($)
Figure 15: GlobalBy ApplicationGas Turbines Market Revenue, 2021-2026 ($)
Figure 16: Global Gas Turbines Market - By Geography
Figure 17: Global Gas Turbines Market Value & Volume, By Geography, 2021-2026 ($)
Figure 18: Global Gas Turbines Market CAGR, By Geography, 2021-2026 (%)
Figure 19: North America Gas Turbines Market Value & Volume, 2021-2026 ($)
Figure 20: US Gas Turbines Market Value & Volume, 2021-2026 ($)
Figure 21: US GDP and Population, 2018-2019 ($)
Figure 22: US GDP – Composition of 2018, By Sector of Origin
Figure 23: US Export and Import Value & Volume, 2018-2019 ($)
Figure 24: Canada Gas Turbines Market Value & Volume, 2021-2026 ($)
Figure 25: Canada GDP and Population, 2018-2019 ($)
Figure 26: Canada GDP – Composition of 2018, By Sector of Origin
Figure 27: Canada Export and Import Value & Volume, 2018-2019 ($)
Figure 28: Mexico Gas Turbines Market Value & Volume, 2021-2026 ($)
Figure 29: Mexico GDP and Population, 2018-2019 ($)
Figure 30: Mexico GDP – Composition of 2018, By Sector of Origin
Figure 31: Mexico Export and Import Value & Volume, 2018-2019 ($)
Figure 32: South America Gas Turbines Market Value & Volume, 2021-2026 ($)
Figure 33: Brazil Gas Turbines Market Value & Volume, 2021-2026 ($)
Figure 34: Brazil GDP and Population, 2018-2019 ($)
Figure 35: Brazil GDP – Composition of 2018, By Sector of Origin
Figure 36: Brazil Export and Import Value & Volume, 2018-2019 ($)
Figure 37: Venezuela Gas Turbines Market Value & Volume, 2021-2026 ($)
Figure 38: Venezuela GDP and Population, 2018-2019 ($)
Figure 39: Venezuela GDP – Composition of 2018, By Sector of Origin
Figure 40: Venezuela Export and Import Value & Volume, 2018-2019 ($)
Figure 41: Argentina Gas Turbines Market Value & Volume, 2021-2026 ($)
Figure 42: Argentina GDP and Population, 2018-2019 ($)
Figure 43: Argentina GDP – Composition of 2018, By Sector of Origin
Figure 44: Argentina Export and Import Value & Volume, 2018-2019 ($)
Figure 45: Ecuador Gas Turbines Market Value & Volume, 2021-2026 ($)
Figure 46: Ecuador GDP and Population, 2018-2019 ($)
Figure 47: Ecuador GDP – Composition of 2018, By Sector of Origin
Figure 48: Ecuador Export and Import Value & Volume, 2018-2019 ($)
Figure 49: Peru Gas Turbines Market Value & Volume, 2021-2026 ($)
Figure 50: Peru GDP and Population, 2018-2019 ($)
Figure 51: Peru GDP – Composition of 2018, By Sector of Origin
Figure 52: Peru Export and Import Value & Volume, 2018-2019 ($)
Figure 53: Colombia Gas Turbines Market Value & Volume, 2021-2026 ($)
Figure 54: Colombia GDP and Population, 2018-2019 ($)
Figure 55: Colombia GDP – Composition of 2018, By Sector of Origin
Figure 56: Colombia Export and Import Value & Volume, 2018-2019 ($)
Figure 57: Costa Rica Gas Turbines Market Value & Volume, 2021-2026 ($)
Figure 58: Costa Rica GDP and Population, 2018-2019 ($)
Figure 59: Costa Rica GDP – Composition of 2018, By Sector of Origin
Figure 60: Costa Rica Export and Import Value & Volume, 2018-2019 ($)
Figure 61: Europe Gas Turbines Market Value & Volume, 2021-2026 ($)
Figure 62: U.K Gas Turbines Market Value & Volume, 2021-2026 ($)
Figure 63: U.K GDP and Population, 2018-2019 ($)
Figure 64: U.K GDP – Composition of 2018, By Sector of Origin
Figure 65: U.K Export and Import Value & Volume, 2018-2019 ($)
Figure 66: Germany Gas Turbines Market Value & Volume, 2021-2026 ($)
Figure 67: Germany GDP and Population, 2018-2019 ($)
Figure 68: Germany GDP – Composition of 2018, By Sector of Origin
Figure 69: Germany Export and Import Value & Volume, 2018-2019 ($)
Figure 70: Italy Gas Turbines Market Value & Volume, 2021-2026 ($)
Figure 71: Italy GDP and Population, 2018-2019 ($)
Figure 72: Italy GDP – Composition of 2018, By Sector of Origin
Figure 73: Italy Export and Import Value & Volume, 2018-2019 ($)
Figure 74: France Gas Turbines Market Value & Volume, 2021-2026 ($)
Figure 75: France GDP and Population, 2018-2019 ($)
Figure 76: France GDP – Composition of 2018, By Sector of Origin
Figure 77: France Export and Import Value & Volume, 2018-2019 ($)
Figure 78: Netherlands Gas Turbines Market Value & Volume, 2021-2026 ($)
Figure 79: Netherlands GDP and Population, 2018-2019 ($)
Figure 80: Netherlands GDP – Composition of 2018, By Sector of Origin
Figure 81: Netherlands Export and Import Value & Volume, 2018-2019 ($)
Figure 82: Belgium Gas Turbines Market Value & Volume, 2021-2026 ($)
Figure 83: Belgium GDP and Population, 2018-2019 ($)
Figure 84: Belgium GDP – Composition of 2018, By Sector of Origin
Figure 85: Belgium Export and Import Value & Volume, 2018-2019 ($)
Figure 86: Spain Gas Turbines Market Value & Volume, 2021-2026 ($)
Figure 87: Spain GDP and Population, 2018-2019 ($)
Figure 88: Spain GDP – Composition of 2018, By Sector of Origin
Figure 89: Spain Export and Import Value & Volume, 2018-2019 ($)
Figure 90: Denmark Gas Turbines Market Value & Volume, 2021-2026 ($)
Figure 91: Denmark GDP and Population, 2018-2019 ($)
Figure 92: Denmark GDP – Composition of 2018, By Sector of Origin
Figure 93: Denmark Export and Import Value & Volume, 2018-2019 ($)
Figure 94: APAC Gas Turbines Market Value & Volume, 2021-2026 ($)
Figure 95: China Gas Turbines Market Value & Volume, 2021-2026
Figure 96: China GDP and Population, 2018-2019 ($)
Figure 97: China GDP – Composition of 2018, By Sector of Origin
Figure 98: China Export and Import Value & Volume, 2018-2019 ($)Gas Turbines Market China Export and Import Value & Volume, 2018-2019 ($)
Figure 99: Australia Gas Turbines Market Value & Volume, 2021-2026 ($)
Figure 100: Australia GDP and Population, 2018-2019 ($)
Figure 101: Australia GDP – Composition of 2018, By Sector of Origin
Figure 102: Australia Export and Import Value & Volume, 2018-2019 ($)
Figure 103: South Korea Gas Turbines Market Value & Volume, 2021-2026 ($)
Figure 104: South Korea GDP and Population, 2018-2019 ($)
Figure 105: South Korea GDP – Composition of 2018, By Sector of Origin
Figure 106: South Korea Export and Import Value & Volume, 2018-2019 ($)
Figure 107: India Gas Turbines Market Value & Volume, 2021-2026 ($)
Figure 108: India GDP and Population, 2018-2019 ($)
Figure 109: India GDP – Composition of 2018, By Sector of Origin
Figure 110: India Export and Import Value & Volume, 2018-2019 ($)
Figure 111: Taiwan Gas Turbines Market Value & Volume, 2021-2026 ($)
Figure 112: Taiwan GDP and Population, 2018-2019 ($)
Figure 113: Taiwan GDP – Composition of 2018, By Sector of Origin
Figure 114: Taiwan Export and Import Value & Volume, 2018-2019 ($)
Figure 115: Malaysia Gas Turbines Market Value & Volume, 2021-2026 ($)
Figure 116: Malaysia GDP and Population, 2018-2019 ($)
Figure 117: Malaysia GDP – Composition of 2018, By Sector of Origin
Figure 118: Malaysia Export and Import Value & Volume, 2018-2019 ($)
Figure 119: Hong Kong Gas Turbines Market Value & Volume, 2021-2026 ($)
Figure 120: Hong Kong GDP and Population, 2018-2019 ($)
Figure 121: Hong Kong GDP – Composition of 2018, By Sector of Origin
Figure 122: Hong Kong Export and Import Value & Volume, 2018-2019 ($)
Figure 123: Middle East & Africa Gas Turbines Market Middle East & Africa 3D Printing Market Value & Volume, 2021-2026 ($)
Figure 124: Russia Gas Turbines Market Value & Volume, 2021-2026 ($)
Figure 125: Russia GDP and Population, 2018-2019 ($)
Figure 126: Russia GDP – Composition of 2018, By Sector of Origin
Figure 127: Russia Export and Import Value & Volume, 2018-2019 ($)
Figure 128: Israel Gas Turbines Market Value & Volume, 2021-2026 ($)
Figure 129: Israel GDP and Population, 2018-2019 ($)
Figure 130: Israel GDP – Composition of 2018, By Sector of Origin
Figure 131: Israel Export and Import Value & Volume, 2018-2019 ($)
Figure 132: Entropy Share, By Strategies, 2018-2019* (%)Gas Turbines Market
Figure 133: Developments, 2018-2019*Gas Turbines Market
Figure 134: Company 1 Gas Turbines Market Net Revenue, By Years, 2018-2019* ($)
Figure 135: Company 1 Gas Turbines Market Net Revenue Share, By Business segments, 2018 (%)
Figure 136: Company 1 Gas Turbines Market Net Sales Share, By Geography, 2018 (%)
Figure 137: Company 2 Gas Turbines Market Net Revenue, By Years, 2018-2019* ($)
Figure 138: Company 2 Gas Turbines Market Net Revenue Share, By Business segments, 2018 (%)
Figure 139: Company 2 Gas Turbines Market Net Sales Share, By Geography, 2018 (%)
Figure 140: Company 3 Gas Turbines Market Net Revenue, By Years, 2018-2019* ($)
Figure 141: Company 3 Gas Turbines Market Net Revenue Share, By Business segments, 2018 (%)
Figure 142: Company 3 Gas Turbines Market Net Sales Share, By Geography, 2018 (%)
Figure 143: Company 4 Gas Turbines Market Net Revenue, By Years, 2018-2019* ($)
Figure 144: Company 4 Gas Turbines Market Net Revenue Share, By Business segments, 2018 (%)
Figure 145: Company 4 Gas Turbines Market Net Sales Share, By Geography, 2018 (%)
Figure 146: Company 5 Gas Turbines Market Net Revenue, By Years, 2018-2019* ($)
Figure 147: Company 5 Gas Turbines Market Net Revenue Share, By Business segments, 2018 (%)
Figure 148: Company 5 Gas Turbines Market Net Sales Share, By Geography, 2018 (%)
Figure 149: Company 6 Gas Turbines Market Net Revenue, By Years, 2018-2019* ($)
Figure 150: Company 6 Gas Turbines Market Net Revenue Share, By Business segments, 2018 (%)
Figure 151: Company 6 Gas Turbines Market Net Sales Share, By Geography, 2018 (%)
Figure 152: Company 7 Gas Turbines Market Net Revenue, By Years, 2018-2019* ($)
Figure 153: Company 7 Gas Turbines Market Net Revenue Share, By Business segments, 2018 (%)
Figure 154: Company 7 Gas Turbines Market Net Sales Share, By Geography, 2018 (%)
Figure 155: Company 8 Gas Turbines Market Net Revenue, By Years, 2018-2019* ($)
Figure 156: Company 8 Gas Turbines Market Net Revenue Share, By Business segments, 2018 (%)
Figure 157: Company 8 Gas Turbines Market Net Sales Share, By Geography, 2018 (%)
Figure 158: Company 9 Gas Turbines Market Net Revenue, By Years, 2018-2019* ($)
Figure 159: Company 9 Gas Turbines Market Net Revenue Share, By Business segments, 2018 (%)
Figure 160: Company 9 Gas Turbines Market Net Sales Share, By Geography, 2018 (%)
Figure 161: Company 10 Gas Turbines Market Net Revenue, By Years, 2018-2019* ($)
Figure 162: Company 10 Gas Turbines Market Net Revenue Share, By Business segments, 2018 (%)
Figure 163: Company 10 Gas Turbines Market Net Sales Share, By Geography, 2018 (%)
Figure 164: Company 11 Gas Turbines Market Net Revenue, By Years, 2018-2019* ($)
Figure 165: Company 11 Gas Turbines Market Net Revenue Share, By Business segments, 2018 (%)
Figure 166: Company 11 Gas Turbines Market Net Sales Share, By Geography, 2018 (%)
Figure 167: Company 12 Gas Turbines Market Net Revenue, By Years, 2018-2019* ($)
Figure 168: Company 12 Gas Turbines Market Net Revenue Share, By Business segments, 2018 (%)
Figure 169: Company 12 Gas Turbines Market Net Sales Share, By Geography, 2018 (%)
Figure 170: Company 13 Gas Turbines Market Net Revenue, By Years, 2018-2019* ($)
Figure 171: Company 13 Gas Turbines Market Net Revenue Share, By Business segments, 2018 (%)
Figure 172: Company 13 Gas Turbines Market Net Sales Share, By Geography, 2018 (%)
Figure 173: Company 14 Gas Turbines Market Net Revenue, By Years, 2018-2019* ($)
Figure 174: Company 14 Gas Turbines Market Net Revenue Share, By Business segments, 2018 (%)
Figure 175: Company 14 Gas Turbines Market Net Sales Share, By Geography, 2018 (%)
Figure 176: Company 15 Gas Turbines Market Net Revenue, By Years, 2018-2019* ($)
Figure 177: Company 15 Gas Turbines Market Net Revenue Share, By Business segments, 2018 (%)
Figure 178: Company 15 Gas Turbines Market Net Sales Share, By Geography, 2018 (%)