 Email
Email Print
Print


AMOLED Displays Market Overview
The
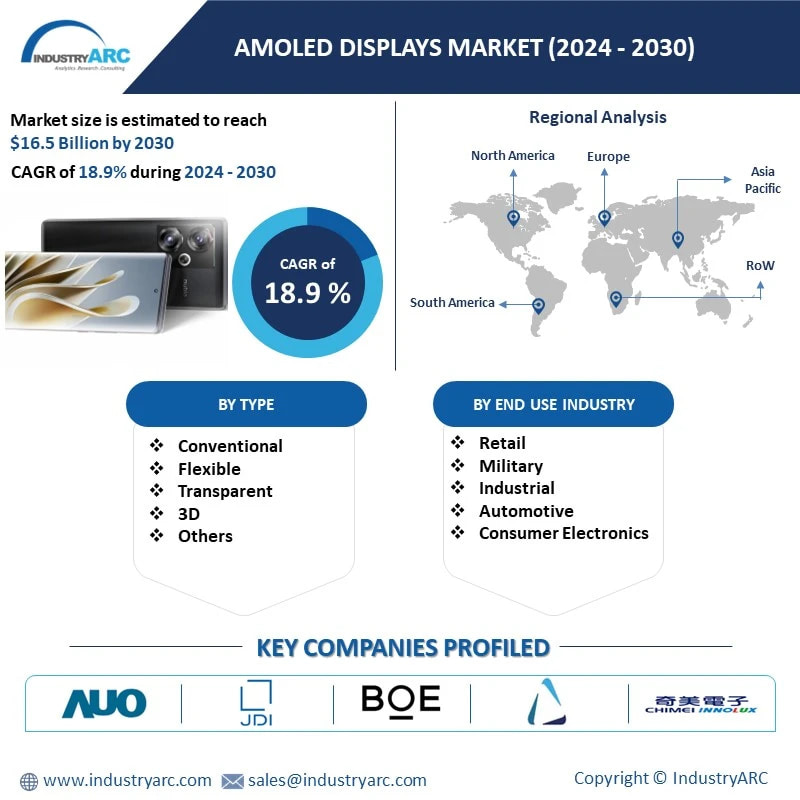
AMOLED Displays market size is forecast to reach USD 46.5 billion by 2030,
after growing at a CAGR of 18.9% during the forecast period 2024-2030. AMOLED
full form stands for Active-Matrix Organic Light Emitting Diode. It is a
display technology which pairs the active-matrix backplane from a traditional
TFT display with an OLED display. AMOLED displays have faster pixel switching
response times. As consumer demand for vibrant, energy-efficient, and flexible
displays continues to surge, the AMOLED market has become a focal point for
innovation and competition among industry players. One major trend driving the
AMOLED Displays Market is the increasing adoption of these displays in various
consumer electronics, including smartphones, smartwatches, and TVs. The ability
of AMOLED technology to deliver high-resolution, vivid colors, and deeper
blacks has contributed to its widespread integration in premium devices,
enhancing the overall viewing experience for users.
Moreover,
Technological advancements, particularly in manufacturing processes, have led
to improvements in production efficiency and cost reduction, making AMOLED
displays more economically viable for a broader range of devices. Additionally,
the market has witnessed innovations in pixel architectures and materials,
contributing to enhanced performance metrics such as refresh rates and energy
efficiency. The growing emphasis on sustainability and environmental
consciousness has influenced the AMOLED Displays Market, with manufacturers
focusing on developing eco-friendly materials and processes. This aligns with
the broader industry trend towards sustainable practices. In conclusion, the AMOLED
Displays Market is poised for continued growth, driven by consumer demand for
superior visual experiences, technological advancements, and a commitment to
sustainability. The market's dynamism and adaptability to changing consumer
preferences position it as a key player in the evolution of display
technologies.
Market Snapshot:
Report Coverage
The
report “AMOLED Displays Market –
Forecast (2024-2030)”, by IndustryARC, covers an in-depth analysis of the
following segments of the AMOLED Displays market.
By Type: Conventional,
Flexible, Transparent, 3D, and Others.
By End Use Industry:
Retail, Military, Industrial, Automotive, Consumer Electronics, and Others.
By Geography:
North America, South America, Europe, APAC,
and RoW.
Key Takeaways
·
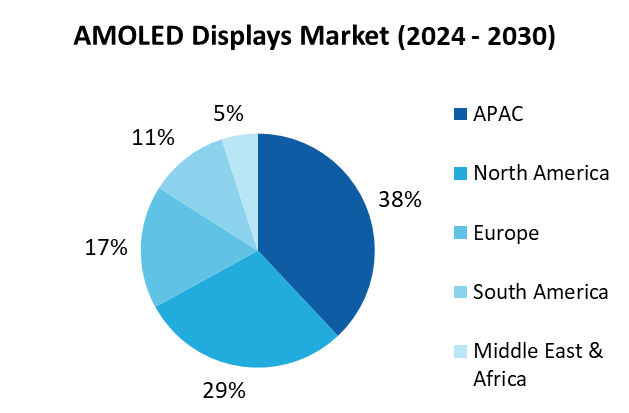
APAC held the largest market share
with 38% in 2023. APAC's dominance is attributed to the strong
presence of leading display manufacturers, technological advancements, and the
extensive adoption of AMOLED displays in various consumer electronics within
the region.
·
The Flexible AMOLED Display segment growing
fastest due to its versatility, enabling curved and foldable designs. Consumer
demand for innovative and sleek form factors propels its market growth.
By Product - Segment Analysis
By Geography - Segment Analysis
APAC held the largest market share with 38% in 2023. APAC's leadership is fueled by the robust presence of major display manufacturers, relentless technological innovations, and widespread adoption of AMOLED displays in cutting-edge consumer electronics. Countries such as China, South Korea, and Japan contribute significantly to this dominance, reflecting a dynamic market landscape shaped by continuous innovation and a burgeoning demand for high-quality displays in various applications. According to Japan Electronics and Information Technology Industries Association In 2022, domestic production by the Japanese electronics industry raised 2% year on year to US$ 85 billion.
For More Details on This Report - Request for Sample
Drivers – AMOLED Displays Market
· Technological
Advancements in Display Manufacturing
The AMOLED Display Market is significantly propelled by ongoing
technological advancements in display manufacturing. As technology continues to
evolve, manufacturers are incorporating innovations like flexible and
transparent AMOLED displays, enhancing the visual experience for consumers.
These advancements not only contribute to improved display quality but also
enable the production of innovative form factors, such as foldable smartphones
and curved screens. The quest for better energy efficiency, faster response
times, and enhanced color reproduction further drives research and development
activities, fostering a competitive landscape and stimulating market growth.
·
An
increase in the market's expenditure on research and development for AMOLED
displays
The surge in R&D investment is fuelling AMOLED Display Market
growth. Samsung Display leads with a $11.7 billion investment over three years,
focusing on innovations like foldable, transparent, and high-resolution
displays. These technologies promise transformative device
interactions—foldables creating versatile form factors, transparent displays
for car windshields, and high-resolution displays delivering stunning visuals.
LG Display prioritizes energy efficiency for AMOLEDs, ideal for wearables. Simultaneously,
BOE Technology aims to enhance affordability, expanding AMOLED accessibility to
a broader consumer base. These advancements underscore the dynamic landscape
and potential applications of AMOLED displays.
Challenges – AMOLED Displays Market
High
Production Costs
The AMOLED Display Market faces a significant
challenge related to high production costs and low manufacturing yields.
Despite the positive outlook for the market, these factors pose obstacles to
efficient and cost-effective production. The intricate manufacturing processes
involved in creating AMOLED displays contribute to elevated production
expenses. Additionally, the technology's sensitivity during manufacturing can
lead to lower yields, impacting overall cost-effectiveness. Addressing these
challenges requires continuous innovation in production techniques,
optimization of manufacturing workflows, and advancements in materials to
enhance yield rates and reduce costs.
Market Landscape
Technology
launches, acquisitions, and R&D activities are key strategies adopted by
players in the AMOLED Displays market. in 2023, The major players in the AMOLED
Displays market are AU Optronics, Japan Display Inc., US Micro Products, Anders
Electronics Plc., Chimei Innolux Corp., BOE Technology Group Co., Ltd, Everdisplay
Optronics (Shanghai) Co., Ltd., Visionox Company, Tianma, Truly Semiconductors
Ltd. Others.
Developments:
Ø In
February 2022, Samsung company unveiled the Samsung Galaxy S22 Ultra has a
dynamic AMOLED display of size 6.8 inches and approximately 90.2%
screen-to-body ratio. The resolution is 1440 x 3088 pixels with Corning Gorilla
Glass Victus+ protection and an always-on display.
Table1 AMOLED Displays Market Overview 2021-2026
Table2 AMOLED Displays Market Leader Analysis 2018-2019 (US$)
Table3 AMOLED Displays MarketProduct Analysis 2018-2019 (US$)
Table4 AMOLED Displays MarketEnd User Analysis 2018-2019 (US$)
Table5 AMOLED Displays MarketPatent Analysis 2013-2018* (US$)
Table6 AMOLED Displays MarketFinancial Analysis 2018-2019 (US$)
Table7 AMOLED Displays Market Driver Analysis 2018-2019 (US$)
Table8 AMOLED Displays MarketChallenges Analysis 2018-2019 (US$)
Table9 AMOLED Displays MarketConstraint Analysis 2018-2019 (US$)
Table10 AMOLED Displays Market Supplier Bargaining Power Analysis 2018-2019 (US$)
Table11 AMOLED Displays Market Buyer Bargaining Power Analysis 2018-2019 (US$)
Table12 AMOLED Displays Market Threat of Substitutes Analysis 2018-2019 (US$)
Table13 AMOLED Displays Market Threat of New Entrants Analysis 2018-2019 (US$)
Table14 AMOLED Displays Market Degree of Competition Analysis 2018-2019 (US$)
Table15 AMOLED Displays MarketValue Chain Analysis 2018-2019 (US$)
Table16 AMOLED Displays MarketPricing Analysis 2021-2026 (US$)
Table17 AMOLED Displays MarketOpportunities Analysis 2021-2026 (US$)
Table18 AMOLED Displays MarketProduct Life Cycle Analysis 2021-2026 (US$)
Table19 AMOLED Displays MarketSupplier Analysis 2018-2019 (US$)
Table20 AMOLED Displays MarketDistributor Analysis 2018-2019 (US$)
Table21 AMOLED Displays Market Trend Analysis 2018-2019 (US$)
Table22 AMOLED Displays Market Size 2018 (US$)
Table23 AMOLED Displays Market Forecast Analysis 2021-2026 (US$)
Table24 AMOLED Displays Market Sales Forecast Analysis 2021-2026 (Units)
Table25 AMOLED Displays Market, Revenue & Volume,By Type, 2021-2026 ($)
Table26 AMOLED Displays MarketBy Type, Revenue & Volume,By Conventional, 2021-2026 ($)
Table27 AMOLED Displays MarketBy Type, Revenue & Volume,By Flexible, 2021-2026 ($)
Table28 AMOLED Displays MarketBy Type, Revenue & Volume,By Transparent, 2021-2026 ($)
Table29 AMOLED Displays MarketBy Type, Revenue & Volume,By 3D, 2021-2026 ($)
Table30 AMOLED Displays Market, Revenue & Volume,By Application, 2021-2026 ($)
Table31 AMOLED Displays MarketBy Application, Revenue & Volume,By Retail, 2021-2026 ($)
Table32 AMOLED Displays MarketBy Application, Revenue & Volume,By Military, 2021-2026 ($)
Table33 AMOLED Displays MarketBy Application, Revenue & Volume,By Industrial, 2021-2026 ($)
Table34 AMOLED Displays MarketBy Application, Revenue & Volume,By Automotive, 2021-2026 ($)
Table35 AMOLED Displays MarketBy Application, Revenue & Volume,By Consumer Electronics, 2021-2026 ($)
Table36 North America AMOLED Displays Market, Revenue & Volume,By Type, 2021-2026 ($)
Table37 North America AMOLED Displays Market, Revenue & Volume,By Application, 2021-2026 ($)
Table38 South america AMOLED Displays Market, Revenue & Volume,By Type, 2021-2026 ($)
Table39 South america AMOLED Displays Market, Revenue & Volume,By Application, 2021-2026 ($)
Table40 Europe AMOLED Displays Market, Revenue & Volume,By Type, 2021-2026 ($)
Table41 Europe AMOLED Displays Market, Revenue & Volume,By Application, 2021-2026 ($)
Table42 APAC AMOLED Displays Market, Revenue & Volume,By Type, 2021-2026 ($)
Table43 APAC AMOLED Displays Market, Revenue & Volume,By Application, 2021-2026 ($)
Table44 Middle East & Africa AMOLED Displays Market, Revenue & Volume,By Type, 2021-2026 ($)
Table45 Middle East & Africa AMOLED Displays Market, Revenue & Volume,By Application, 2021-2026 ($)
Table46 Russia AMOLED Displays Market, Revenue & Volume,By Type, 2021-2026 ($)
Table47 Russia AMOLED Displays Market, Revenue & Volume,By Application, 2021-2026 ($)
Table48 Israel AMOLED Displays Market, Revenue & Volume,By Type, 2021-2026 ($)
Table49 Israel AMOLED Displays Market, Revenue & Volume,By Application, 2021-2026 ($)
Table50 Top Companies 2018 (US$)AMOLED Displays Market, Revenue & Volume,,
Table51 Product Launch 2018-2019AMOLED Displays Market, Revenue & Volume,,
Table52 Mergers & Acquistions 2018-2019AMOLED Displays Market, Revenue & Volume,,
List of Figures
Figure 1 Overview of AMOLED Displays Market 2021-2026
Figure 2 Market Share Analysis for AMOLED Displays Market 2018 (US$)
Figure 3 Product Comparison in AMOLED Displays Market 2018-2019 (US$)
Figure 4 End User Profile for AMOLED Displays Market 2018-2019 (US$)
Figure 5 Patent Application and Grant in AMOLED Displays Market 2013-2018* (US$)
Figure 6 Top 5 Companies Financial Analysis in AMOLED Displays Market 2018-2019 (US$)
Figure 7 Market Entry Strategy in AMOLED Displays Market 2018-2019
Figure 8 Ecosystem Analysis in AMOLED Displays Market2018
Figure 9 Average Selling Price in AMOLED Displays Market 2021-2026
Figure 10 Top Opportunites in AMOLED Displays Market 2018-2019
Figure 11 Market Life Cycle Analysis in AMOLED Displays Market
Figure 12 GlobalBy TypeAMOLED Displays Market Revenue, 2021-2026 ($)
Figure 13 GlobalBy ApplicationAMOLED Displays Market Revenue, 2021-2026 ($)
Figure 14 Global AMOLED Displays Market - By Geography
Figure 15 Global AMOLED Displays Market Value & Volume, By Geography, 2021-2026 ($)
Figure 16 Global AMOLED Displays Market CAGR, By Geography, 2021-2026 (%)
Figure 17 North America AMOLED Displays Market Value & Volume, 2021-2026 ($)
Figure 18 US AMOLED Displays Market Value & Volume, 2021-2026 ($)
Figure 19 US GDP and Population, 2018-2019 ($)
Figure 20 US GDP – Composition of 2018, By Sector of Origin
Figure 21 US Export and Import Value & Volume, 2018-2019 ($)
Figure 22 Canada AMOLED Displays Market Value & Volume, 2021-2026 ($)
Figure 23 Canada GDP and Population, 2018-2019 ($)
Figure 24 Canada GDP – Composition of 2018, By Sector of Origin
Figure 25 Canada Export and Import Value & Volume, 2018-2019 ($)
Figure 26 Mexico AMOLED Displays Market Value & Volume, 2021-2026 ($)
Figure 27 Mexico GDP and Population, 2018-2019 ($)
Figure 28 Mexico GDP – Composition of 2018, By Sector of Origin
Figure 29 Mexico Export and Import Value & Volume, 2018-2019 ($)
Figure 30 South America AMOLED Displays MarketSouth America 3D Printing Market Value & Volume, 2021-2026 ($)
Figure 31 Brazil AMOLED Displays Market Value & Volume, 2021-2026 ($)
Figure 32 Brazil GDP and Population, 2018-2019 ($)
Figure 33 Brazil GDP – Composition of 2018, By Sector of Origin
Figure 34 Brazil Export and Import Value & Volume, 2018-2019 ($)
Figure 35 Venezuela AMOLED Displays Market Value & Volume, 2021-2026 ($)
Figure 36 Venezuela GDP and Population, 2018-2019 ($)
Figure 37 Venezuela GDP – Composition of 2018, By Sector of Origin
Figure 38 Venezuela Export and Import Value & Volume, 2018-2019 ($)
Figure 39 Argentina AMOLED Displays Market Value & Volume, 2021-2026 ($)
Figure 40 Argentina GDP and Population, 2018-2019 ($)
Figure 41 Argentina GDP – Composition of 2018, By Sector of Origin
Figure 42 Argentina Export and Import Value & Volume, 2018-2019 ($)
Figure 43 Ecuador AMOLED Displays Market Value & Volume, 2021-2026 ($)
Figure 44 Ecuador GDP and Population, 2018-2019 ($)
Figure 45 Ecuador GDP – Composition of 2018, By Sector of Origin
Figure 46 Ecuador Export and Import Value & Volume, 2018-2019 ($)
Figure 47 Peru AMOLED Displays Market Value & Volume, 2021-2026 ($)
Figure 48 Peru GDP and Population, 2018-2019 ($)
Figure 49 Peru GDP – Composition of 2018, By Sector of Origin
Figure 50 Peru Export and Import Value & Volume, 2018-2019 ($)
Figure 51 Colombia AMOLED Displays Market Value & Volume, 2021-2026 ($)
Figure 52 Colombia GDP and Population, 2018-2019 ($)
Figure 53 Colombia GDP – Composition of 2018, By Sector of Origin
Figure 54 Colombia Export and Import Value & Volume, 2018-2019 ($)
Figure 55 Costa Rica AMOLED Displays MarketCosta Rica 3D Printing Market Value & Volume, 2021-2026 ($)
Figure 56 Costa Rica GDP and Population, 2018-2019 ($)
Figure 57 Costa Rica GDP – Composition of 2018, By Sector of Origin
Figure 58 Costa Rica Export and Import Value & Volume, 2018-2019 ($)
Figure 59 Europe AMOLED Displays Market Value & Volume, 2021-2026 ($)
Figure 60 U.K AMOLED Displays Market Value & Volume, 2021-2026 ($)
Figure 61 U.K GDP and Population, 2018-2019 ($)
Figure 62 U.K GDP – Composition of 2018, By Sector of Origin
Figure 63 U.K Export and Import Value & Volume, 2018-2019 ($)
Figure 64 Germany AMOLED Displays Market Value & Volume, 2021-2026 ($)
Figure 65 Germany GDP and Population, 2018-2019 ($)
Figure 66 Germany GDP – Composition of 2018, By Sector of Origin
Figure 67 Germany Export and Import Value & Volume, 2018-2019 ($)
Figure 68 Italy AMOLED Displays Market Value & Volume, 2021-2026 ($)
Figure 69 Italy GDP and Population, 2018-2019 ($)
Figure 70 Italy GDP – Composition of 2018, By Sector of Origin
Figure 71 Italy Export and Import Value & Volume, 2018-2019 ($)
Figure 72 France AMOLED Displays Market Value & Volume, 2021-2026 ($)
Figure 73 France GDP and Population, 2018-2019 ($)
Figure 74 France GDP – Composition of 2018, By Sector of Origin
Figure 75 France Export and Import Value & Volume, 2018-2019 ($)
Figure 76 Netherlands AMOLED Displays Market Value & Volume, 2021-2026 ($)
Figure 77 Netherlands GDP and Population, 2018-2019 ($)
Figure 78 Netherlands GDP – Composition of 2018, By Sector of Origin
Figure 79 Netherlands Export and Import Value & Volume, 2018-2019 ($)
Figure 80 Belgium AMOLED Displays Market Value & Volume, 2021-2026 ($)
Figure 81 Belgium GDP and Population, 2018-2019 ($)
Figure 82 Belgium GDP – Composition of 2018, By Sector of Origin
Figure 83 Belgium Export and Import Value & Volume, 2018-2019 ($)
Figure 84 Spain AMOLED Displays Market Value & Volume, 2021-2026 ($)
Figure 85 Spain GDP and Population, 2018-2019 ($)
Figure 86 Spain GDP – Composition of 2018, By Sector of Origin
Figure 87 Spain Export and Import Value & Volume, 2018-2019 ($)
Figure 88 Denmark AMOLED Displays Market Value & Volume, 2021-2026 ($)
Figure 89 Denmark GDP and Population, 2018-2019 ($)
Figure 90 Denmark GDP – Composition of 2018, By Sector of Origin
Figure 91 Denmark Export and Import Value & Volume, 2018-2019 ($)
Figure 92 APAC AMOLED Displays Market Value & Volume, 2021-2026 ($)
Figure 93 China AMOLED Displays MarketValue & Volume, 2021-2026
Figure 94 China GDP and Population, 2018-2019 ($)
Figure 95 China GDP – Composition of 2018, By Sector of Origin
Figure 96 China Export and Import Value & Volume, 2018-2019 ($)AMOLED Displays MarketChina Export and Import Value & Volume, 2018-2019 ($)
Figure 97 Australia AMOLED Displays Market Value & Volume, 2021-2026 ($)
Figure 98 Australia GDP and Population, 2018-2019 ($)
Figure 99 Australia GDP – Composition of 2018, By Sector of Origin
Figure 100 Australia Export and Import Value & Volume, 2018-2019 ($)
Figure 101 South Korea AMOLED Displays Market Value & Volume, 2021-2026 ($)
Figure 102 South Korea GDP and Population, 2018-2019 ($)
Figure 103 South Korea GDP – Composition of 2018, By Sector of Origin
Figure 104 South Korea Export and Import Value & Volume, 2018-2019 ($)
Figure 105 India AMOLED Displays Market Value & Volume, 2021-2026 ($)
Figure 106 India GDP and Population, 2018-2019 ($)
Figure 107 India GDP – Composition of 2018, By Sector of Origin
Figure 108 India Export and Import Value & Volume, 2018-2019 ($)
Figure 109 Taiwan AMOLED Displays MarketTaiwan 3D Printing Market Value & Volume, 2021-2026 ($)
Figure 110 Taiwan GDP and Population, 2018-2019 ($)
Figure 111 Taiwan GDP – Composition of 2018, By Sector of Origin
Figure 112 Taiwan Export and Import Value & Volume, 2018-2019 ($)
Figure 113 Malaysia AMOLED Displays MarketMalaysia 3D Printing Market Value & Volume, 2021-2026 ($)
Figure 114 Malaysia GDP and Population, 2018-2019 ($)
Figure 115 Malaysia GDP – Composition of 2018, By Sector of Origin
Figure 116 Malaysia Export and Import Value & Volume, 2018-2019 ($)
Figure 117 Hong Kong AMOLED Displays MarketHong Kong 3D Printing Market Value & Volume, 2021-2026 ($)
Figure 118 Hong Kong GDP and Population, 2018-2019 ($)
Figure 119 Hong Kong GDP – Composition of 2018, By Sector of Origin
Figure 120 Hong Kong Export and Import Value & Volume, 2018-2019 ($)
Figure 121 Middle East & Africa AMOLED Displays MarketMiddle East & Africa 3D Printing Market Value & Volume, 2021-2026 ($)
Figure 122 Russia AMOLED Displays MarketRussia 3D Printing Market Value & Volume, 2021-2026 ($)
Figure 123 Russia GDP and Population, 2018-2019 ($)
Figure 124 Russia GDP – Composition of 2018, By Sector of Origin
Figure 125 Russia Export and Import Value & Volume, 2018-2019 ($)
Figure 126 Israel AMOLED Displays Market Value & Volume, 2021-2026 ($)
Figure 127 Israel GDP and Population, 2018-2019 ($)
Figure 128 Israel GDP – Composition of 2018, By Sector of Origin
Figure 129 Israel Export and Import Value & Volume, 2018-2019 ($)
Figure 130 Entropy Share, By Strategies, 2018-2019* (%)AMOLED Displays Market
Figure 131 Developments, 2018-2019*AMOLED Displays Market
Figure 132 Company 1 AMOLED Displays Market Net Revenue, By Years, 2018-2019* ($)
Figure 133 Company 1 AMOLED Displays Market Net Revenue Share, By Business segments, 2018 (%)
Figure 134 Company 1 AMOLED Displays Market Net Sales Share, By Geography, 2018 (%)
Figure 135 Company 2 AMOLED Displays Market Net Revenue, By Years, 2018-2019* ($)
Figure 136 Company 2 AMOLED Displays Market Net Revenue Share, By Business segments, 2018 (%)
Figure 137 Company 2 AMOLED Displays Market Net Sales Share, By Geography, 2018 (%)
Figure 138 Company 3AMOLED Displays Market Net Revenue, By Years, 2018-2019* ($)
Figure 139 Company 3AMOLED Displays Market Net Revenue Share, By Business segments, 2018 (%)
Figure 140 Company 3AMOLED Displays Market Net Sales Share, By Geography, 2018 (%)
Figure 141 Company 4 AMOLED Displays Market Net Revenue, By Years, 2018-2019* ($)
Figure 142 Company 4 AMOLED Displays Market Net Revenue Share, By Business segments, 2018 (%)
Figure 143 Company 4 AMOLED Displays Market Net Sales Share, By Geography, 2018 (%)
Figure 144 Company 5 AMOLED Displays Market Net Revenue, By Years, 2018-2019* ($)
Figure 145 Company 5 AMOLED Displays Market Net Revenue Share, By Business segments, 2018 (%)
Figure 146 Company 5 AMOLED Displays Market Net Sales Share, By Geography, 2018 (%)
Figure 147 Company 6 AMOLED Displays Market Net Revenue, By Years, 2018-2019* ($)
Figure 148 Company 6 AMOLED Displays Market Net Revenue Share, By Business segments, 2018 (%)
Figure 149 Company 6 AMOLED Displays Market Net Sales Share, By Geography, 2018 (%)
Figure 150 Company 7 AMOLED Displays Market Net Revenue, By Years, 2018-2019* ($)
Figure 151 Company 7 AMOLED Displays Market Net Revenue Share, By Business segments, 2018 (%)
Figure 152 Company 7 AMOLED Displays Market Net Sales Share, By Geography, 2018 (%)
Figure 153 Company 8 AMOLED Displays Market Net Revenue, By Years, 2018-2019* ($)
Figure 154 Company 8 AMOLED Displays Market Net Revenue Share, By Business segments, 2018 (%)
Figure 155 Company 8 AMOLED Displays Market Net Sales Share, By Geography, 2018 (%)
Figure 156 Company 9 AMOLED Displays Market Net Revenue, By Years, 2018-2019* ($)
Figure 157 Company 9 AMOLED Displays Market Net Revenue Share, By Business segments, 2018 (%)
Figure 158 Company 9 AMOLED Displays Market Net Sales Share, By Geography, 2018 (%)
Figure 159 Company 10 AMOLED Displays Market Net Revenue, By Years, 2018-2019* ($)
Figure 160 Company 10 AMOLED Displays Market Net Revenue Share, By Business segments, 2018 (%)
Figure 161 Company 10 AMOLED Displays Market Net Sales Share, By Geography, 2018 (%)
Figure 162 Company 11 AMOLED Displays Market Net Revenue, By Years, 2018-2019* ($)
Figure 163 Company 11 AMOLED Displays Market Net Revenue Share, By Business segments, 2018 (%)
Figure 164 Company 11 AMOLED Displays Market Net Sales Share, By Geography, 2018 (%)
Figure 165 Company 12 AMOLED Displays Market Net Revenue, By Years, 2018-2019* ($)
Figure 166 Company 12 AMOLED Displays Market Net Revenue Share, By Business segments, 2018 (%)
Figure 167 Company 12 AMOLED Displays Market Net Sales Share, By Geography, 2018 (%)
Figure 168 Company 13AMOLED Displays Market Net Revenue, By Years, 2018-2019* ($)
Figure 169 Company 13AMOLED Displays Market Net Revenue Share, By Business segments, 2018 (%)
Figure 170 Company 13AMOLED Displays Market Net Sales Share, By Geography, 2018 (%)
Figure 171 Company 14 AMOLED Displays Market Net Revenue, By Years, 2018-2019* ($)
Figure 172 Company 14 AMOLED Displays Market Net Revenue Share, By Business segments, 2018 (%)
Figure 173 Company 14 AMOLED Displays Market Net Sales Share, By Geography, 2018 (%)
Figure 174 Company 15 AMOLED Displays Market Net Revenue, By Years, 2018-2019* ($)
Figure 175 Company 15 AMOLED Displays Market Net Revenue Share, By Business segments, 2018 (%)
Figure 176 Company 15 AMOLED Displays Market Net Sales Share, By Geography, 2018 (%)