 Email
Email Print
Print


Hall Effect Sensor Market Overview
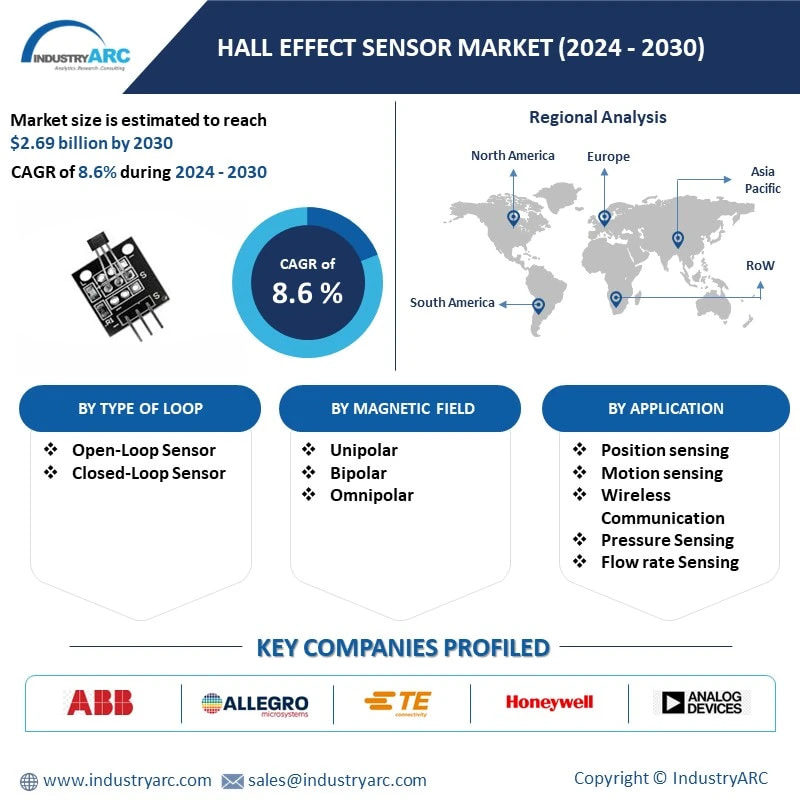
The Hall Effect Sensor Market size is forecast to reach US$2.69 billion by 2030, growing at a CAGR of 8.6% from 2024 to 2030. Hall effect sensors use the ‘Hall Effect’ principle to convert magnetically encoded information into electrical signals. The principle of Hall effect sensors depends on electron mobility. These devices have a range of applications, with Hall effect sensors often used in automotive systems to sense position, distance and speed. They are commonly used in automotive control systems like proximity sensing, speed detection, anti-lock braking systems, and others, electronics, and measurement devices. The factors such as the rise in industrial automation, the growing application of hall effect sensors in robotics, the increasing use of programmable and fully integrated current sensors and transducers and wide temperature stability in extreme environments in a wide range of industry verticals are helping in the growth of this market. Hall Effect sensors, which detect the presence of magnetic fields, are increasingly utilized for position sensing, speed detection, and current measurement due to their accuracy and reliability. One of the key trends is shaping the market is the demand for miniaturization and integration of sensors into compact electronic devices, enabling improved performance and efficiency. Additionally, advancements in Hall Effect sensor technology, such as the development of high-temperature-resistant and low-power-consumption variants, are further fueling market growth. Moreover, the emergence of IoT and automation is amplifying the adoption of Hall Effect sensors in smart devices and industrial machinery for precise control and monitoring. With continuous innovation and expanding applications, the Hall Effect Sensor market is poised for sustained expansion in the foreseeable future. However, the factors such as high cost of raw materials for hall effect sensors and technical issues like inconsistent.
Market Snapshot:
Hall Effect Sensor Market Report Coverage
The report: “Hall Effect Sensor Industry Outlook – Forecast (2024-2030)”, by IndustryARC covers an in-depth analysis of the following segments of the Hall Effect Sensor industry.
By Type of Loop: Open-Loop Sensor, Closed-Loop Sensor
By Rotor: Magnetic rotor, Ferrous vane rotor
By Magnetic field: Unipolar, Bipolar, Omnipolar
By Technology: BiCMOS, CMOS
By Material: Gallium Arsenide (GaAs), Indium Arsenide (InAs), Indium Phosphide (InP), Indium Antimonide (InSb), Graphene
By Output: Analog (Linear), Digital (Switching)
By Application: Position sensing, Motion sensing, Wireless Communication, Pressure Sensing, Flow rate Sensing, Vibration sensing, Others
By End-user: Industrial Equipments, Power & Energy, Oil, gas and petrochemical, Automotive, Consumer Electronics, Telecommunication, Healthcare, Aerospace & Defense, Manufacturing, Robotics, Others
By Geography: North America (U.S, Canada, Mexico), Europe (U.K, Germany, France, Italy, Spain, Rest of Europe), APAC (China, Japan, South Korea, India, Australia, New Zealand, Rest of APAC), South America (Brazil, Argentina, Rest of South America), RoW (Middle East, Africa)
Key Takeaways
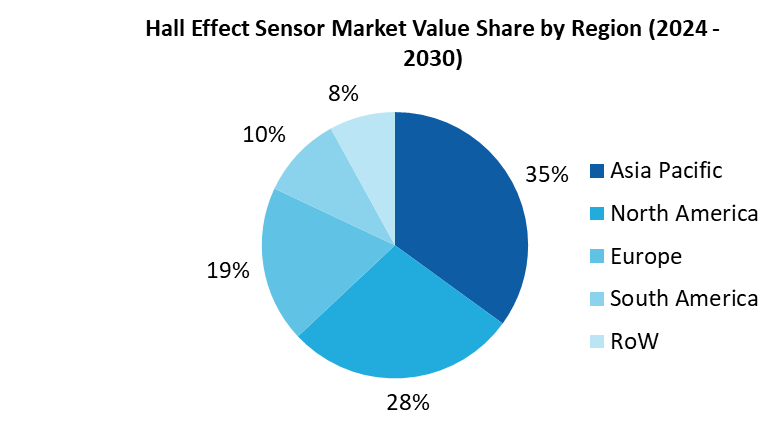
• Asia-Pacific (APAC) market held the largest market share of 35%, in 2023. This is due to growing research in Hall Effect sensor technologies, the rise in industrial automation and robotics, and government policies to boost the semiconductor sensor industry
• The open-loop sensor segment is predicted to grow at a faster rate than closed-loop sensor over the forecast period of 2024-2030, in the Hall Effect Sensor Market segmented by type of loop. This is owing to more precise results with simple design, cost-effective circuit, and easy to maintain and tune.
• The industrial segment held the largest share in Hall Effect Sensor Market by application, in 2023. This is attributed to advent of industrial automation and the need for accurate production lines for safety and efficiency.
• The increasing number of smart grids and robotics in industries, growing use of electric vehicles and smart automotive systems, and growing research in Hall Effect sensors for improved performance are the contributing factors in the growth of the Hall Effect Sensor Market.
Hall Effect Sensor Market Segment Analysis - By Type of Loop
The Hall Effect Sensor Market by type of loop has been segmented into open loop sensor and closed loop sensor. The open loop segment is predicted to grow at a faster rate with a CAGR of 9.8%, over the forecast period 2024-2030. This is owing to the growing application of open loop hall effect sensors in industrial equipments, ease of implementation of the mechanism, and galvanic isolation effect. Open loop current sensors consist of a Hall sensor mounted in the air gap of a magnetic core. An open-loop Hall-effect sensor uses the Hall voltage directly to produce its output signal making it simpler to implement and exhibits a faster response time. These sensors help improve the overall efficiency and productivity of an automation process due to the galvanic isolation effect. It is a major factor in the selection of an open-loop hall effect sensor mainly for current measurement applications. Thus, open loop hall sensors have several benefits in industrial applications which are mainly promoting the growth of this open loop hall sensor segment. For instance, in February 2023, LEM introduced a pioneering Open Loop Hall Current Sensor for Automotive EV Traction Inverters. Compact at 29mm x 21mm x 12mm and lightweight at 27g, this HSTDR sensor sets a new standard for precision and efficiency in measuring electrical parameters, reinforcing LEM's commitment to innovation and quality solutions. Thus, the growing use of open-loop Hall Effect sensors with integrated systems and customized structures as per requirement is fuelling the growth of this market
Hall Effect Sensor Market Segment Analysis - By End User
The Hall Effect Sensor Market by end-user has been segmented into industrial equipments, automotive, consumer electronics, telecommunication, healthcare, aerospace & defense, manufacturing, and others. The industrial equipment segment held the largest share of 32%, in 2023. This is owing to the increasing need of precision production line processes and wide working temperature range in extreme industrial environments. Current sensors, pressure sensors, and rate of flow sensors are some of the extensively used applications of Hall Effect sensors in industrial and manufacturing. In Industrial equipments, Hall Effect sensors are used in security systems, alignment controls, micrometers, machine tools, key switches, linear potentiometers, rotary encoders, and brushless DC motor commutators. Thus, a large scale of equipment and process line requirement of Hall Effect sensor in industrial applications is assisting the industrial equipments segment growth. In October 2023, TDK Corporation introduced HAL® 3927, expanding its Micronas direct-angle Hall-effect sensor line for automotive and industrial use. Boasting a linear analog output, integrated wire-break detection, and SAE J2716 compliant SENT interface, samples are accessible now, with production slated for Q1 2024. The sensor is promoted as providing integrated functions and diagnostics to maximize design flexibility and system safety while saving energy. Such growing advancements in hall effect sensor technologies for industrial requirements and other applications is driving the growth of this market
Hall Effect Sensor Market Segment Analysis - By Geography
The Hall Effect Sensor Market by geography is segmented into North America, Europe, Asia-Pacific (APAC), South America, and the rest of the world (RoW). Asia Pacific (APAC) held the largest Hall Effect Sensor Market share with 35% of the total market size. This is due to increasing government policies supporting industrial automation and growing research in new technological integration in Hall effect sensors such as 3D sensing or bipolar complementary metal-oxide-semiconductor (BiCMOS) technology in countries such as China, India, South Korea, and Japan. The recent developments of graphene-based Hall Effect sensors, and programmable hall effect sensors are also boosting the growth in Asian countries.
Hall Effect Sensor Market Drivers
The rising industrial automation and increasing use of smart grids in production line boosts the growth of Hall Effect Sensor market
The Hall Effect Sensor Market is growing due to the rise in demand for sensors with higher accuracy levels, wide working temperature ranges and accurate results. The increasing use of smart grids and rising safety concerns within industrial applications drive the demand of hall effect sensors. The rise in implementation of industry 4.0 technologies such as industrial internet of things (IIoT) and cloud-computing has created high demand for variety of sensors. Another essential part, DC motors, and switches, controls also use Hall Effect sensors for automation which are increasingly used by various industries. Hall effect sensors are also an effective, contactless way to measure DC magnetic flux in current transformers. These sensors dedicated to different kinds of industrial applications are available for example, sealed Hall Effect devices are water-proof and are made in such a way to resist any vibration. Thus, the customization of these sensors is assisting in the growth of this market. In January 2022, Allegro MicroSystems, Inc., a global leader in sensing and power solutions for motion control and energy-efficient systems, announced its new A33230 3D sine/cosine Hall-effect position sensor IC. The A33230 is the smallest 3D sine/cosine sensor currently available in the market and offers system designers a cost-effective solution for automotive and industrial applications with a quick time to market. Thus, growing industrial applications is driving the Hall Effect Sensor Market growth.
The increasing research in bipolar complementary metal-oxide-semiconductor (BiCMOS) technology, intelligent hall effect sensors, and three-dimensional sensors is boosting the hall effect sensors market growth.
There are growing advancements in the Hall Effect sensor technologies such as BiCMOS, three-dimensional, and many others. BiCMOS offers a high current drive per unit, low input density, high power dissipation, and low noise compared to conventional or CMOS technology. A BiCMOS chopper stabilization circuit is utilized to reduce signal offset and to stabilize the output of the IC over its operating temperature range. with BiCMOS technology, features fast power-on time and low-noise operation. A family of Hall-effect sensors optimized for automotive and mechatronic applications that demand accuracy and flexibility combined with low cost. It includes a microcontroller, a temperature sensor, advanced on-chip compensation, and a digital interface. The latest automotive designs require smart sensors to deliver the high level of precision and robustness linked with the capability of local pre-processing of the measured data. In May 2022, Synaptics Inc. launched the FlexSense family of sensor processors that captures and intelligently handles input from up to four sensors in a tiny, ultra-low-power form factor that is up to 80% smaller than existing solutions. Integrating a mix of capacitive, inductive, Hall effect, and ambient sensing into a single processor with proprietary algorithms, the FlexSense family brings reliable, low-latency, and context-aware force, proximity, and touch sensing to Internet of Things (IoT) devices. Such innovations in the integration of hall effect sensors with intelligent technologies is driving the growth of this market.
Hall Effect Sensor Market Challenges
The issue of uneven strength of magnetic fields in Hall Effect sensors is restricting the growth of this market
Hall effect sensors produce an output voltage directly proportional to the strength of the magnetic field generated by the current supplied. It is connected to an analog to digital (A/D) converter, microprocessor, or microcontroller to maintain the voltage. Hall-Effect sensors work on the concept of magnetic field, which makes them more vulnerable to external magnetic fields, leading to inconsistent measurement of the current flow. These sensors are not suitable for measuring the flow of current if the distance between the generated magnetic field and the current-carrying conductor is beyond certain limits which is expected to hinder the market growth. In May 2022, Titan Enterprises Ltd, explains some of the reasons for sensor failures. High quality Hall effect sensors are typically used within Titan’s pulse precision flow measurement devices. The sensors operate between 4.0Vdc and 30Vdc, however, exceeding the maximum 30Vdc to the Hall Effect sensor will damage the unit. A good quality regulated DC power supply is recommended for powering a pulse flow meter. Thus, due to the technical limitations and the need to maintain a certain distance and current flow restrict the growth of this market.
Hall Effect Sensor Market Landscape
Product launches, acquisitions, and R&D activities are key strategies adopted by players in the Hall Effect Sensor industry. The Hall Effect Sensor top 10 companies include ABB Ltd, Allegro MicroSystems LLC, TE Connectivity Ltd, Honeywell International Inc., Analog Devices, Inc., Robert Bosch GmbH, NXP Semiconductors N.V., TDK Corporation, Infineon Technologies AG, and among the Others.
Melexis
Recent Developments:
In September 2023, Melexis unveiled the groundbreaking MLX91230 DC Hall-effect current sensor, boasting unparalleled accuracy in open-loop technology. It sets a new standard as the most precise sensor of its kind, revolutionizing DC measurement.
October 2023, TDK introduced HAL 3927, a cutting-edge Hall-effect sensor featuring ratiometric analog output and digital SENT protocol as per SAE J2716 rev. 4. Boasting superior angular measurement and ISO 26262 compliant development, it caters to safety-critical automotive and industrial needs, housed in a compact SOIC8 SMD package.
In June 2022, Allegro MicroSystems introduced revolutionary position sensors for Advanced Driver Assistance Systems (ADAS). Utilizing TMR and vertical Hall elements, this innovation offers unparalleled precision and built-in redundancy, ensuring utmost reliability for safety-critical applications. It marks a significant advancement in automotive sensor technology.
1.Hall Effect Sensor Market - Overview
1.1 Definitions and Scope
2.Hall Effect Sensor Market - Executive Summary
2.1 Key Trends by Magnetic field
2.2 Key Trends by Rotor
2.3 Key Trends by Type of Loop
2.4 Key Trends by Technology
2.5 Key Trends by Material
2.6 Key Trends by Output
2.7 Key Trends by Application
2.8 Key Trends by End-User
2.9 Key Trends by Geography
3.Hall Effect Sensor Market - Comparative Analysis
3.1 Company Benchmarking
3.2 Global Financial Analysis
3.3 Market Share Analysis
3.4 Patent Analysis
3.5 Pricing Analysis
4.Hall Effect Sensor Market - Start-up Companies Scenario
4.1 Key Start-up Company Analysis by
4.1.1 Investment
4.1.2 Revenue
4.1.3 Venture Capital and Funding Scenario
5.Hall Effect Sensor Market – Market Entry Scenario Premium
5.1 Regulatory Framework Overview
5.2 New Business and Ease of Doing Business Index
5.3 Case Studies of Successful Ventures
6.Hall Effect Sensor Market - Forces
6.1 Market Drivers
6.2 Market Constraints/Challenges
6.3 Porter’s Five Force Model
6.3.1 Bargaining power of suppliers
6.3.2 Bargaining powers of customers
6.3.3 Threat of new entrants
6.3.4 Rivalry among existing players
6.3.5 Threat of substitutes
7.Hall Effect Sensor Market – Strategic Analysis
7.1 Value Chain Analysis
7.2 Opportunities Analysis
7.3 Market Life Cycle
8.Hall Effect Sensor Market– By Type of Loop (Market Size -$Million/Billion)
8.1 Open-Loop Sensor
8.2 Closed-Loop Sensor
9.Hall Effect Sensor Market– By Rotor (Market Size -$Million/Billion)
9.1 Magnetic rotor
9.2 Ferrous vane rotor
10.Hall Effect Sensor Market – By Magnetic field (Market Size -$Million/Billion)
10.1 Unipolar
10.2 Bipolar
10.3 Omnipolar
11.Hall Effect Sensor Market – By Technology (Market Size - $Million/$Billion)
11.1 BiCMOS
11.2 CMOS
12.Hall Effect Sensor Market – By Material (Market Size - $Million/$Billion)
12.1 Gallium Arsenide (GaAs),
12.2 Indium Arsenide (InAs),
12.3 Indium Phosphide (InP),
12.4 Indium Antimonide (InSb),
12.5 Graphene
13.Hall Effect Sensor Market – By Output (Market Size - $Million/$Billion)
13.1 Analog (Linear)
13.2 Digital (Switching)
14.Hall Effect Sensor Market – By Application (Market Size - $Million/$Billion)
14.1 Position sensing
14.2 Motion sensing
14.3 Wireless Communication
14.4 Pressure Sensing
14.5 Flow rate Sensing
14.6 Vibration sensing
14.7 Others
15.Hall Effect Sensor Market – By End user (Market Size - $Million/$Billion)
15.1 Industrial Equipment
15.2 Power & Energy
15.3 Oil, gas & petrochemical
15.4 Automotive
15.5 Consumer Electronics
15.6 Telecommunication
15.7 Healthcare
15.8 Aerospace & Defense
15.9 Manufacturing
15.10 Robotics
15.11 Others
16.Hall Effect Sensor Market – by Geography (Market Size - $Million/$Billion)
16.1 North America
16.1.1 U.S.
16.1.2 Canada
16.1.3Mexico
16.2 Europe
16.2.1 U.K.
16.2.2 Germany
16.2.3 France
16.2.4 Italy
16.2.5 Spain
16.2.6 Rest of Europe
16.3 Asia-Pacific
16.3.1 China
16.3.2 Japan
16.3.3 India
16.3.4 South Korea
16.3.5 Australia & New Zealand
16.3.6 Rest of Asia-Pacific
16.4 South America
16.4.1 Brazil
16.4.2 Argentina
16.4.3 Rest of South America
16.5 Rest of The World
16.5.1 Middle East
16.5.2 Africa
17.Hall Effect Sensor Market - Entropy
18.Hall Effect Sensor Market – Industry/Segment Competition Landscape
18.1 Market Share Analysis
18.1.1 Global Market Share – Key Companies
18.1.2 Market Share by Region – Key Companies
18.1.3 Market Share by Countries – Key Companies
18.2 Competition Matrix
18.3 Best Practices for Companies
19.Hall Effect Sensor Market – Key Company List by Country Premium
20.Hall Effect Sensor Market- Company Analysis
20.1 ABB Ltd
20.2 Allegro MicroSystems LLC
20.3 TE Connectivity Ltd
20.4 Honeywell International Inc.
20.5 Analog Devices, Inc.
20.6 Robert Bosch GmbH
20.7 NXP Semiconductors N.V.
20.8 TDK Corporation
20.9 Infineon Technologies AG
20.10 Melexis
* "Financials would be provided to private companies on best-efforts basis."
List of Tables
Table 1: Hall Effect Sensor Market Overview 2021-2026
Table 2: Hall Effect Sensor Market Leader Analysis 2018-2019 (US$)
Table 3: Hall Effect Sensor Market Product Analysis 2018-2019 (US$)
Table 4: Hall Effect Sensor Market End User Analysis 2018-2019 (US$)
Table 5: Hall Effect Sensor Market Patent Analysis 2013-2018* (US$)
Table 6: Hall Effect Sensor Market Financial Analysis 2018-2019 (US$)
Table 7: Hall Effect Sensor Market Driver Analysis 2018-2019 (US$)
Table 8: Hall Effect Sensor Market Challenges Analysis 2018-2019 (US$)
Table 9: Hall Effect Sensor Market Constraint Analysis 2018-2019 (US$)
Table 10: Hall Effect Sensor Market Supplier Bargaining Power Analysis 2018-2019 (US$)
Table 11: Hall Effect Sensor Market Buyer Bargaining Power Analysis 2018-2019 (US$)
Table 12: Hall Effect Sensor Market Threat of Substitutes Analysis 2018-2019 (US$)
Table 13: Hall Effect Sensor Market Threat of New Entrants Analysis 2018-2019 (US$)
Table 14: Hall Effect Sensor Market Degree of Competition Analysis 2018-2019 (US$)
Table 15: Hall Effect Sensor Market Value Chain Analysis 2018-2019 (US$)
Table 16: Hall Effect Sensor Market Pricing Analysis 2021-2026 (US$)
Table 17: Hall Effect Sensor Market Opportunities Analysis 2021-2026 (US$)
Table 18: Hall Effect Sensor Market Product Life Cycle Analysis 2021-2026 (US$)
Table 19: Hall Effect Sensor Market Supplier Analysis 2018-2019 (US$)
Table 20: Hall Effect Sensor Market Distributor Analysis 2018-2019 (US$)
Table 21: Hall Effect Sensor Market Trend Analysis 2018-2019 (US$)
Table 22: Hall Effect Sensor Market Size 2018 (US$)
Table 23: Hall Effect Sensor Market Forecast Analysis 2021-2026 (US$)
Table 24: Hall Effect Sensor Market Sales Forecast Analysis 2021-2026 (Units)
Table 25: Hall Effect Sensor Market, Revenue & Volume, By Technology, 2021-2026 ($)
Table 26: Hall Effect Sensor Market By Technology, Revenue & Volume, By BICMOS, 2021-2026 ($)
Table 27: Hall Effect Sensor Market By Technology, Revenue & Volume, By CMOS, 2021-2026 ($)
Table 28: Hall Effect Sensor Market, Revenue & Volume, By Application, 2021-2026 ($)
Table 29: Hall Effect Sensor Market By Application, Revenue & Volume, By Automotive, 2021-2026 ($)
Table 30: Hall Effect Sensor Market By Application, Revenue & Volume, By Consumer Electronics, 2021-2026 ($)
Table 31: Hall Effect Sensor Market By Application, Revenue & Volume, By Industrial Automation, 2021-2026 ($)
Table 32: Hall Effect Sensor Market By Application, Revenue & Volume, By Telecommunication, 2021-2026 ($)
Table 33: Hall Effect Sensor Market By Application, Revenue & Volume, By Building Automation, 2021-2026 ($)
Table 34: North America Hall Effect Sensor Market, Revenue & Volume, By Technology, 2021-2026 ($)
Table 35: North America Hall Effect Sensor Market, Revenue & Volume, By Application, 2021-2026 ($)
Table 36: South america Hall Effect Sensor Market, Revenue & Volume, By Technology, 2021-2026 ($)
Table 37: South america Hall Effect Sensor Market, Revenue & Volume, By Application, 2021-2026 ($)
Table 38: Europe Hall Effect Sensor Market, Revenue & Volume, By Technology, 2021-2026 ($)
Table 39: Europe Hall Effect Sensor Market, Revenue & Volume, By Application, 2021-2026 ($)
Table 40: APAC Hall Effect Sensor Market, Revenue & Volume, By Technology, 2021-2026 ($)
Table 41: APAC Hall Effect Sensor Market, Revenue & Volume, By Application, 2021-2026 ($)
Table 42: Middle East & Africa Hall Effect Sensor Market, Revenue & Volume, By Technology, 2021-2026 ($)
Table 43: Middle East & Africa Hall Effect Sensor Market, Revenue & Volume, By Application, 2021-2026 ($)
Table 44: Russia Hall Effect Sensor Market, Revenue & Volume, By Technology, 2021-2026 ($)
Table 45: Russia Hall Effect Sensor Market, Revenue & Volume, By Application, 2021-2026 ($)
Table 46: Israel Hall Effect Sensor Market, Revenue & Volume, By Technology, 2021-2026 ($)
Table 47: Israel Hall Effect Sensor Market, Revenue & Volume, By Application, 2021-2026 ($)
Table 48: Top Companies 2018 (US$)Hall Effect Sensor Market, Revenue & Volume
Table 49: Product Launch 2018-2019Hall Effect Sensor Market, Revenue & Volume
Table 50: Mergers & Acquistions 2018-2019Hall Effect Sensor Market, Revenue & Volume
List of Figures
Figure 1: Overview of Hall Effect Sensor Market 2021-2026
Figure 2: Market Share Analysis for Hall Effect Sensor Market 2018 (US$)
Figure 3: Product Comparison in Hall Effect Sensor Market 2018-2019 (US$)
Figure 4: End User Profile for Hall Effect Sensor Market 2018-2019 (US$)
Figure 5: Patent Application and Grant in Hall Effect Sensor Market 2013-2018* (US$)
Figure 6: Top 5 Companies Financial Analysis in Hall Effect Sensor Market 2018-2019 (US$)
Figure 7: Market Entry Strategy in Hall Effect Sensor Market 2018-2019
Figure 8: Ecosystem Analysis in Hall Effect Sensor Market 2018
Figure 9: Average Selling Price in Hall Effect Sensor Market 2021-2026
Figure 10: Top Opportunites in Hall Effect Sensor Market 2018-2019
Figure 11: Market Life Cycle Analysis in Hall Effect Sensor Market
Figure 12: GlobalBy TechnologyHall Effect Sensor Market Revenue, 2021-2026 ($)
Figure 13: GlobalBy ApplicationHall Effect Sensor Market Revenue, 2021-2026 ($)
Figure 14: Global Hall Effect Sensor Market - By Geography
Figure 15: Global Hall Effect Sensor Market Value & Volume, By Geography, 2021-2026 ($)
Figure 16: Global Hall Effect Sensor Market CAGR, By Geography, 2021-2026 (%)
Figure 17: North America Hall Effect Sensor Market Value & Volume, 2021-2026 ($)
Figure 18: US Hall Effect Sensor Market Value & Volume, 2021-2026 ($)
Figure 19: US GDP and Population, 2018-2019 ($)
Figure 20: US GDP – Composition of 2018, By Sector of Origin
Figure 21: US Export and Import Value & Volume, 2018-2019 ($)
Figure 22: Canada Hall Effect Sensor Market Value & Volume, 2021-2026 ($)
Figure 23: Canada GDP and Population, 2018-2019 ($)
Figure 24: Canada GDP – Composition of 2018, By Sector of Origin
Figure 25: Canada Export and Import Value & Volume, 2018-2019 ($)
Figure 26: Mexico Hall Effect Sensor Market Value & Volume, 2021-2026 ($)
Figure 27: Mexico GDP and Population, 2018-2019 ($)
Figure 28: Mexico GDP – Composition of 2018, By Sector of Origin
Figure 29: Mexico Export and Import Value & Volume, 2018-2019 ($)
Figure 30: South America Hall Effect Sensor Market Value & Volume, 2021-2026 ($)
Figure 31: Brazil Hall Effect Sensor Market Value & Volume, 2021-2026 ($)
Figure 32: Brazil GDP and Population, 2018-2019 ($)
Figure 33: Brazil GDP – Composition of 2018, By Sector of Origin
Figure 34: Brazil Export and Import Value & Volume, 2018-2019 ($)
Figure 35: Venezuela Hall Effect Sensor Market Value & Volume, 2021-2026 ($)
Figure 36: Venezuela GDP and Population, 2018-2019 ($)
Figure 37: Venezuela GDP – Composition of 2018, By Sector of Origin
Figure 38: Venezuela Export and Import Value & Volume, 2018-2019 ($)
Figure 39: Argentina Hall Effect Sensor Market Value & Volume, 2021-2026 ($)
Figure 40: Argentina GDP and Population, 2018-2019 ($)
Figure 41: Argentina GDP – Composition of 2018, By Sector of Origin
Figure 42: Argentina Export and Import Value & Volume, 2018-2019 ($)
Figure 43: Ecuador Hall Effect Sensor Market Value & Volume, 2021-2026 ($)
Figure 44: Ecuador GDP and Population, 2018-2019 ($)
Figure 45: Ecuador GDP – Composition of 2018, By Sector of Origin
Figure 46: Ecuador Export and Import Value & Volume, 2018-2019 ($)
Figure 47: Peru Hall Effect Sensor Market Value & Volume, 2021-2026 ($)
Figure 48: Peru GDP and Population, 2018-2019 ($)
Figure 49: Peru GDP – Composition of 2018, By Sector of Origin
Figure 50: Peru Export and Import Value & Volume, 2018-2019 ($)
Figure 51: Colombia Hall Effect Sensor Market Value & Volume, 2021-2026 ($)
Figure 52: Colombia GDP and Population, 2018-2019 ($)
Figure 53: Colombia GDP – Composition of 2018, By Sector of Origin
Figure 54: Colombia Export and Import Value & Volume, 2018-2019 ($)
Figure 55: Costa Rica Hall Effect Sensor Market Value & Volume, 2021-2026 ($)
Figure 56: Costa Rica GDP and Population, 2018-2019 ($)
Figure 57: Costa Rica GDP – Composition of 2018, By Sector of Origin
Figure 58: Costa Rica Export and Import Value & Volume, 2018-2019 ($)
Figure 59: Europe Hall Effect Sensor Market Value & Volume, 2021-2026 ($)
Figure 60: U.K Hall Effect Sensor Market Value & Volume, 2021-2026 ($)
Figure 61: U.K GDP and Population, 2018-2019 ($)
Figure 62: U.K GDP – Composition of 2018, By Sector of Origin
Figure 63: U.K Export and Import Value & Volume, 2018-2019 ($)
Figure 64: Germany Hall Effect Sensor Market Value & Volume, 2021-2026 ($)
Figure 65: Germany GDP and Population, 2018-2019 ($)
Figure 66: Germany GDP – Composition of 2018, By Sector of Origin
Figure 67: Germany Export and Import Value & Volume, 2018-2019 ($)
Figure 68: Italy Hall Effect Sensor Market Value & Volume, 2021-2026 ($)
Figure 69: Italy GDP and Population, 2018-2019 ($)
Figure 70: Italy GDP – Composition of 2018, By Sector of Origin
Figure 71: Italy Export and Import Value & Volume, 2018-2019 ($)
Figure 72: France Hall Effect Sensor Market Value & Volume, 2021-2026 ($)
Figure 73: France GDP and Population, 2018-2019 ($)
Figure 74: France GDP – Composition of 2018, By Sector of Origin
Figure 75: France Export and Import Value & Volume, 2018-2019 ($)
Figure 76: Netherlands Hall Effect Sensor Market Value & Volume, 2021-2026 ($)
Figure 77: Netherlands GDP and Population, 2018-2019 ($)
Figure 78: Netherlands GDP – Composition of 2018, By Sector of Origin
Figure 79: Netherlands Export and Import Value & Volume, 2018-2019 ($)
Figure 80: Belgium Hall Effect Sensor Market Value & Volume, 2021-2026 ($)
Figure 81: Belgium GDP and Population, 2018-2019 ($)
Figure 82: Belgium GDP – Composition of 2018, By Sector of Origin
Figure 83: Belgium Export and Import Value & Volume, 2018-2019 ($)
Figure 84: Spain Hall Effect Sensor Market Value & Volume, 2021-2026 ($)
Figure 85: Spain GDP and Population, 2018-2019 ($)
Figure 86: Spain GDP – Composition of 2018, By Sector of Origin
Figure 87: Spain Export and Import Value & Volume, 2018-2019 ($)
Figure 88: Denmark Hall Effect Sensor Market Value & Volume, 2021-2026 ($)
Figure 89: Denmark GDP and Population, 2018-2019 ($)
Figure 90: Denmark GDP – Composition of 2018, By Sector of Origin
Figure 91: Denmark Export and Import Value & Volume, 2018-2019 ($)
Figure 92: APAC Hall Effect Sensor Market Value & Volume, 2021-2026 ($)
Figure 93: China Hall Effect Sensor Market Value & Volume, 2021-2026
Figure 94: China GDP and Population, 2018-2019 ($)
Figure 95: China GDP – Composition of 2018, By Sector of Origin
Figure 96: China Export and Import Value & Volume, 2018-2019 ($)Hall Effect Sensor Market China Export and Import Value & Volume, 2018-2019 ($)
Figure 97: Australia Hall Effect Sensor Market Value & Volume, 2021-2026 ($)
Figure 98: Australia GDP and Population, 2018-2019 ($)
Figure 99: Australia GDP – Composition of 2018, By Sector of Origin
Figure 100: Australia Export and Import Value & Volume, 2018-2019 ($)
Figure 101: South Korea Hall Effect Sensor Market Value & Volume, 2021-2026 ($)
Figure 102: South Korea GDP and Population, 2018-2019 ($)
Figure 103: South Korea GDP – Composition of 2018, By Sector of Origin
Figure 104: South Korea Export and Import Value & Volume, 2018-2019 ($)
Figure 105: India Hall Effect Sensor Market Value & Volume, 2021-2026 ($)
Figure 106: India GDP and Population, 2018-2019 ($)
Figure 107: India GDP – Composition of 2018, By Sector of Origin
Figure 108: India Export and Import Value & Volume, 2018-2019 ($)
Figure 109: Taiwan Hall Effect Sensor Market Value & Volume, 2021-2026 ($)
Figure 110: Taiwan GDP and Population, 2018-2019 ($)
Figure 111: Taiwan GDP – Composition of 2018, By Sector of Origin
Figure 112: Taiwan Export and Import Value & Volume, 2018-2019 ($)
Figure 113: Malaysia Hall Effect Sensor Market Value & Volume, 2021-2026 ($)
Figure 114: Malaysia GDP and Population, 2018-2019 ($)
Figure 115: Malaysia GDP – Composition of 2018, By Sector of Origin
Figure 116: Malaysia Export and Import Value & Volume, 2018-2019 ($)
Figure 117: Hong Kong Hall Effect Sensor Market Value & Volume, 2021-2026 ($)
Figure 118: Hong Kong GDP and Population, 2018-2019 ($)
Figure 119: Hong Kong GDP – Composition of 2018, By Sector of Origin
Figure 120: Hong Kong Export and Import Value & Volume, 2018-2019 ($)
Figure 121: Middle East & Africa Hall Effect Sensor Market Middle East & Africa 3D Printing Market Value & Volume, 2021-2026 ($)
Figure 122: Russia Hall Effect Sensor Market Value & Volume, 2021-2026 ($)
Figure 123: Russia GDP and Population, 2018-2019 ($)
Figure 124: Russia GDP – Composition of 2018, By Sector of Origin
Figure 125: Russia Export and Import Value & Volume, 2018-2019 ($)
Figure 126: Israel Hall Effect Sensor Market Value & Volume, 2021-2026 ($)
Figure 127: Israel GDP and Population, 2018-2019 ($)
Figure 128: Israel GDP – Composition of 2018, By Sector of Origin
Figure 129: Israel Export and Import Value & Volume, 2018-2019 ($)
Figure 130: Entropy Share, By Strategies, 2018-2019* (%)Hall Effect Sensor Market
Figure 131: Developments, 2018-2019*Hall Effect Sensor Market
Figure 132: Company 1 Hall Effect Sensor Market Net Revenue, By Years, 2018-2019* ($)
Figure 133: Company 1 Hall Effect Sensor Market Net Revenue Share, By Business segments, 2018 (%)
Figure 134: Company 1 Hall Effect Sensor Market Net Sales Share, By Geography, 2018 (%)
Figure 135: Company 2 Hall Effect Sensor Market Net Revenue, By Years, 2018-2019* ($)
Figure 136: Company 2 Hall Effect Sensor Market Net Revenue Share, By Business segments, 2018 (%)
Figure 137: Company 2 Hall Effect Sensor Market Net Sales Share, By Geography, 2018 (%)
Figure 138: Company 3 Hall Effect Sensor Market Net Revenue, By Years, 2018-2019* ($)
Figure 139: Company 3 Hall Effect Sensor Market Net Revenue Share, By Business segments, 2018 (%)
Figure 140: Company 3 Hall Effect Sensor Market Net Sales Share, By Geography, 2018 (%)
Figure 141: Company 4 Hall Effect Sensor Market Net Revenue, By Years, 2018-2019* ($)
Figure 142: Company 4 Hall Effect Sensor Market Net Revenue Share, By Business segments, 2018 (%)
Figure 143: Company 4 Hall Effect Sensor Market Net Sales Share, By Geography, 2018 (%)
Figure 144: Company 5 Hall Effect Sensor Market Net Revenue, By Years, 2018-2019* ($)
Figure 145: Company 5 Hall Effect Sensor Market Net Revenue Share, By Business segments, 2018 (%)
Figure 146: Company 5 Hall Effect Sensor Market Net Sales Share, By Geography, 2018 (%)
Figure 147: Company 6 Hall Effect Sensor Market Net Revenue, By Years, 2018-2019* ($)
Figure 148: Company 6 Hall Effect Sensor Market Net Revenue Share, By Business segments, 2018 (%)
Figure 149: Company 6 Hall Effect Sensor Market Net Sales Share, By Geography, 2018 (%)
Figure 150: Company 7 Hall Effect Sensor Market Net Revenue, By Years, 2018-2019* ($)
Figure 151: Company 7 Hall Effect Sensor Market Net Revenue Share, By Business segments, 2018 (%)
Figure 152: Company 7 Hall Effect Sensor Market Net Sales Share, By Geography, 2018 (%)
Figure 153: Company 8 Hall Effect Sensor Market Net Revenue, By Years, 2018-2019* ($)
Figure 154: Company 8 Hall Effect Sensor Market Net Revenue Share, By Business segments, 2018 (%)
Figure 155: Company 8 Hall Effect Sensor Market Net Sales Share, By Geography, 2018 (%)
Figure 156: Company 9 Hall Effect Sensor Market Net Revenue, By Years, 2018-2019* ($)
Figure 157: Company 9 Hall Effect Sensor Market Net Revenue Share, By Business segments, 2018 (%)
Figure 158: Company 9 Hall Effect Sensor Market Net Sales Share, By Geography, 2018 (%)
Figure 159: Company 10 Hall Effect Sensor Market Net Revenue, By Years, 2018-2019* ($)
Figure 160: Company 10 Hall Effect Sensor Market Net Revenue Share, By Business segments, 2018 (%)
Figure 161: Company 10 Hall Effect Sensor Market Net Sales Share, By Geography, 2018 (%)
Figure 162: Company 11 Hall Effect Sensor Market Net Revenue, By Years, 2018-2019* ($)
Figure 163: Company 11 Hall Effect Sensor Market Net Revenue Share, By Business segments, 2018 (%)
Figure 164: Company 11 Hall Effect Sensor Market Net Sales Share, By Geography, 2018 (%)
Figure 165: Company 12 Hall Effect Sensor Market Net Revenue, By Years, 2018-2019* ($)
Figure 166: Company 12 Hall Effect Sensor Market Net Revenue Share, By Business segments, 2018 (%)
Figure 167: Company 12 Hall Effect Sensor Market Net Sales Share, By Geography, 2018 (%)
Figure 168: Company 13 Hall Effect Sensor Market Net Revenue, By Years, 2018-2019* ($)
Figure 169: Company 13 Hall Effect Sensor Market Net Revenue Share, By Business segments, 2018 (%)
Figure 170: Company 13 Hall Effect Sensor Market Net Sales Share, By Geography, 2018 (%)
Figure 171: Company 14 Hall Effect Sensor Market Net Revenue, By Years, 2018-2019* ($)
Figure 172: Company 14 Hall Effect Sensor Market Net Revenue Share, By Business segments, 2018 (%)
Figure 173: Company 14 Hall Effect Sensor Market Net Sales Share, By Geography, 2018 (%)
Figure 174: Company 15 Hall Effect Sensor Market Net Revenue, By Years, 2018-2019* ($)
Figure 175: Company 15 Hall Effect Sensor Market Net Revenue Share, By Business segments, 2018 (%)
Figure 176: Company 15 Hall Effect Sensor Market Net Sales Share, By Geography, 2018 (%)