 Email
Email Print
Print


U.S. Medical Wires & Cables Market - Forecast(2024 - 2030)
Medical services require wires and cables for measurement and treatment purposes. For medical cable assemblies that must withstand a high number of steam autoclave cycles, silicone-jacketed cable and silicone over-molding of strain reliefs are typically required.
Medical tubing is one of the major applications of silicone and is used in devices such as respirators and intravenous drug. Apart from these, silicone are also used in ventilation masks, transfusion delivery systems, handles for surgical instruments, breading tubes, microphone holders for hearing aids, tube connector and many other.
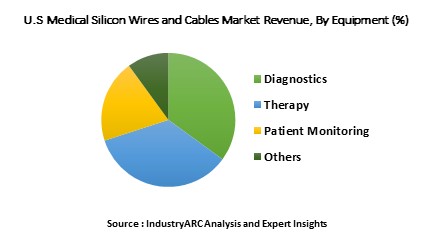
Rising health concerns coupled with the increasing adoption of advanced technologies in the field of medicine for various applications have been stimulating the market revenue in the recent years. Rising infrastructure development in healthcare will allow the silicon wire and cable manufacturers to expand their penetration in the country with huge application of these wires from medical equipment to patient care. The global U.S. Medical Silicone Wires & Cables market is estimated at 609.91 million in 2017 and is expected to grow with a CAGR of 4.44%.
What are Silicone Medical Wires & Cables?
Silicone is an elastomeric polymer which is composed of carbon, hydrogen & oxygen which amalgamates to form a heat resistant rubber like material with properties similar to non-reactiveness, stability and resistant to extreme environments and temperatures coupled with highly flexibility at lower temperatures. Silicone is used both as a jacket material and over-mold for cable assemblies in medical device applications because it is the most compatible in terms of sterilization, disinfection, and cleaning. Typically, the same over-molding captures the silicone jacketed cable and creates a chemical bond between over-molded strain relief and the cable jacket also enhancing sterilization withstand.
What are the major applications for Medical Wires & Cables?
Most medical cable assemblies that are designed to withstand a high number of steam sterilization cycles incorporate one or more metal shell connectors and silicone-jacketed cable or coaxial cables. Over-molding silicone provides a stronger bond to metal connector components than thermoplastic resins, creating a moisture-proof mechanical bond which contributes to sterilization withstand.
Silicone cable assemblies are characterized by excellent flexibility, durability and the ability to withstand cleaning, disinfection and hundreds of steam autoclave sterilization cycles. These characteristics make silicone a logical material choice for cables used for video endoscopy, surgical power tools, electrosurgical instruments, laparoscopy, ophthalmic lasers and robotic surgery.
Market Research and Market Trends of U.S. Medical Wires & Cables Ecosystem
- The Wiring Harness Manufacturer’s Association Manufacturer Members has been formed which recognize the sensitivity and specific requirements in manufacturing medical equipment and devices. WHMA’s Manufacturer Members are recognized in the Cable and Wire Harness Industry through their understanding and practice of the “IPC/WHMA-A-620 Standard” which is the worldwide benchmark for quality workmanship in medical wires and cables. The association sets regulatory standards for medical cables and wires since the equipment is sensitive and deals with people’s life. The association comprises of about 100 members and is headquartered in state of Minnesota in the U.S.
- There has been a continuous demand for miniaturization of assemblies and systems in medical domain. Particularly in chemically resistant products it has been necessary to develop processes and equipment which are not currently available on the market. Lorom has been able to develop processing and manufacturing skills in every component in medical devices and interconnects. LOROM is an international player and has invested significantly over the past in R&D to be able to offer unrivalled medical cables that are within a controlled environment. The chemical labs at Lorom are fully equipped with rheometry, X-rays, gas chromatography, spectrometry, etc. equipment.
- Northwire has developed new medical cable BioCompatic which saves customers time and money with the help of rapid response capabilities and innovative design. The cable assembly offers robust resistance to environmental factors and sterilization means; it is combined with The LEMO Group's REDEL connectors. LEMO manufactures high quality push-pull connectors which are integral part of equipment operated in challenging applications; engineering extremes and harsh environments. BioCompatic offers a quick, reliable, and cost-effective path to market and ensures valued customers’ competitive advantage in the global economy.
Who are the Major Players in U.S. Medical Wires & Cables market?
The players profiled in the report include Leoni AG, Sumitomo Electric U.S.A., Hitachi Cables, Carlisle Medical Technologies, AME Systems, Advanced Transit Mfg, Altex. Amer Cable&Harness, Amsco US, Arc-Tronics, Arimon Tech, Aved Electronics.
What is our report scope?
The report incorporates in-depth assessment of the competitive landscape, product market sizing, product benchmarking, market trends, product developments, financial analysis, strategic analysis and so on to gauge the impact forces and potential opportunities of the market. Apart from this the report also includes a study of major developments in the market such as product launches, agreements, acquisitions, collaborations, mergers and so on to comprehend the prevailing market dynamics at present and its impact during the forecast period 2018-2024.
All our reports are customizable to your company needs to a certain extent, we do provide 20 free consulting hours along with purchase of each report, and this will allow you to request any additional data to customize the report to your needs.
Key Takeaways from this Report
- Evaluate market potential through analyzing growth rates (CAGR %), Volume (Units) and Value ($M) data given at country level – for product types, end use applications and by different industry verticals.
- Understand the different dynamics influencing the market – key driving factors, challenges and hidden opportunities.
- Get in-depth insights on your competitor performance – market shares, strategies, financial benchmarking, product benchmarking, SWOT and more.
- Analyze the sales and distribution channels across key geographies to improve top-line revenues.
- Understand the industry supply chain with a deep-dive on the value augmentation at each step, in order to optimize value and bring efficiencies in your processes.
- Get a quick outlook on the market entropy – M&A’s, deals, partnerships, product launches of all key players for the past 4 years.
- Evaluate the supply-demand gaps, import-export statistics and regulatory landscape for more than top 20 countries globally for the market.
1. U.S. Medical Wires & Cables- Market Overview
2. Executive Summary
3. U.S. Medical Wires & Cables - Market Landscape
3.1. Market Share Analysis
3.2. Comparative Analysis
3.2.1. Product Benchmarking
3.2.2. End User Profiling
3.2.3. Top 5 Financials Analysis
4. U.S. Medical Wires & Cables- Market Forces
4.1. Market Drivers
4.2. Market Constraints
4.3. Market Challenges
4.4. Attractiveness of the U.S. Medical Wires & Cables market
4.4.1. Power of Suppliers
4.4.2. Power of Customers
4.4.3. Threat of New Entrants
4.4.4. Threat of Substitution
4.4.5. Degree of Competition
5. U.S. Medical Wires & Cables market- Strategic Analysis
5.1. Value Chain Analysis
5.2. Pricing Analysis
5.3. Opportunities Analysis
5.4. Product/Market Life Cycle Analysis
5.5. Suppliers and Distributors
6. U.S Medical Silicone Wires & Cables Market – By Equipment
6.1. Medical Tubing & Taping
6.2. Wires & Cable
6.2.1. Lead Wire
6.2.2. Coaxial Cables
6.2.3. Flat Cables
6.2.4. Others
6.3. Integrated Systems
6.4. Connectors
6.5. Others
7. U.S Medical Silicone Wires & Cables Market – By Applications
7.1. Diagnostics
7.1.1. X-ray
7.1.2. CT
7.1.3. Ultrasound
7.1.4. Molecular imaging/nuclear medicine
7.1.5. Endoscopy
7.1.6. ECG, EEG, MEG
7.1.7. Others
7.2. Therapy
7.2.1. Radiotherapy
7.2.2. Laser medicine
7.2.3. Laparoscopy
7.2.4. Catheter technology
7.2.5. Others
7.3. Patient Monitoring
7.3.1. Oxygen measurement
7.3.2. Temperature measurement
7.3.3. Blood pressure measurement
7.3.4. Neurological monitoring
7.3.5. Sleep diagnostics/ monitoring
7.3.6. Inter operative monitoring (IOM)
7.3.7. Others
7.4. Others
8. U.S. Medical Wires & Cables Market - By Geography
8.1. North America
8.1.1. U.S.
8.1.2. Canada
8.1.3. Mexico
8.2. South America
8.2.1. Brazil
8.2.2. Venezuela
8.2.3. Argentina
8.2.4. Ecuador
8.2.5. Peru
8.2.6. Colombia
8.2.7. Costa Rica
9. Market Entropy
9.1. New Product Launches
9.2. M&As, Collaborations, JVs, Partnership
10. Company Profiles (Overview, Financials, SWOT Analysis, Developments, Product Portfolio)
10.1. Leoni AG
10.2. Sumitomo Electric U.S.A.
10.3. Hitachi Cables
10.4. Carlisle Medical Technologies
10.5. AME Systems
10.6. Advanced Transit Mfg
10.7. Altex
10.8. Amer Cable&Harness
10.9. Amsco US
10.10. Arc-Tronics
*More than 10 Companies are profiled in this Research Report*
"*Financials would be provided on a best efforts basis for private companies"
11. Appendix
11.1. Abbreviations
11.2. Sources
11.3. Research Methodology
11.4. Bibliography
11.5. Compilation of Expert Insights
11.6. Disclaimer
List of Tables
Table 1: U.S. Medical Wires & Cables Market Overview 2021-2026
Table 2: U.S. Medical Wires & Cables Market Leader Analysis 2018-2019 (US$)
Table 3: U.S. Medical Wires & Cables Market Product Analysis 2018-2019 (US$)
Table 4: U.S. Medical Wires & Cables Market End User Analysis 2018-2019 (US$)
Table 5: U.S. Medical Wires & Cables Market Patent Analysis 2013-2018* (US$)
Table 6: U.S. Medical Wires & Cables Market Financial Analysis 2018-2019 (US$)
Table 7: U.S. Medical Wires & Cables Market Driver Analysis 2018-2019 (US$)
Table 8: U.S. Medical Wires & Cables Market Challenges Analysis 2018-2019 (US$)
Table 9: U.S. Medical Wires & Cables Market Constraint Analysis 2018-2019 (US$)
Table 10: U.S. Medical Wires & Cables Market Supplier Bargaining Power Analysis 2018-2019 (US$)
Table 11: U.S. Medical Wires & Cables Market Buyer Bargaining Power Analysis 2018-2019 (US$)
Table 12: U.S. Medical Wires & Cables Market Threat of Substitutes Analysis 2018-2019 (US$)
Table 13: U.S. Medical Wires & Cables Market Threat of New Entrants Analysis 2018-2019 (US$)
Table 14: U.S. Medical Wires & Cables Market Degree of Competition Analysis 2018-2019 (US$)
Table 15: U.S. Medical Wires & Cables Market Value Chain Analysis 2018-2019 (US$)
Table 16: U.S. Medical Wires & Cables Market Pricing Analysis 2021-2026 (US$)
Table 17: U.S. Medical Wires & Cables Market Opportunities Analysis 2021-2026 (US$)
Table 18: U.S. Medical Wires & Cables Market Product Life Cycle Analysis 2021-2026 (US$)
Table 19: U.S. Medical Wires & Cables Market Supplier Analysis 2018-2019 (US$)
Table 20: U.S. Medical Wires & Cables Market Distributor Analysis 2018-2019 (US$)
Table 21: U.S. Medical Wires & Cables Market Trend Analysis 2018-2019 (US$)
Table 22: U.S. Medical Wires & Cables Market Size 2018 (US$)
Table 23: U.S. Medical Wires & Cables Market Forecast Analysis 2021-2026 (US$)
Table 24: U.S. Medical Wires & Cables Market Sales Forecast Analysis 2021-2026 (Units)
Table 25: U.S. Medical Wires & Cables Market, Revenue & Volume,By Equipment, 2021-2026 ($)
Table 26: U.S. Medical Wires & Cables Market By Equipment, Revenue & Volume,By Diagnostics, 2021-2026 ($)
Table 27: U.S. Medical Wires & Cables Market By Equipment, Revenue & Volume,By Therapy, 2021-2026 ($)
Table 28: U.S. Medical Wires & Cables Market By Equipment, Revenue & Volume,By Patient Monitoring, 2021-2026 ($)
Table 29: U.S. Medical Wires & Cables Market By Equipment, Revenue & Volume,By Oxygen measurement, 2021-2026 ($)
Table 30: U.S. Medical Wires & Cables Market By Equipment, Revenue & Volume,By Temperature measurement, 2021-2026 ($)
Table 31: U.S. Medical Wires & Cables Market, Revenue & Volume,By Application, 2021-2026 ($)
Table 32: U.S. Medical Wires & Cables Market By Application, Revenue & Volume,By Medical Tubing, 2021-2026 ($)
Table 33: U.S. Medical Wires & Cables Market By Application, Revenue & Volume,By Wires & Cable, 2021-2026 ($)
Table 34: U.S. Medical Wires & Cables Market By Application, Revenue & Volume,By Lead Wire, 2021-2026 ($)
Table 35: Top Companies 2018 (US$)U.S. Medical Wires & Cables Market, Revenue & Volume,,
Table 36: Product Launch 2018-2019U.S. Medical Wires & Cables Market, Revenue & Volume,,
Table 37: Mergers & Acquistions 2018-2019U.S. Medical Wires & Cables Market, Revenue & Volume,,
List of Figures
Figure 1: Overview of U.S. Medical Wires & Cables Market 2021-2026
Figure 2: Market Share Analysis for U.S. Medical Wires & Cables Market 2018 (US$)
Figure 3: Product Comparison in U.S. Medical Wires & Cables Market 2018-2019 (US$)
Figure 4: End User Profile for U.S. Medical Wires & Cables Market 2018-2019 (US$)
Figure 5: Patent Application and Grant in U.S. Medical Wires & Cables Market 2013-2018* (US$)
Figure 6: Top 5 Companies Financial Analysis in U.S. Medical Wires & Cables Market 2018-2019 (US$)
Figure 7: Market Entry Strategy in U.S. Medical Wires & Cables Market 2018-2019
Figure 8: Ecosystem Analysis in U.S. Medical Wires & Cables Market 2018
Figure 9: Average Selling Price in U.S. Medical Wires & Cables Market 2021-2026
Figure 10: Top Opportunites in U.S. Medical Wires & Cables Market 2018-2019
Figure 11: Market Life Cycle Analysis in U.S. Medical Wires & Cables Market
Figure 12: GlobalBy Equipment U.S. Medical Wires & Cables Market Revenue, 2021-2026 ($)
Figure 13: GlobalBy ApplicationU.S. Medical Wires & Cables Market Revenue, 2021-2026 ($)
Figure 14: Global U.S. Medical Wires & Cables Market - By Geography
Figure 15: Global U.S. Medical Wires & Cables Market Value & Volume, By Geography, 2021-2026 ($)
Figure 16: Global U.S. Medical Wires & Cables Market CAGR, By Geography, 2021-2026 (%)
Figure 17: Entropy Share, By Strategies, 2018-2019* (%)U.S. Medical Wires & Cables Market
Figure 18: Developments, 2018-2019*U.S. Medical Wires & Cables Market
Figure 19: Company 1 U.S. Medical Wires & Cables Market Net Revenue, By Years, 2018-2019* ($)
Figure 20: Company 1 U.S. Medical Wires & Cables Market Net Revenue Share, By Business segments, 2018 (%)
Figure 21: Company 1 U.S. Medical Wires & Cables Market Net Sales Share, By Geography, 2018 (%)
Figure 22: Company 2 U.S. Medical Wires & Cables Market Net Revenue, By Years, 2018-2019* ($)
Figure 23: Company 2 U.S. Medical Wires & Cables Market Net Revenue Share, By Business segments, 2018 (%)
Figure 24: Company 2 U.S. Medical Wires & Cables Market Net Sales Share, By Geography, 2018 (%)
Figure 25: Company 3U.S. Medical Wires & Cables Market Net Revenue, By Years, 2018-2019* ($)
Figure 26: Company 3U.S. Medical Wires & Cables Market Net Revenue Share, By Business segments, 2018 (%)
Figure 27: Company 3U.S. Medical Wires & Cables Market Net Sales Share, By Geography, 2018 (%)
Figure 28: Company 4 U.S. Medical Wires & Cables Market Net Revenue, By Years, 2018-2019* ($)
Figure 29: Company 4 U.S. Medical Wires & Cables Market Net Revenue Share, By Business segments, 2018 (%)
Figure 30: Company 4 U.S. Medical Wires & Cables Market Net Sales Share, By Geography, 2018 (%)
Figure 31: Company 5 U.S. Medical Wires & Cables Market Net Revenue, By Years, 2018-2019* ($)
Figure 32: Company 5 U.S. Medical Wires & Cables Market Net Revenue Share, By Business segments, 2018 (%)
Figure 33: Company 5 U.S. Medical Wires & Cables Market Net Sales Share, By Geography, 2018 (%)
Figure 34: Company 6 U.S. Medical Wires & Cables Market Net Revenue, By Years, 2018-2019* ($)
Figure 35: Company 6 U.S. Medical Wires & Cables Market Net Revenue Share, By Business segments, 2018 (%)
Figure 36: Company 6 U.S. Medical Wires & Cables Market Net Sales Share, By Geography, 2018 (%)
Figure 37: Company 7 U.S. Medical Wires & Cables Market Net Revenue, By Years, 2018-2019* ($)
Figure 38: Company 7 U.S. Medical Wires & Cables Market Net Revenue Share, By Business segments, 2018 (%)
Figure 39: Company 7 U.S. Medical Wires & Cables Market Net Sales Share, By Geography, 2018 (%)
Figure 40: Company 8 U.S. Medical Wires & Cables Market Net Revenue, By Years, 2018-2019* ($)
Figure 41: Company 8 U.S. Medical Wires & Cables Market Net Revenue Share, By Business segments, 2018 (%)
Figure 42: Company 8 U.S. Medical Wires & Cables Market Net Sales Share, By Geography, 2018 (%)
Figure 43: Company 9 U.S. Medical Wires & Cables Market Net Revenue, By Years, 2018-2019* ($)
Figure 44: Company 9 U.S. Medical Wires & Cables Market Net Revenue Share, By Business segments, 2018 (%)
Figure 45: Company 9 U.S. Medical Wires & Cables Market Net Sales Share, By Geography, 2018 (%)
Figure 46: Company 10 U.S. Medical Wires & Cables Market Net Revenue, By Years, 2018-2019* ($)
Figure 47: Company 10 U.S. Medical Wires & Cables Market Net Revenue Share, By Business segments, 2018 (%)
Figure 48: Company 10 U.S. Medical Wires & Cables Market Net Sales Share, By Geography, 2018 (%)
Figure 49: Company 11 U.S. Medical Wires & Cables Market Net Revenue, By Years, 2018-2019* ($)
Figure 50: Company 11 U.S. Medical Wires & Cables Market Net Revenue Share, By Business segments, 2018 (%)
Figure 51: Company 11 U.S. Medical Wires & Cables Market Net Sales Share, By Geography, 2018 (%)
Figure 52: Company 12 U.S. Medical Wires & Cables Market Net Revenue, By Years, 2018-2019* ($)
Figure 53: Company 12 U.S. Medical Wires & Cables Market Net Revenue Share, By Business segments, 2018 (%)
Figure 54: Company 12 U.S. Medical Wires & Cables Market Net Sales Share, By Geography, 2018 (%)
Figure 55: Company 13U.S. Medical Wires & Cables Market Net Revenue, By Years, 2018-2019* ($)
Figure 56: Company 13U.S. Medical Wires & Cables Market Net Revenue Share, By Business segments, 2018 (%)
Figure 57: Company 13U.S. Medical Wires & Cables Market Net Sales Share, By Geography, 2018 (%)
Figure 58: Company 14 U.S. Medical Wires & Cables Market Net Revenue, By Years, 2018-2019* ($)
Figure 59: Company 14 U.S. Medical Wires & Cables Market Net Revenue Share, By Business segments, 2018 (%)
Figure 60: Company 14 U.S. Medical Wires & Cables Market Net Sales Share, By Geography, 2018 (%)
Figure 61: Company 15 U.S. Medical Wires & Cables Market Net Revenue, By Years, 2018-2019* ($)
Figure 62: Company 15 U.S. Medical Wires & Cables Market Net Revenue Share, By Business segments, 2018 (%)
Figure 63: Company 15 U.S. Medical Wires & Cables Market Net Sales Share, By Geography, 2018 (%)