 Email
Email Print
Print


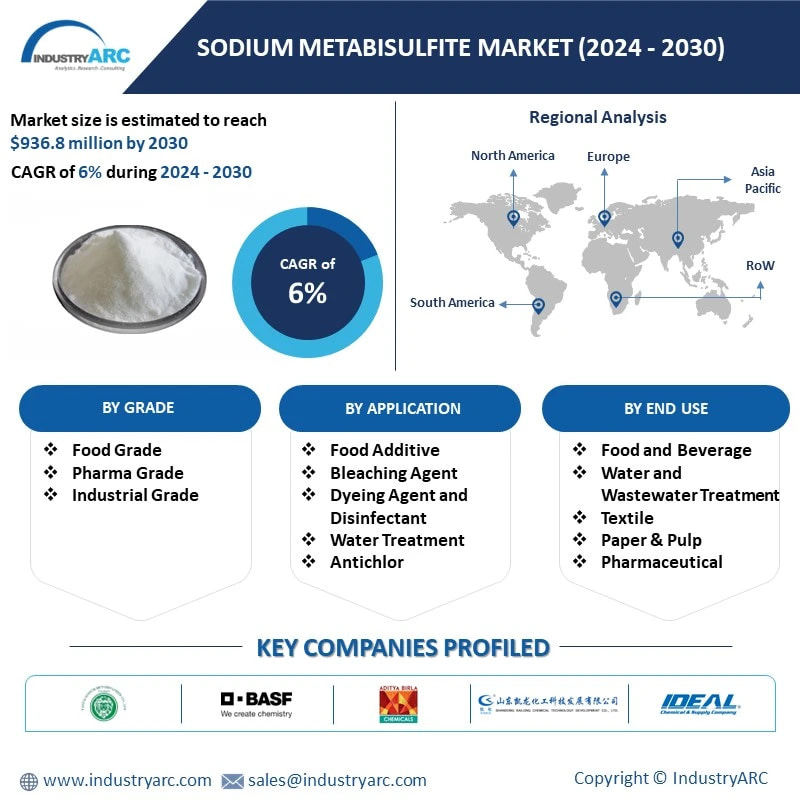
Sodium Metabisulfite Market - Forecast(2024 - 2030)
Sodium Metabisulfite Market Overview
Sodium Metabisulfite Market
is forecast to reach $936.76 million by 2030, after growing
at a CAGR of 6% during 2024-2030. Sodium metabisulfite is an inorganic
white, granular sodium salt composed of sodium and disulfite ions. Sodium
metabisulfite is used as preservatives in foods, thus global increase in demand
for packaged food products is expected to boost the Sodium Metabisulfite Market
size. Whereas, surging use of sodium metabisulfite as disinfectant, and
antioxidant in cosmetics and personal care products further fuel the market
growth. However, laboratory tests have shown carcinogenic results on exposure
to sodium metabisulfite, which hinder its market growth. The increasing demand
for sodium metabisulfite is primarily driven by its widespread application
across various industries, notably in food and beverage, water treatment, and
pharmaceuticals. Sodium metabisulfite serves as a versatile additive, acting as
a preservative, antioxidant, and sterilizing agent, thereby extending the shelf
life of perishable products and maintaining product quality. In the food and
beverage industry, it is commonly used as a food preservative and antioxidant
to prevent spoilage and discoloration. Additionally, sodium metabisulfite plays
a crucial role in water treatment processes, where it effectively removes
harmful contaminants and disinfects water supplies. Moreover, its use in pharmaceuticals
for sterilization and as a reducing agent underscores its importance in
ensuring product safety and efficacy. As industries continue to prioritize
product quality, safety, and regulatory compliance, the demand for sodium
metabisulfite is expected to witness steady growth, reflecting its essential
role in diverse industrial applications. One key driver behind the growing
demand for sodium metabisulfite is its extensive use as a preservative and
antioxidant in the food and beverage industry. Sodium metabisulfite helps to
inhibit the growth of bacteria and fungi, thereby extending the shelf life of
perishable food products and maintaining their quality during storage and
transportation. This preservation function is particularly crucial in
industries such as food processing, where maintaining product freshness and
safety is paramount to meet consumer expectations and regulatory standards.
Additionally, sodium metabisulfite's role in preventing enzymatic browning in
fruits and vegetables further enhances its appeal to food manufacturers seeking
to preserve the visual appeal of their products. As consumer demand for
convenience foods and longer shelf life continues to rise, the demand for
sodium metabisulfite as a preservative in the food and beverage industry is
expected to increase correspondingly.
Market Snapshot:
Report Coverage
The report: “Sodium
Metabisulfite Market – Forecast (2024-2030)”, by IndustryARC, covers an
in-depth analysis of the following segments of the Sodium Metabisulfite Market.
By Grade: Food Grade, Pharma Grade, and Industrial
Grade.
By Application: Food Additive, Bleaching
Agent, Dyeing Agent and Disinfectant, Water Treatment,
Antichlor, Reducing Agent, Laboratory Agent, and Others.
By End-Use: Food & Beverage (Bakery, Seafood, Brewery,
and Others), Water and Wastewater Treatment, Textile, Paper & Pulp,
Leather, Pharmaceuticals, Mining, Film and Photography, and Others.
By Geography: North America, South America, Europe, APAC,
and RoW.
Key Takeaways
- The increase in research
and development in new drug formulation has triggered the market demand of
sodium metabisulfite in the pharmaceutical industry.
- Decline in
manufacturing activities and disruption of supply chain due to the
outbreak of coronavirus has hampered the growth of the Sodium
Metabisulfite Market.
- Increasing adoption of
UV technologies and RO filtration lower the demand of sodium metabisulfite
from wastewater and sewage treatment plants.
For More Details on This Report - Request for Sample
Sodium Metabisulfite Market Segment Analysis - By
Grade
Based on the grade,
industrial grade segment held the largest share of more than 30% in the Sodium
Metabisulfite Market in 2023. Sodium metabisulfite of industrial grades are
used as bleaching or antichlor agent in paper industries as it reduces the
natural element that causes paper to brown, from the wood pulp, and increase
the brightness of paper. Owing to various environmental benefits, demand for
paper and pulp is increasing which in turn augments the growth of the Sodium
Metabisulfite Market. Growing need for hygiene products such as paper cups,
tissue papers, and packaging also accelerate the need for paper pulp thereby
stimulating the sodium metabisulfite demand. Sodium metabisulfite is also used
as an oxygen scavenging agent in steam boilers further aiding the growth of the
market.
Sodium Metabisulfite Market Segment Analysis - By
Application
Water Treatment segment
holds the largest share of more than 25% in the Sodium Metabisulfite Market in
2023. Sodium metabisulfite is commonly used for the removal of free chlorine
and as a biostatic in water treatment plants. Sodium metabisulfite reduces free
chlorine to form sodium bisulfate (NaHSO4) and hydrochloric acid
(HCl). Efficacy and cost effectiveness compared to other water treatment
chemicals such as ferric sulfate and sodium chloride are major factors driving
the growth of the Sodium Metabisulfite Market. In addition, surging
demand for freshwater from emerging nations like African country provide an
opportunity for the growth of Sodium Metabisulfite Market.
Sodium Metabisulfite Market Segment Analysis - By
End Use
Food & Beverage segment
holds the largest share of
more than 30% in the Sodium Metabisulfite Market in 2023. A significant rise in
per capita consumption of packaged food and beverages, is likely to have a
major impact on the demand for sodium metabisulfite. As, sodium metabisulfite
is used as a preservative in dried foods and canned juices. Moreover, sodium metabisulfite
is also used in commercial wines to prevent oxidation and preserve flavor. In
additions, Sodium metabisulfite also serves as a conservation and
anti-oxidation agent for the protection of shellfish against melanosis further
drives the Sodium Metabisulfite Market growth.
Sodium Metabisulfite Market Segment Analysis - By
Geography
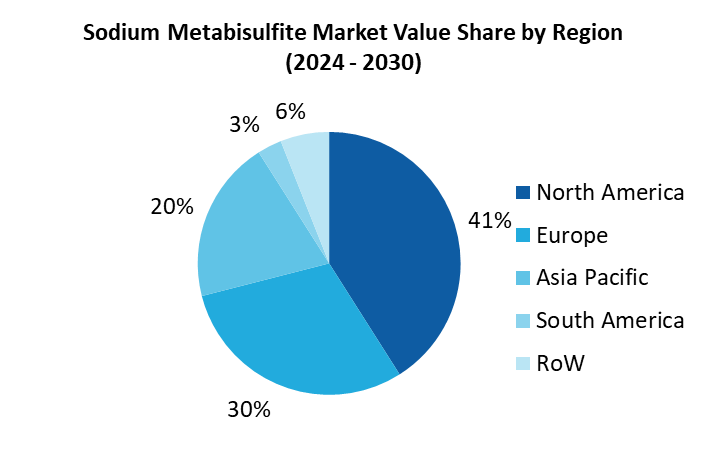
Asia Pacific has dominated
the Sodium Metabisulfite Market with a share of more than 40% in 2023 followed
by North America and Europe. Population growth combined with rapid
industrialization and high disposable income are driving the growth of Sodium
Metabisulfite Market in APAC region. Furthermore, increasing demand for
apparel, growing fashion trends, and flourishing textile industries across the
country is aiding the growth of the market. Huge spending of youth on apparels
and leather products further contributes to the Sodium Metabisulfite
Market growth.
Sodium Metabisulfite Market Drivers
Growing demand from mining industries and strict
government regulation for wastewater treatment
Sodium metabisulfite, as a
reducing agent, helps to remove cyanide and extract pure gold. It is widely
used for cyanide detoxification in gold mining. Surging demand of gold for
jewelry and orthodontic appliances fuel the demand for sodium metabisulfite. The
growth in mineral mining sector further propels the market growth. Besides, the
stringent government regulations for the direct disposal of contaminated water
also escalates the use of sodium metabisulfite in manufacturing industries. For
instance, the United States Environmental Protection Agency (EPA) regulates the
discharge and treatment of wastewater under the Clean Water Act (CWA). The
National Pollutant Discharge Elimination System (NPDES) issues permits to all
wastewater dischargers and treatment facilities. Thus, growing mining
activities and water treatment norms boosts the growth of the Sodium
Metabisulfite Market.
Increasing usage of sodium metabisulfite in medical
sector
Sodium metabisulfite is used
as an antioxidant in many pharmaceutical formulations such as Acetaminophen 500
mg, Dilaudid, Hydromorphone Hydrochloride, and local anesthesia. Accelerating
use of sodium metabisulfite as an excipient to medications which contain
adrenaline (epinephrine), in order to prevent the oxidation of adrenaline
further augments the growth of the market. Moreover, technology advancements
and government’s spending on healthcare is expected to drive the growth of
Sodium Metabisulfite Market during forecast period.
Sodium Metabisulfite Market Challenges
Harmful effects of sodium metabisulfite on human
health and availability of other alternatives
Sodium metabisulfite is
noncombustible, but may decompose to emit toxic oxide fumes of sulfur and
sodium when heated to high temperature. Exposure to sodium metabisulfite can
cause irritation to the skin, eyes, and respiratory tract. Breathing sodium metabisulfite
dusts may cause headaches, breathing difficulties, and heart irregularity.
Thus, the harmful effects of sodium metabisulfite acts as a restraining factor
to the market growth. Whereas, the adoption of U.V technologies and RO water
filtration whose purification efficiency is higher than sodium metabisulfite
hampers the growth of the market. Thus, an alternative dichlorination treatment
system to replace sodium metabisulfite (SMBS), reduce the usage of
chlorination, and achieve a chemical-free dichlorination process acts as a
restraint for the market growth.
Market Landscape
Technology launches,
acquisitions and R&D activities are key strategies adopted by players in
the Sodium Metabisulfite Market report. Major players in the Sodium
Metabisulfite Market are BASF SE, Aditya Birla Chemicals, Esseco USA LLC,
Seidler Chemical Co., Shandong Kailong Chemical Technology Development Co.
Ltd., Tangshan Sanjiang Chemical Co. Ltd., Grillo-Werke AG, Solvay S.A.,
Hydrite Chemical Co., Surpass Chemical Company, Inc., Weifang Taida United
Chemical Co. Ltd., INEOS Calabrian Corp., Santa Cruz Biotechnology, among
others.
For more Chemicals and Materials Market
reports - Please click here
Table 1: Sodium Metabisulfite Market Overview 2021-2026
Table 2: Sodium Metabisulfite Market Leader Analysis 2018-2019 (US$)
Table 3: Sodium Metabisulfite Market Product Analysis 2018-2019 (US$)
Table 4: Sodium Metabisulfite Market End User Analysis 2018-2019 (US$)
Table 5: Sodium Metabisulfite Market Patent Analysis 2013-2018* (US$)
Table 6: Sodium Metabisulfite Market Financial Analysis 2018-2019 (US$)
Table 7: Sodium Metabisulfite Market Driver Analysis 2018-2019 (US$)
Table 8: Sodium Metabisulfite Market Challenges Analysis 2018-2019 (US$)
Table 9: Sodium Metabisulfite Market Constraint Analysis 2018-2019 (US$)
Table 10: Sodium Metabisulfite Market Supplier Bargaining Power Analysis 2018-2019 (US$)
Table 11: Sodium Metabisulfite Market Buyer Bargaining Power Analysis 2018-2019 (US$)
Table 12: Sodium Metabisulfite Market Threat of Substitutes Analysis 2018-2019 (US$)
Table 13: Sodium Metabisulfite Market Threat of New Entrants Analysis 2018-2019 (US$)
Table 14: Sodium Metabisulfite Market Degree of Competition Analysis 2018-2019 (US$)
Table 15: Sodium Metabisulfite Market Value Chain Analysis 2018-2019 (US$)
Table 16: Sodium Metabisulfite Market Pricing Analysis 2021-2026 (US$)
Table 17: Sodium Metabisulfite Market Opportunities Analysis 2021-2026 (US$)
Table 18: Sodium Metabisulfite Market Product Life Cycle Analysis 2021-2026 (US$)
Table 19: Sodium Metabisulfite Market Supplier Analysis 2018-2019 (US$)
Table 20: Sodium Metabisulfite Market Distributor Analysis 2018-2019 (US$)
Table 21: Sodium Metabisulfite Market Trend Analysis 2018-2019 (US$)
Table 22: Sodium Metabisulfite Market Size 2018 (US$)
Table 23: Sodium Metabisulfite Market Forecast Analysis 2021-2026 (US$)
Table 24: Sodium Metabisulfite Market Sales Forecast Analysis 2021-2026 (Units)
Table 25: Sodium Metabisulfite Market, Revenue & Volume, By Grade, 2021-2026 ($)
Table 26: Sodium Metabisulfite Market By Grade, Revenue & Volume, By Food Grade, 2021-2026 ($)
Table 27: Sodium Metabisulfite Market By Grade, Revenue & Volume, By Non Food Grade, 2021-2026 ($)
Table 28: Sodium Metabisulfite Market By Grade, Revenue & Volume, By Photo Grade, 2021-2026 ($)
Table 29: Sodium Metabisulfite Market, Revenue & Volume, By End Use Industry, 2021-2026 ($)
Table 30: Sodium Metabisulfite Market By End Use Industry, Revenue & Volume, By Food and beverages industry, 2021-2026 ($)
Table 31: Sodium Metabisulfite Market By End Use Industry, Revenue & Volume, By Pharmaceutical, 2021-2026 ($)
Table 32: Sodium Metabisulfite Market By End Use Industry, Revenue & Volume, By Water treatment, 2021-2026 ($)
Table 33: Sodium Metabisulfite Market By End Use Industry, Revenue & Volume, By Paper and pulp industry, 2021-2026 ($)
Table 34: Sodium Metabisulfite Market By End Use Industry, Revenue & Volume, By Photographic and film industry, 2021-2026 ($)
Table 35: North America Sodium Metabisulfite Market, Revenue & Volume, By Grade, 2021-2026 ($)
Table 36: North America Sodium Metabisulfite Market, Revenue & Volume, By End Use Industry, 2021-2026 ($)
Table 37: South america Sodium Metabisulfite Market, Revenue & Volume, By Grade, 2021-2026 ($)
Table 38: South america Sodium Metabisulfite Market, Revenue & Volume, By End Use Industry, 2021-2026 ($)
Table 39: Europe Sodium Metabisulfite Market, Revenue & Volume, By Grade, 2021-2026 ($)
Table 40: Europe Sodium Metabisulfite Market, Revenue & Volume, By End Use Industry, 2021-2026 ($)
Table 41: APAC Sodium Metabisulfite Market, Revenue & Volume, By Grade, 2021-2026 ($)
Table 42: APAC Sodium Metabisulfite Market, Revenue & Volume, By End Use Industry, 2021-2026 ($)
Table 43: Middle East & Africa Sodium Metabisulfite Market, Revenue & Volume, By Grade, 2021-2026 ($)
Table 44: Middle East & Africa Sodium Metabisulfite Market, Revenue & Volume, By End Use Industry, 2021-2026 ($)
Table 45: Russia Sodium Metabisulfite Market, Revenue & Volume, By Grade, 2021-2026 ($)
Table 46: Russia Sodium Metabisulfite Market, Revenue & Volume, By End Use Industry, 2021-2026 ($)
Table 47: Israel Sodium Metabisulfite Market, Revenue & Volume, By Grade, 2021-2026 ($)
Table 48: Israel Sodium Metabisulfite Market, Revenue & Volume, By End Use Industry, 2021-2026 ($)
Table 49: Top Companies 2018 (US$) Sodium Metabisulfite Market, Revenue & Volume
Table 50: Product Launch 2018-2019 Sodium Metabisulfite Market, Revenue & Volume
Table 51: Mergers & Acquistions 2018-2019 Sodium Metabisulfite Market, Revenue & Volume
List of Figures:
Figure 1: Overview of Sodium Metabisulfite Market 2021-2026
Figure 2: Market Share Analysis for Sodium Metabisulfite Market 2018 (US$)
Figure 3: Product Comparison in Sodium Metabisulfite Market 2018-2019 (US$)
Figure 4: End User Profile for Sodium Metabisulfite Market 2018-2019 (US$)
Figure 5: Patent Application and Grant in Sodium Metabisulfite Market 2013-2018* (US$)
Figure 6: Top 5 Companies Financial Analysis in Sodium Metabisulfite Market 2018-2019 (US$)
Figure 7: Market Entry Strategy in Sodium Metabisulfite Market 2018-2019
Figure 8: Ecosystem Analysis in Sodium Metabisulfite Market 2018
Figure 9: Average Selling Price in Sodium Metabisulfite Market 2021-2026
Figure 10: Top Opportunites in Sodium Metabisulfite Market 2018-2019
Figure 11: Market Life Cycle Analysis in Sodium Metabisulfite Market
Figure 12: GlobalBy Grade Sodium Metabisulfite Market Revenue, 2021-2026 ($)
Figure 13: GlobalBy End Use Industry Sodium Metabisulfite Market Revenue, 2021-2026 ($)
Figure 14: Global Sodium Metabisulfite Market - By Geography
Figure 15: Global Sodium Metabisulfite Market Value & Volume, By Geography, 2021-2026 ($)
Figure 16: Global Sodium Metabisulfite Market CAGR, By Geography, 2021-2026 (%)
Figure 17: North America Sodium Metabisulfite Market Value & Volume, 2021-2026 ($)
Figure 18: US Sodium Metabisulfite Market Value & Volume, 2021-2026 ($)
Figure 19: US GDP and Population, 2018-2019 ($)
Figure 20: US GDP – Composition of 2018, By Sector of Origin
Figure 21: US Export and Import Value & Volume, 2018-2019 ($)
Figure 22: Canada Sodium Metabisulfite Market Value & Volume, 2021-2026 ($)
Figure 23: Canada GDP and Population, 2018-2019 ($)
Figure 24: Canada GDP – Composition of 2018, By Sector of Origin
Figure 25: Canada Export and Import Value & Volume, 2018-2019 ($)
Figure 26: Mexico Sodium Metabisulfite Market Value & Volume, 2021-2026 ($)
Figure 27: Mexico GDP and Population, 2018-2019 ($)
Figure 28: Mexico GDP – Composition of 2018, By Sector of Origin
Figure 29: Mexico Export and Import Value & Volume, 2018-2019 ($)
Figure 30: South America Sodium Metabisulfite Market Value & Volume, 2021-2026 ($)
Figure 31: Brazil Sodium Metabisulfite Market Value & Volume, 2021-2026 ($)
Figure 32: Brazil GDP and Population, 2018-2019 ($)
Figure 33: Brazil GDP – Composition of 2018, By Sector of Origin
Figure 34: Brazil Export and Import Value & Volume, 2018-2019 ($)
Figure 35: Venezuela Sodium Metabisulfite Market Value & Volume, 2021-2026 ($)
Figure 36: Venezuela GDP and Population, 2018-2019 ($)
Figure 37: Venezuela GDP – Composition of 2018, By Sector of Origin
Figure 38: Venezuela Export and Import Value & Volume, 2018-2019 ($)
Figure 39: Argentina Sodium Metabisulfite Market Value & Volume, 2021-2026 ($)
Figure 40: Argentina GDP and Population, 2018-2019 ($)
Figure 41: Argentina GDP – Composition of 2018, By Sector of Origin
Figure 42: Argentina Export and Import Value & Volume, 2018-2019 ($)
Figure 43: Ecuador Sodium Metabisulfite Market Value & Volume, 2021-2026 ($)
Figure 44: Ecuador GDP and Population, 2018-2019 ($)
Figure 45: Ecuador GDP – Composition of 2018, By Sector of Origin
Figure 46: Ecuador Export and Import Value & Volume, 2018-2019 ($)
Figure 47: Peru Sodium Metabisulfite Market Value & Volume, 2021-2026 ($)
Figure 48: Peru GDP and Population, 2018-2019 ($)
Figure 49: Peru GDP – Composition of 2018, By Sector of Origin
Figure 50: Peru Export and Import Value & Volume, 2018-2019 ($)
Figure 51: Colombia Sodium Metabisulfite Market Value & Volume, 2021-2026 ($)
Figure 52: Colombia GDP and Population, 2018-2019 ($)
Figure 53: Colombia GDP – Composition of 2018, By Sector of Origin
Figure 54: Colombia Export and Import Value & Volume, 2018-2019 ($)
Figure 55: Costa Rica Sodium Metabisulfite Market Value & Volume, 2021-2026 ($)
Figure 56: Costa Rica GDP and Population, 2018-2019 ($)
Figure 57: Costa Rica GDP – Composition of 2018, By Sector of Origin
Figure 58: Costa Rica Export and Import Value & Volume, 2018-2019 ($)
Figure 59: Europe Sodium Metabisulfite Market Value & Volume, 2021-2026 ($)
Figure 60: U.K Sodium Metabisulfite Market Value & Volume, 2021-2026 ($)
Figure 61: U.K GDP and Population, 2018-2019 ($)
Figure 62: U.K GDP – Composition of 2018, By Sector of Origin
Figure 63: U.K Export and Import Value & Volume, 2018-2019 ($)
Figure 64: Germany Sodium Metabisulfite Market Value & Volume, 2021-2026 ($)
Figure 65: Germany GDP and Population, 2018-2019 ($)
Figure 66: Germany GDP – Composition of 2018, By Sector of Origin
Figure 67: Germany Export and Import Value & Volume, 2018-2019 ($)
Figure 68: Italy Sodium Metabisulfite Market Value & Volume, 2021-2026 ($)
Figure 69: Italy GDP and Population, 2018-2019 ($)
Figure 70: Italy GDP – Composition of 2018, By Sector of Origin
Figure 71: Italy Export and Import Value & Volume, 2018-2019 ($)
Figure 72: France Sodium Metabisulfite Market Value & Volume, 2021-2026 ($)
Figure 73: France GDP and Population, 2018-2019 ($)
Figure 74: France GDP – Composition of 2018, By Sector of Origin
Figure 75: France Export and Import Value & Volume, 2018-2019 ($)
Figure 76: Netherlands Sodium Metabisulfite Market Value & Volume, 2021-2026 ($)
Figure 77: Netherlands GDP and Population, 2018-2019 ($)
Figure 78: Netherlands GDP – Composition of 2018, By Sector of Origin
Figure 79: Netherlands Export and Import Value & Volume, 2018-2019 ($)
Figure 80: Belgium Sodium Metabisulfite Market Value & Volume, 2021-2026 ($)
Figure 81: Belgium GDP and Population, 2018-2019 ($)
Figure 82: Belgium GDP – Composition of 2018, By Sector of Origin
Figure 83: Belgium Export and Import Value & Volume, 2018-2019 ($)
Figure 84: Spain Sodium Metabisulfite Market Value & Volume, 2021-2026 ($)
Figure 85: Spain GDP and Population, 2018-2019 ($)
Figure 86: Spain GDP – Composition of 2018, By Sector of Origin
Figure 87: Spain Export and Import Value & Volume, 2018-2019 ($)
Figure 88: Denmark Sodium Metabisulfite Market Value & Volume, 2021-2026 ($)
Figure 89: Denmark GDP and Population, 2018-2019 ($)
Figure 90: Denmark GDP – Composition of 2018, By Sector of Origin
Figure 91: Denmark Export and Import Value & Volume, 2018-2019 ($)
Figure 92: APAC Sodium Metabisulfite Market Value & Volume, 2021-2026 ($)
Figure 93: China Sodium Metabisulfite Market Value & Volume, 2021-2026
Figure 94: China GDP and Population, 2018-2019 ($)
Figure 95: China GDP – Composition of 2018, By Sector of Origin
Figure 96: China Export and Import Value & Volume, 2018-2019 ($) Sodium Metabisulfite Market China Export and Import Value & Volume, 2018-2019 ($)
Figure 97: Australia Sodium Metabisulfite Market Value & Volume, 2021-2026 ($)
Figure 98: Australia GDP and Population, 2018-2019 ($)
Figure 99: Australia GDP – Composition of 2018, By Sector of Origin
Figure 100: Australia Export and Import Value & Volume, 2018-2019 ($)
Figure 101: South Korea Sodium Metabisulfite Market Value & Volume, 2021-2026 ($)
Figure 102: South Korea GDP and Population, 2018-2019 ($)
Figure 103: South Korea GDP – Composition of 2018, By Sector of Origin
Figure 104: South Korea Export and Import Value & Volume, 2018-2019 ($)
Figure 105: India Sodium Metabisulfite Market Value & Volume, 2021-2026 ($)
Figure 106: India GDP and Population, 2018-2019 ($)
Figure 107: India GDP – Composition of 2018, By Sector of Origin
Figure 108: India Export and Import Value & Volume, 2018-2019 ($)
Figure 109: Taiwan Sodium Metabisulfite Market Value & Volume, 2021-2026 ($)
Figure 110: Taiwan GDP and Population, 2018-2019 ($)
Figure 111: Taiwan GDP – Composition of 2018, By Sector of Origin
Figure 112: Taiwan Export and Import Value & Volume, 2018-2019 ($)
Figure 113: Malaysia Sodium Metabisulfite Market Value & Volume, 2021-2026 ($)
Figure 114: Malaysia GDP and Population, 2018-2019 ($)
Figure 115: Malaysia GDP – Composition of 2018, By Sector of Origin
Figure 116: Malaysia Export and Import Value & Volume, 2018-2019 ($)
Figure 117: Hong Kong Sodium Metabisulfite Market Value & Volume, 2021-2026 ($)
Figure 118: Hong Kong GDP and Population, 2018-2019 ($)
Figure 119: Hong Kong GDP – Composition of 2018, By Sector of Origin
Figure 120: Hong Kong Export and Import Value & Volume, 2018-2019 ($)
Figure 121: Middle East & Africa Sodium Metabisulfite Market Middle East & Africa 3D Printing Market Value & Volume, 2021-2026 ($)
Figure 122: Russia Sodium Metabisulfite Market Value & Volume, 2021-2026 ($)
Figure 123: Russia GDP and Population, 2018-2019 ($)
Figure 124: Russia GDP – Composition of 2018, By Sector of Origin
Figure 125: Russia Export and Import Value & Volume, 2018-2019 ($)
Figure 126: Israel Sodium Metabisulfite Market Value & Volume, 2021-2026 ($)
Figure 127: Israel GDP and Population, 2018-2019 ($)
Figure 128: Israel GDP – Composition of 2018, By Sector of Origin
Figure 129: Israel Export and Import Value & Volume, 2018-2019 ($)
Figure 130: Entropy Share, By Strategies, 2018-2019* (%) Sodium Metabisulfite Market
Figure 131: Developments, 2018-2019* Sodium Metabisulfite Market
Figure 132: Company 1 Sodium Metabisulfite Market Net Revenue, By Years, 2018-2019* ($)
Figure 133: Company 1 Sodium Metabisulfite Market Net Revenue Share, By Business segments, 2018 (%)
Figure 134: Company 1 Sodium Metabisulfite Market Net Sales Share, By Geography, 2018 (%)
Figure 135: Company 2 Sodium Metabisulfite Market Net Revenue, By Years, 2018-2019* ($)
Figure 136: Company 2 Sodium Metabisulfite Market Net Revenue Share, By Business segments, 2018 (%)
Figure 137: Company 2 Sodium Metabisulfite Market Net Sales Share, By Geography, 2018 (%)
Figure 138: Company 3 Sodium Metabisulfite Market Net Revenue, By Years, 2018-2019* ($)
Figure 139: Company 3 Sodium Metabisulfite Market Net Revenue Share, By Business segments, 2018 (%)
Figure 140: Company 3 Sodium Metabisulfite Market Net Sales Share, By Geography, 2018 (%)
Figure 141: Company 4 Sodium Metabisulfite Market Net Revenue, By Years, 2018-2019* ($)
Figure 142: Company 4 Sodium Metabisulfite Market Net Revenue Share, By Business segments, 2018 (%)
Figure 143: Company 4 Sodium Metabisulfite Market Net Sales Share, By Geography, 2018 (%)
Figure 144: Company 5 Sodium Metabisulfite Market Net Revenue, By Years, 2018-2019* ($)
Figure 145: Company 5 Sodium Metabisulfite Market Net Revenue Share, By Business segments, 2018 (%)
Figure 146: Company 5 Sodium Metabisulfite Market Net Sales Share, By Geography, 2018 (%)
Figure 147: Company 6 Sodium Metabisulfite Market Net Revenue, By Years, 2018-2019* ($)
Figure 148: Company 6 Sodium Metabisulfite Market Net Revenue Share, By Business segments, 2018 (%)
Figure 149: Company 6 Sodium Metabisulfite Market Net Sales Share, By Geography, 2018 (%)
Figure 150: Company 7 Sodium Metabisulfite Market Net Revenue, By Years, 2018-2019* ($)
Figure 151: Company 7 Sodium Metabisulfite Market Net Revenue Share, By Business segments, 2018 (%)
Figure 152: Company 7 Sodium Metabisulfite Market Net Sales Share, By Geography, 2018 (%)
Figure 153: Company 8 Sodium Metabisulfite Market Net Revenue, By Years, 2018-2019* ($)
Figure 154: Company 8 Sodium Metabisulfite Market Net Revenue Share, By Business segments, 2018 (%)
Figure 155: Company 8 Sodium Metabisulfite Market Net Sales Share, By Geography, 2018 (%)
Figure 156: Company 9 Sodium Metabisulfite Market Net Revenue, By Years, 2018-2019* ($)
Figure 157: Company 9 Sodium Metabisulfite Market Net Revenue Share, By Business segments, 2018 (%)
Figure 158: Company 9 Sodium Metabisulfite Market Net Sales Share, By Geography, 2018 (%)
Figure 159: Company 10 Sodium Metabisulfite Market Net Revenue, By Years, 2018-2019* ($)
Figure 160: Company 10 Sodium Metabisulfite Market Net Revenue Share, By Business segments, 2018 (%)
Figure 161: Company 10 Sodium Metabisulfite Market Net Sales Share, By Geography, 2018 (%)
Figure 162: Company 11 Sodium Metabisulfite Market Net Revenue, By Years, 2018-2019* ($)
Figure 163: Company 11 Sodium Metabisulfite Market Net Revenue Share, By Business segments, 2018 (%)
Figure 164: Company 11 Sodium Metabisulfite Market Net Sales Share, By Geography, 2018 (%)
Figure 165: Company 12 Sodium Metabisulfite Market Net Revenue, By Years, 2018-2019* ($)
Figure 166: Company 12 Sodium Metabisulfite Market Net Revenue Share, By Business segments, 2018 (%)
Figure 167: Company 12 Sodium Metabisulfite Market Net Sales Share, By Geography, 2018 (%)
Figure 168: Company 13 Sodium Metabisulfite Market Net Revenue, By Years, 2018-2019* ($)
Figure 169: Company 13 Sodium Metabisulfite Market Net Revenue Share, By Business segments, 2018 (%)
Figure 170: Company 13 Sodium Metabisulfite Market Net Sales Share, By Geography, 2018 (%)
Figure 171: Company 14 Sodium Metabisulfite Market Net Revenue, By Years, 2018-2019* ($)
Figure 172: Company 14 Sodium Metabisulfite Market Net Revenue Share, By Business segments, 2018 (%)
Figure 173: Company 14 Sodium Metabisulfite Market Net Sales Share, By Geography, 2018 (%)
Figure 174: Company 15 Sodium Metabisulfite Market Net Revenue, By Years, 2018-2019* ($)
Figure 175: Company 15 Sodium Metabisulfite Market Net Revenue Share, By Business segments, 2018 (%)
Figure 176: Company 15 Sodium Metabisulfite Market Net Sales Share, By Geography, 2018 (%)