 Email
Email Print
Print


Time of Flight Camera Market - Forecast(2024 - 2030)
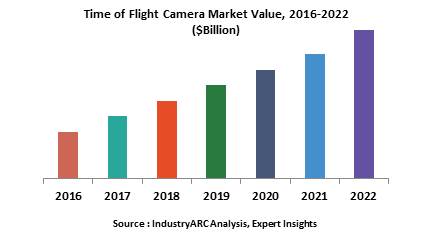
A time-of-flight camera, also commonly called as ToF camera, is a camera system used for range imaging applications which help in resolving distance based problems based on the known speed of light, measuring the time-of-flight of a light signal between the camera and the subject for each point of the image. The time-of-flight camera is a class of scannerless Light Detection and Ranging (LiDAR), which works on the principle of capturing the entire scene with each laser or light pulse, as opposed to point-by-point with a laser beam such as in scanning LiDAR systems. Globally, increasing trends of using digitised content for various industries is expected to remain one of the key growth drivers for ToF camera during the period of study.
Geographically, North America dominated the time of flight camera market driven by increasing usage and development of digitized content for various end-use industries in the region. North America was followed by Europe and Asia-Pacific as second and third largest market for time of flight camera market. Asia Pacific is projected to have the fastest growth, owing to a rapidly growing technological usage in the region, expanding industrial base and growing presence of major end-use industries in developing nations such as China and India in this region.
This report identifies the time of flight camera market size for the years 2014-2016, and forecast of the same till the year 2022. It also highlights the market drivers, restraints, growth indicators, challenges, and other key aspects with respect to the time of flight camera market.
This report segments the time of flight camera market on the basis of type, application and regional market as follows:
Sample Companies profiled in this Report are:
Geographically, North America dominated the time of flight camera market driven by increasing usage and development of digitized content for various end-use industries in the region. North America was followed by Europe and Asia-Pacific as second and third largest market for time of flight camera market. Asia Pacific is projected to have the fastest growth, owing to a rapidly growing technological usage in the region, expanding industrial base and growing presence of major end-use industries in developing nations such as China and India in this region.
This report identifies the time of flight camera market size for the years 2014-2016, and forecast of the same till the year 2022. It also highlights the market drivers, restraints, growth indicators, challenges, and other key aspects with respect to the time of flight camera market.
This report segments the time of flight camera market on the basis of type, application and regional market as follows:
- Time of flight camera market research report is classified on the basis of type. Some of the major types covered in this report are as follows: RF-modulated light sources with phase detectors, Range gated imagers, Direct Time-of-Flight imagers
- Time of flight camera market research report is classified on the basis of application. Some of the major applications covered in this report are as follows: Automotive, Human Interference & Gaming, Measurement & machine vision, Robotics, Earth Topography
- This report has been further segmented into major regions, which includes detailed analysis of each region such as: North America, Europe, Asia-Pacific (APAC), and Rest of the World (RoW) covering all the major country level markets in each of the region
Sample Companies profiled in this Report are:
- Advanced Scientific Concepts, Inc.
- PMD Technologies
- SoftKinetic
- Panasonic
- iris-GmbH
- 10+.
1. Time of Flight Camera Market - Overview
1.1. Definitions and Scope
2. Time of Flight Camera Market - Executive summary
2.1. Market Revenue, Market Size and Key Trends by Company
2.2. Key Trends by type of Application
2.3. Key Trends segmented by Geography
3. Time of Flight Camera Market
3.1. Comparative analysis
3.1.1. Product Benchmarking - Top 10 companies
3.1.2. Top 5 Financials Analysis
3.1.3. Market Value split by Top 10 companies
3.1.4. Patent Analysis - Top 10 companies
3.1.5. Pricing Analysis
4. Time of Flight Camera Market – Startup companies Scenario Premium
4.1. Top 10 startup company Analysis by
4.1.1. Investment
4.1.2. Revenue
4.1.3. Market Shares
4.1.4. Market Size and Application Analysis
4.1.5. Venture Capital and Funding Scenario
5. Time of Flight Camera Market – Industry Market Entry Scenario Premium
5.1. Regulatory Framework Overview
5.2. New Business and Ease of Doing business index
5.3. Case studies of successful ventures
5.4. Customer Analysis – Top 10 companies
6. Time of Flight Camera Market Forces
6.1. Drivers
6.2. Constraints
6.3. Challenges
6.4. Porters five force model
6.4.1. Bargaining power of suppliers
6.4.2. Bargaining powers of customers
6.4.3. Threat of new entrants
6.4.4. Rivalry among existing players
6.4.5. Threat of substitutes
7. Time of Flight Camera Market -Strategic analysis
7.1. Value chain analysis
7.2. Opportunities analysis
7.3. Product life cycle
7.4. Suppliers and distributors Market Share
8. Time of Flight Camera Market – By Type (Market Size -$Million / $Billion)
8.1. Market Size and Market Share Analysis
8.2. Application Revenue and Trend Research
8.3. Product Segment Analysis
8.3.1. RF-modulated light sources with phase detectors
8.3.2. Range gated imagers
8.3.3. Direct Time-of-Flight imagers
9. Time of Flight Camera Market – By Application (Market Size -$Million / $Billion)
9.1. Automotive
9.2. Human Interference & Gaming
9.3. Measurement & machine vision
9.4. Robotics
9.5. Earth Topography
10. Time of Flight Camera - By Geography (Market Size -$Million / $Billion)
10.1. Time of Flight Camera Market - North America Segment Research
10.2. North America Market Research (Million / $Billion)
10.2.1. Segment type Size and Market Size Analysis
10.2.2. Revenue and Trends
10.2.3. Application Revenue and Trends by type of Application
10.2.4. Company Revenue and Product Analysis
10.2.5. North America Product type and Application Market Size
10.2.5.1. U.S.
10.2.5.2. Canada
10.2.5.3. Mexico
10.2.5.4. Rest of North America
10.3. Time of Flight Camera - South America Segment Research
10.4. South America Market Research (Market Size -$Million / $Billion)
10.4.1. Segment type Size and Market Size Analysis
10.4.2. Revenue and Trends
10.4.3. Application Revenue and Trends by type of Application
10.4.4. Company Revenue and Product Analysis
10.4.5. South America Product type and Application Market Size
10.4.5.1. Brazil
10.4.5.2. Venezuela
10.4.5.3. Argentina
10.4.5.4. Ecuador
10.4.5.5. Peru
10.4.5.6. Colombia
10.4.5.7. Costa Rica
10.4.5.8. Rest of South America
10.5. Time of Flight Camera - Europe Segment Research
10.6. Europe Market Research (Market Size -$Million / $Billion)
10.6.1. Segment type Size and Market Size Analysis
10.6.2. Revenue and Trends
10.6.3. Application Revenue and Trends by type of Application
10.6.4. Company Revenue and Product Analysis
10.6.5. Europe Segment Product type and Application Market Size
10.6.5.1. U.K
10.6.5.2. Germany
10.6.5.3. Italy
10.6.5.4. France
10.6.5.5. Netherlands
10.6.5.6. Belgium
10.6.5.7. Spain
10.6.5.8. Denmark
10.6.5.9. Rest of Europe
10.7. Time of Flight Camera – APAC Segment Research
10.8. APAC Market Research (Market Size -$Million / $Billion)
10.8.1. Segment type Size and Market Size Analysis
10.8.2. Revenue and Trends
10.8.3. Application Revenue and Trends by type of Application
10.8.4. Company Revenue and Product Analysis
10.8.5. APAC Segment – Product type and Application Market Size
10.8.5.1. China
10.8.5.2. Australia
10.8.5.3. Japan
10.8.5.4. South Korea
10.8.5.5. India
10.8.5.6. Taiwan
10.8.5.7. Malaysia
11. Time of Flight Camera Market - Entropy
11.1. New product launches
11.2. M&A's, collaborations, JVs and partnerships
12. Time of Flight Camera Market – Industry / Segment Competition landscape Premium
12.1. Market Share Analysis
12.1.1. Market Share by Country- Top companies
12.1.2. Market Share by Region- Top 10 companies
12.1.3. Market Share by type of Application – Top 10 companies
12.1.4. Market Share by type of Product / Product category- Top 10 companies
12.1.5. Market Share at global level- Top 10 companies
12.1.6. Best Practises for companies
13. Time of Flight Camera Market – Key Company List by Country Premium
14. Time of Flight Camera Market Company Analysis
14.1. Market Share, Company Revenue, Products, M&A, Developments
14.2. Advanced Scientific Concepts, Inc.
14.3. PMD Technologies
14.4. SoftKinetic
14.5. Panasonic
14.6. iris-GmbH
14.7. Siemens
14.8. Stanley Electric
14.9. Canesta (Acquired by Microsoft)
14.10. odos imaging
14.11. Company 10
14.12. Company 11
14.13. Company 12 and more
"*Financials would be provided on a best efforts basis for private companies"
15. Time of Flight Camera Market -Appendix
15.1. Abbreviations
15.2. Sources
16. Time of Flight Camera Market -Methodology Premium
16.1. Research Methodology
16.1.1. Company Expert Interviews
16.1.2. Industry Databases
16.1.3. Associations
16.1.4. Company News
16.1.5. Company Annual Reports
16.1.6. Application Trends
16.1.7. New Products and Product database
16.1.8. Company Transcripts
16.1.9. R&D Trends
16.1.10. Key Opinion Leaders Interviews
16.1.11. Supply and Demand Trends
List of Tables
Table 1: Time of Flight Camera Market Overview 2021-2026
Table 2: Time of Flight Camera Market Leader Analysis 2018-2019 (US$)
Table 3: Time of Flight Camera MarketProduct Analysis 2018-2019 (US$)
Table 4: Time of Flight Camera MarketEnd User Analysis 2018-2019 (US$)
Table 5: Time of Flight Camera MarketPatent Analysis 2013-2018* (US$)
Table 6: Time of Flight Camera MarketFinancial Analysis 2018-2019 (US$)
Table 7: Time of Flight Camera Market Driver Analysis 2018-2019 (US$)
Table 8: Time of Flight Camera MarketChallenges Analysis 2018-2019 (US$)
Table 9: Time of Flight Camera MarketConstraint Analysis 2018-2019 (US$)
Table 10: Time of Flight Camera Market Supplier Bargaining Power Analysis 2018-2019 (US$)
Table 11: Time of Flight Camera Market Buyer Bargaining Power Analysis 2018-2019 (US$)
Table 12: Time of Flight Camera Market Threat of Substitutes Analysis 2018-2019 (US$)
Table 13: Time of Flight Camera Market Threat of New Entrants Analysis 2018-2019 (US$)
Table 14: Time of Flight Camera Market Degree of Competition Analysis 2018-2019 (US$)
Table 15: Time of Flight Camera MarketValue Chain Analysis 2018-2019 (US$)
Table 16: Time of Flight Camera MarketPricing Analysis 2021-2026 (US$)
Table 17: Time of Flight Camera MarketOpportunities Analysis 2021-2026 (US$)
Table 18: Time of Flight Camera MarketProduct Life Cycle Analysis 2021-2026 (US$)
Table 19: Time of Flight Camera MarketSupplier Analysis 2018-2019 (US$)
Table 20: Time of Flight Camera MarketDistributor Analysis 2018-2019 (US$)
Table 21: Time of Flight Camera Market Trend Analysis 2018-2019 (US$)
Table 22: Time of Flight Camera Market Size 2018 (US$)
Table 23: Time of Flight Camera Market Forecast Analysis 2021-2026 (US$)
Table 24: Time of Flight Camera Market Sales Forecast Analysis 2021-2026 (Units)
Table 25: Time of Flight Camera Market, Revenue & Volume,By Type, 2021-2026 ($)
Table 26: Time of Flight Camera MarketBy Type, Revenue & Volume,By RF-modulated light sources with phase detectors, 2021-2026 ($)
Table 27: Time of Flight Camera MarketBy Type, Revenue & Volume,By Range gated imagers, 2021-2026 ($)
Table 28: Time of Flight Camera MarketBy Type, Revenue & Volume,By Direct Time-of-Flight imagers, 2021-2026 ($)
Table 29: Time of Flight Camera Market, Revenue & Volume,By Application, 2021-2026 ($)
Table 30: Time of Flight Camera MarketBy Application, Revenue & Volume,By Automotive, 2021-2026 ($)
Table 31: Time of Flight Camera MarketBy Application, Revenue & Volume,By Human Interference & Gaming, 2021-2026 ($)
Table 32: Time of Flight Camera MarketBy Application, Revenue & Volume,By Measurement & machine vision, 2021-2026 ($)
Table 33: Time of Flight Camera MarketBy Application, Revenue & Volume,By Robotics, 2021-2026 ($)
Table 34: Time of Flight Camera MarketBy Application, Revenue & Volume,By Earth Topography, 2021-2026 ($)
Table 35: North America Time of Flight Camera Market, Revenue & Volume,By Type, 2021-2026 ($)
Table 36: North America Time of Flight Camera Market, Revenue & Volume,By Application, 2021-2026 ($)
Table 37: South america Time of Flight Camera Market, Revenue & Volume,By Type, 2021-2026 ($)
Table 38: South america Time of Flight Camera Market, Revenue & Volume,By Application, 2021-2026 ($)
Table 39: Europe Time of Flight Camera Market, Revenue & Volume,By Type, 2021-2026 ($)
Table 40: Europe Time of Flight Camera Market, Revenue & Volume,By Application, 2021-2026 ($)
Table 41: APAC Time of Flight Camera Market, Revenue & Volume,By Type, 2021-2026 ($)
Table 42: APAC Time of Flight Camera Market, Revenue & Volume,By Application, 2021-2026 ($)
Table 43: Middle East & Africa Time of Flight Camera Market, Revenue & Volume,By Type, 2021-2026 ($)
Table 44: Middle East & Africa Time of Flight Camera Market, Revenue & Volume,By Application, 2021-2026 ($)
Table 45: Russia Time of Flight Camera Market, Revenue & Volume,By Type, 2021-2026 ($)
Table 46: Russia Time of Flight Camera Market, Revenue & Volume,By Application, 2021-2026 ($)
Table 47: Israel Time of Flight Camera Market, Revenue & Volume,By Type, 2021-2026 ($)
Table 48: Israel Time of Flight Camera Market, Revenue & Volume,By Application, 2021-2026 ($)
Table 49: Top Companies 2018 (US$)Time of Flight Camera Market, Revenue & Volume,,
Table 50: Product Launch 2018-2019Time of Flight Camera Market, Revenue & Volume,,
Table 51: Mergers & Acquistions 2018-2019Time of Flight Camera Market, Revenue & Volume,,
List of Figures
Figure 1: Overview of Time of Flight Camera Market 2021-2026
Figure 2: Market Share Analysis for Time of Flight Camera Market 2018 (US$)
Figure 3: Product Comparison in Time of Flight Camera Market 2018-2019 (US$)
Figure 4: End User Profile for Time of Flight Camera Market 2018-2019 (US$)
Figure 5: Patent Application and Grant in Time of Flight Camera Market 2013-2018* (US$)
Figure 6: Top 5 Companies Financial Analysis in Time of Flight Camera Market 2018-2019 (US$)
Figure 7: Market Entry Strategy in Time of Flight Camera Market 2018-2019
Figure 8: Ecosystem Analysis in Time of Flight Camera Market2018
Figure 9: Average Selling Price in Time of Flight Camera Market 2021-2026
Figure 10: Top Opportunites in Time of Flight Camera Market 2018-2019
Figure 11: Market Life Cycle Analysis in Time of Flight Camera Market
Figure 12: GlobalBy TypeTime of Flight Camera Market Revenue, 2021-2026 ($)
Figure 13: GlobalBy ApplicationTime of Flight Camera Market Revenue, 2021-2026 ($)
Figure 14: Global Time of Flight Camera Market - By Geography
Figure 15: Global Time of Flight Camera Market Value & Volume, By Geography, 2021-2026 ($)Â
Figure 16: Global Time of Flight Camera Market CAGR, By Geography, 2021-2026 (%)
Figure 17: North America Time of Flight Camera Market Value & Volume, 2021-2026 ($)
Figure 18: US Time of Flight Camera Market Value & Volume, 2021-2026 ($)
Figure 19: US GDP and Population, 2018-2019 ($)
Figure 20: US GDP – Composition of 2018, By Sector of Origin
Figure 21: US Export and Import Value & Volume, 2018-2019 ($)
Figure 22: Canada Time of Flight Camera Market Value & Volume, 2021-2026 ($)
Figure 23: Canada GDP and Population, 2018-2019 ($)
Figure 24: Canada GDP – Composition of 2018, By Sector of Origin
Figure 25: Canada Export and Import Value & Volume, 2018-2019 ($)
Figure 26: Mexico Time of Flight Camera Market Value & Volume, 2021-2026 ($)
Figure 27: Mexico GDP and Population, 2018-2019 ($)
Figure 28: Mexico GDP – Composition of 2018, By Sector of Origin
Figure 29: Mexico Export and Import Value & Volume, 2018-2019 ($)
Figure 30: South America Time of Flight Camera MarketValue & Volume, 2021-2026 ($)
Figure 31: Brazil Time of Flight Camera Market Value & Volume, 2021-2026 ($)
Figure 32: Brazil GDP and Population, 2018-2019 ($)
Figure 33: Brazil GDP – Composition of 2018, By Sector of Origin
Figure 34: Brazil Export and Import Value & Volume, 2018-2019 ($)
Figure 35: Venezuela Time of Flight Camera Market Value & Volume, 2021-2026 ($)
Figure 36: Venezuela GDP and Population, 2018-2019 ($)
Figure 37: Venezuela GDP – Composition of 2018, By Sector of Origin
Figure 38: Venezuela Export and Import Value & Volume, 2018-2019 ($)
Figure 39: Argentina Time of Flight Camera Market Value & Volume, 2021-2026 ($)
Figure 40: Argentina GDP and Population, 2018-2019 ($)
Figure 41: Argentina GDP – Composition of 2018, By Sector of Origin
Figure 42: Argentina Export and Import Value & Volume, 2018-2019 ($)
Figure 43: Ecuador Time of Flight Camera Market Value & Volume, 2021-2026 ($)
Figure 44: Ecuador GDP and Population, 2018-2019 ($)
Figure 45: Ecuador GDP – Composition of 2018, By Sector of Origin
Figure 46: Ecuador Export and Import Value & Volume, 2018-2019 ($)
Figure 47: Peru Time of Flight Camera Market Value & Volume, 2021-2026 ($)
Figure 48: Peru GDP and Population, 2018-2019 ($)
Figure 49: Peru GDP – Composition of 2018, By Sector of Origin
Figure 50: Peru Export and Import Value & Volume, 2018-2019 ($)
Figure 51: Colombia Time of Flight Camera Market Value & Volume, 2021-2026 ($)
Figure 52: Colombia GDP and Population, 2018-2019 ($)
Figure 53: Colombia GDP – Composition of 2018, By Sector of Origin
Figure 54: Colombia Export and Import Value & Volume, 2018-2019 ($)
Figure 55: Costa Rica Time of Flight Camera Market Value & Volume, 2021-2026 ($)
Figure 56: Costa Rica GDP and Population, 2018-2019 ($)
Figure 57: Costa Rica GDP – Composition of 2018, By Sector of Origin
Figure 58: Costa Rica Export and Import Value & Volume, 2018-2019 ($)
Figure 59: Europe Time of Flight Camera Market Value & Volume, 2021-2026 ($)
Figure 60: U.K Time of Flight Camera Market Value & Volume, 2021-2026 ($)
Figure 61: U.K GDP and Population, 2018-2019 ($)
Figure 62: U.K GDP – Composition of 2018, By Sector of Origin
Figure 63: U.K Export and Import Value & Volume, 2018-2019 ($)
Figure 64: Germany Time of Flight Camera Market Value & Volume, 2021-2026 ($)
Figure 65: Germany GDP and Population, 2018-2019 ($)
Figure 66: Germany GDP – Composition of 2018, By Sector of Origin
Figure 67: Germany Export and Import Value & Volume, 2018-2019 ($)
Figure 68: Italy Time of Flight Camera Market Value & Volume, 2021-2026 ($)
Figure 69: Italy GDP and Population, 2018-2019 ($)
Figure 70: Italy GDP – Composition of 2018, By Sector of Origin
Figure 71: Italy Export and Import Value & Volume, 2018-2019 ($)
Figure 72: France Time of Flight Camera Market Value & Volume, 2021-2026 ($)
Figure 73: France GDP and Population, 2018-2019 ($)
Figure 74: France GDP – Composition of 2018, By Sector of Origin
Figure 75: France Export and Import Value & Volume, 2018-2019 ($)
Figure 76: Netherlands Time of Flight Camera Market Value & Volume, 2021-2026 ($)
Figure 77: Netherlands GDP and Population, 2018-2019 ($)
Figure 78: Netherlands GDP – Composition of 2018, By Sector of Origin
Figure 79: Netherlands Export and Import Value & Volume, 2018-2019 ($)
Figure 80: Belgium Time of Flight Camera Market Value & Volume, 2021-2026 ($)
Figure 81: Belgium GDP and Population, 2018-2019 ($)
Figure 82: Belgium GDP – Composition of 2018, By Sector of Origin
Figure 83: Belgium Export and Import Value & Volume, 2018-2019 ($)
Figure 84: Spain Time of Flight Camera Market Value & Volume, 2021-2026 ($)
Figure 85: Spain GDP and Population, 2018-2019 ($)
Figure 86: Spain GDP – Composition of 2018, By Sector of Origin
Figure 87: Spain Export and Import Value & Volume, 2018-2019 ($)
Figure 88: Denmark Time of Flight Camera Market Value & Volume, 2021-2026 ($)
Figure 89: Denmark GDP and Population, 2018-2019 ($)
Figure 90: Denmark GDP – Composition of 2018, By Sector of Origin
Figure 91: Denmark Export and Import Value & Volume, 2018-2019 ($)
Figure 92: APAC Time of Flight Camera Market Value & Volume, 2021-2026 ($)
Figure 93: China Time of Flight Camera MarketValue & Volume, 2021-2026
Figure 94: China GDP and Population, 2018-2019 ($)
Figure 95: China GDP – Composition of 2018, By Sector of Origin
Figure 96: China Export and Import Value & Volume, 2018-2019 ($)Time of Flight Camera MarketChina Export and Import Value & Volume, 2018-2019 ($)
Figure 97: Australia Time of Flight Camera Market Value & Volume, 2021-2026 ($)
Figure 98: Australia GDP and Population, 2018-2019 ($)
Figure 99: Australia GDP – Composition of 2018, By Sector of Origin
Figure 100: Australia Export and Import Value & Volume, 2018-2019 ($)
Figure 101: South Korea Time of Flight Camera Market Value & Volume, 2021-2026 ($)
Figure 102: South Korea GDP and Population, 2018-2019 ($)
Figure 103: South Korea GDP – Composition of 2018, By Sector of Origin
Figure 104: South Korea Export and Import Value & Volume, 2018-2019 ($)
Figure 105: India Time of Flight Camera Market Value & Volume, 2021-2026 ($)
Figure 106: India GDP and Population, 2018-2019 ($)
Figure 107: India GDP – Composition of 2018, By Sector of Origin
Figure 108: India Export and Import Value & Volume, 2018-2019 ($)
Figure 109: Taiwan Time of Flight Camera Market Value & Volume, 2021-2026 ($)
Figure 110: Taiwan GDP and Population, 2018-2019 ($)
Figure 111: Taiwan GDP – Composition of 2018, By Sector of Origin
Figure 112: Taiwan Export and Import Value & Volume, 2018-2019 ($)
Figure 113: Malaysia Time of Flight Camera Market Value & Volume, 2021-2026 ($)
Figure 114: Malaysia GDP and Population, 2018-2019 ($)
Figure 115: Malaysia GDP – Composition of 2018, By Sector of Origin
Figure 116: Malaysia Export and Import Value & Volume, 2018-2019 ($)
Figure 117: Hong Kong Time of Flight Camera Market Value & Volume, 2021-2026 ($)
Figure 118: Hong Kong GDP and Population, 2018-2019 ($)
Figure 119: Hong Kong GDP – Composition of 2018, By Sector of Origin
Figure 120: Hong Kong Export and Import Value & Volume, 2018-2019 ($)
Figure 121: Middle East & Africa Time of Flight Camera MarketMiddle East & Africa 3D Printing Market Value & Volume, 2021-2026 ($)
Figure 122: Russia Time of Flight Camera Market Value & Volume, 2021-2026 ($)
Figure 123: Russia GDP and Population, 2018-2019 ($)
Figure 124: Russia GDP – Composition of 2018, By Sector of Origin
Figure 125: Russia Export and Import Value & Volume, 2018-2019 ($)
Figure 126: Israel Time of Flight Camera Market Value & Volume, 2021-2026 ($)
Figure 127: Israel GDP and Population, 2018-2019 ($)
Figure 128: Israel GDP – Composition of 2018, By Sector of Origin
Figure 129: Israel Export and Import Value & Volume, 2018-2019 ($)
Figure 130: Entropy Share, By Strategies, 2018-2019* (%)Time of Flight Camera Market
Figure 131: Developments, 2018-2019*Time of Flight Camera Market
Figure 132: Company 1 Time of Flight Camera Market Net Revenue, By Years, 2018-2019* ($)
Figure 133: Company 1 Time of Flight Camera Market Net Revenue Share, By Business segments, 2018 (%)
Figure 134: Company 1 Time of Flight Camera Market Net Sales Share, By Geography, 2018 (%)
Figure 135: Company 2 Time of Flight Camera Market Net Revenue, By Years, 2018-2019* ($)
Figure 136: Company 2 Time of Flight Camera Market Net Revenue Share, By Business segments, 2018 (%)
Figure 137: Company 2 Time of Flight Camera Market Net Sales Share, By Geography, 2018 (%)
Figure 138: Company 3Time of Flight Camera Market Net Revenue, By Years, 2018-2019* ($)
Figure 139: Company 3Time of Flight Camera Market Net Revenue Share, By Business segments, 2018 (%)
Figure 140: Company 3Time of Flight Camera Market Net Sales Share, By Geography, 2018 (%)
Figure 141: Company 4 Time of Flight Camera Market Net Revenue, By Years, 2018-2019* ($)
Figure 142: Company 4 Time of Flight Camera Market Net Revenue Share, By Business segments, 2018 (%)
Figure 143: Company 4 Time of Flight Camera Market Net Sales Share, By Geography, 2018 (%)
Figure 144: Company 5 Time of Flight Camera Market Net Revenue, By Years, 2018-2019* ($)
Figure 145: Company 5 Time of Flight Camera Market Net Revenue Share, By Business segments, 2018 (%)
Figure 146: Company 5 Time of Flight Camera Market Net Sales Share, By Geography, 2018 (%)
Figure 147: Company 6 Time of Flight Camera Market Net Revenue, By Years, 2018-2019* ($)
Figure 148: Company 6 Time of Flight Camera Market Net Revenue Share, By Business segments, 2018 (%)
Figure 149: Company 6 Time of Flight Camera Market Net Sales Share, By Geography, 2018 (%)
Figure 150: Company 7 Time of Flight Camera Market Net Revenue, By Years, 2018-2019* ($)
Figure 151: Company 7 Time of Flight Camera Market Net Revenue Share, By Business segments, 2018 (%)
Figure 152: Company 7 Time of Flight Camera Market Net Sales Share, By Geography, 2018 (%)
Figure 153: Company 8 Time of Flight Camera Market Net Revenue, By Years, 2018-2019* ($)
Figure 154: Company 8 Time of Flight Camera Market Net Revenue Share, By Business segments, 2018 (%)
Figure 155: Company 8 Time of Flight Camera Market Net Sales Share, By Geography, 2018 (%)
Figure 156: Company 9 Time of Flight Camera Market Net Revenue, By Years, 2018-2019* ($)
Figure 157: Company 9 Time of Flight Camera Market Net Revenue Share, By Business segments, 2018 (%)
Figure 158: Company 9 Time of Flight Camera Market Net Sales Share, By Geography, 2018 (%)
Figure 159: Company 10 Time of Flight Camera Market Net Revenue, By Years, 2018-2019* ($)
Figure 160: Company 10 Time of Flight Camera Market Net Revenue Share, By Business segments, 2018 (%)
Figure 161: Company 10 Time of Flight Camera Market Net Sales Share, By Geography, 2018 (%)
Figure 162: Company 11 Time of Flight Camera Market Net Revenue, By Years, 2018-2019* ($)
Figure 163: Company 11 Time of Flight Camera Market Net Revenue Share, By Business segments, 2018 (%)
Figure 164: Company 11 Time of Flight Camera Market Net Sales Share, By Geography, 2018 (%)
Figure 165: Company 12 Time of Flight Camera Market Net Revenue, By Years, 2018-2019* ($)
Figure 166: Company 12 Time of Flight Camera Market Net Revenue Share, By Business segments, 2018 (%)
Figure 167: Company 12 Time of Flight Camera Market Net Sales Share, By Geography, 2018 (%)
Figure 168: Company 13Time of Flight Camera Market Net Revenue, By Years, 2018-2019* ($)
Figure 169: Company 13Time of Flight Camera Market Net Revenue Share, By Business segments, 2018 (%)
Figure 170: Company 13Time of Flight Camera Market Net Sales Share, By Geography, 2018 (%)
Figure 171: Company 14 Time of Flight Camera Market Net Revenue, By Years, 2018-2019* ($)
Figure 172: Company 14 Time of Flight Camera Market Net Revenue Share, By Business segments, 2018 (%)
Figure 173: Company 14 Time of Flight Camera Market Net Sales Share, By Geography, 2018 (%)
Figure 174: Company 15 Time of Flight Camera Market Net Revenue, By Years, 2018-2019* ($)
Figure 175: Company 15 Time of Flight Camera Market Net Revenue Share, By Business segments, 2018 (%)
Figure 176: Company 15 Time of Flight Camera Market Net Sales Share, By Geography, 2018 (%)