 Email
Email Print
Print


Terrestrial Laser Scanning Market - Forecast(2024 - 2030)
Terrestrial Laser Scanning Market Overview
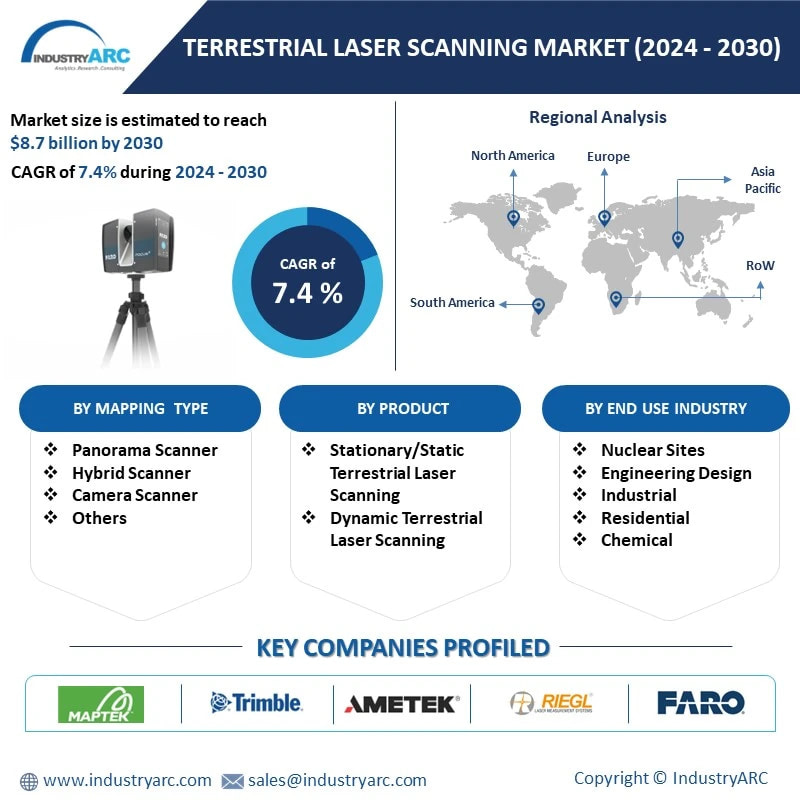
Terrestrial Laser Scanning market is anticipated to reach $8.7 billion by 2030 with a CAGR of 7.4% in the forecast period 2024-2030. The Terrestrial Laser Scanning (TLS) market has witnessed significant growth driven by advancements in 3D modeling, mapping, and surveying technologies. TLS systems are increasingly utilized across various industries such as construction, engineering, archaeology, and forestry for their ability to provide accurate and detailed spatial data. One major trend in the market is the adoption of mobile and lightweight TLS systems, enabling faster data collection and increased portability for on-site applications.
Another noteworthy development is the integration of TLS with other technologies such as Building Information Modeling (BIM) and Geographic Information Systems (GIS), leading to enhanced data analysis and visualization capabilities. This integration facilitates better decision-making processes and improves overall project efficiency.
Moreover, the demand for TLS services is rising due to the growing need for infrastructure development, urban planning, and environmental monitoring. Governments and private organizations are increasingly investing in TLS solutions to support these initiatives, driving market growth further. Additionally, advancements in TLS software are enhancing data processing capabilities, enabling more efficient workflows and reducing turnaround times. Cloud-based solutions are gaining popularity, allowing users to access and analyze TLS data remotely, leading to increased collaboration and productivity.
Furthermore, the TLS market is witnessing innovation in laser scanning technologies, including the development of longer-range scanners, higher-resolution sensors, and improved accuracy. These technological advancements are expanding the application scope of TLS systems, driving market expansion into new industries and niche segments.
Market Snapshot:
Terrestrial Laser Scanning Market Report Coverage
The report: “Terrestrial Laser Scanning Market Forecast (2024-2030)”, by Industry ARC, covers an in-depth analysis of the following segments of the Terrestrial Laser Scanning Market.
By Mapping Type: Panorama Scanner, Hybrid Scanner, Camera Scanner, Others.
By Product: Stationary/Static Terrestrial Laser Scanning, Dynamic Terrestrial Laser Scanning.
Whole Product, Paste, Flour, and Others.
By Measurement Method: Phase Shift Scanner, Pulse Based Scanner/Time of Flight, Optical Triangulation.
By Principle: Galvanometer Scanner, Polygonal Scanner, Shaft Scanner, and Others.
By Application: 3D Surveying, Mobile Mapping, Photogrammetry and Remote Sensing, Forest Monitoring, Topographic Survey, Reverse Engineering, Construction, Tunnelling, Volume Estimation, and Others.
By End Use Industry: Nuclear Sites, Engineering Design, Industrial, Residential, Chemical, Power & Energy, Oil & Gas, Naval Industry, Research.
By Geography: North America (U.S., Canada, Mexico), Europe (Germany, U.K., France, Italy, Spain, Russia and Rest of Europe), Asia Pacific (China, Japan, India, South Korea, Australia & New Zealand, and Rest of Asia Pacific), South America (Brazil, Argentina, Chile, Colombia, and Rest of South America), and Rest of the World (Middle East and Africa).
Key Takeaways
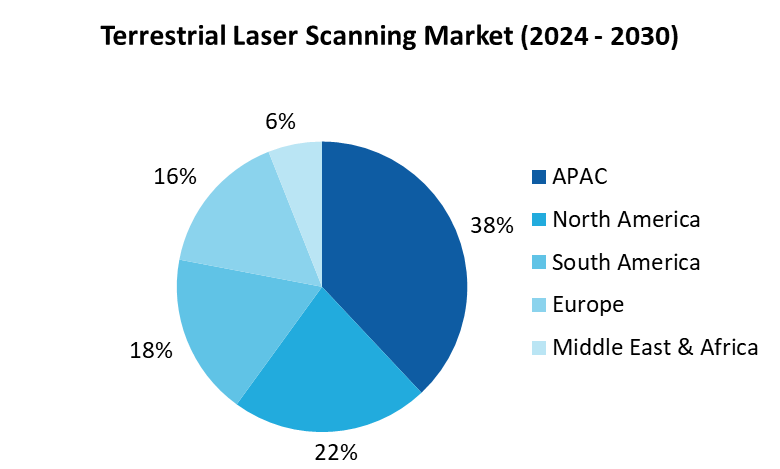
• APAC dominated the Terrestrial Laser Scanning market size with more than 38%, driven by extensive industrial and infrastructure growth. Rapid urbanization and infrastructure investments in China, Japan, India, and Australia propel demand. Additionally, APAC's focus on environmental conservation and disaster management initiatives boosts market expansion, making it the top segment by market share.
• The increasing uptake of BIM and digital twin tech in construction and infrastructure projects is boosting the need for terrestrial laser scanning solutions. By enabling precise as-built modeling, construction monitoring, and data-driven decision-making, integrated laser scanning enhances project efficiency and outcomes, driving market expansion.
For More Details on This Report - Request for Sample
By Mapping Type- Segment Analysis
In the segmentation of the Terrestrial Laser Scanning Market by mapping type, the segment with the majority market share is likely the Camera Scanner category. Camera scanners are widely used in terrestrial laser scanning for their ability to capture high-resolution images along with laser data, providing comprehensive and detailed spatial information. These scanners are favored for their versatility and accuracy in various applications, including topographic mapping, urban planning, and infrastructure development. With the increasing demand for precise spatial data across industries, camera scanners have emerged as a preferred choice, driving their dominance in the terrestrial laser scanning market.
By Product - Segment Analysis
In the segmentation of the Terrestrial Laser Scanning Market by product, the Stationary/Static Terrestrial Laser Scanning segment likely holds the majority market share. Stationary/Static Terrestrial Laser Scanning involves the use of fixed-position laser scanners to capture detailed 3D data of stationary objects or environments. This method is commonly employed in various applications such as civil engineering, construction, archaeology, and forestry. The stationary nature of these scanners allows for precise and accurate data collection over extended periods, making them a preferred choice for industries requiring high-resolution spatial information. As a result, the Stationary/Static Terrestrial Laser Scanning segment is expected to dominate the market due to its versatility and widespread application across multiple sectors.
By Geography - Segment Analysis
In 2023, APAC dominated the Terrestrial Laser Scanning market share with more than 38%. The APAC region encompasses a vast and diverse landscape with significant industrial development and infrastructure projects, driving the demand for terrestrial laser scanning technologies. Countries like China, Japan, India, and Australia are witnessing rapid urbanization, construction activities, and infrastructure investments, further fueling the adoption of laser scanning solutions. Moreover, the increasing focus on environmental conservation and disaster management initiatives in the APAC region also contributes to the growth of the terrestrial laser scanning market, making it the leading geographical segment in terms of market share.
Drivers – Terrestrial Laser Scanning Market
• Demand for Precise Geospatial Data
The burgeoning demand for precise geospatial data is a pivotal factor propelling the terrestrial laser scanning market forward. Industries spanning construction, mining, forestry, and infrastructure development increasingly rely on accurate spatial information. Terrestrial laser scanners play a crucial role by capturing detailed 3D data of landscapes, structures, and objects, enabling precise mapping, modeling, and analysis. This demand surge is fueled by the pressing need for efficient resource management, urban planning, disaster mitigation, and environmental monitoring. As organizations strive for data-driven decision-making and optimization of operations, terrestrial laser scanning emerges as a vital solution to meet these evolving demands and challenges across diverse sectors, driving substantial growth and innovation in the market.
• Advancements in Technology
Ongoing technological advancements in terrestrial laser scanning systems are pivotal drivers of market growth. Improved laser sensors, faster scanning speeds, higher accuracy, and enhanced software capabilities propel efficiency and reduce operational costs. These advancements broaden the application areas for terrestrial laser scanning, making it more accessible and beneficial across various industries and applications. With increased efficiency and reduced costs, organizations can achieve better resource management, streamline operations, and enhance decision-making processes. Moreover, the expanded capabilities of terrestrial laser scanning systems facilitate precise mapping, modeling, and analysis, driving innovation and value creation across sectors. As a result, the market for terrestrial laser scanning is experiencing significant growth, fueled by these technological innovations.
Challenges –Terrestrial Laser Scanning Market
• Hardware and Software Integration
In the Terrestrial Laser Scanning (TLS) market, achieving seamless integration between hardware and software is paramount for maximizing system performance. Challenges arise due to the need to ensure compatibility, calibration, and synchronization between diverse hardware components like laser scanners and sensors, and software platforms. Inadequate integration can lead to data inconsistencies, inaccuracies, and operational inefficiencies, hampering the effectiveness of TLS solutions. This can impact various industries relying on TLS technology, including construction, mining, forestry, and infrastructure development. To address these challenges, businesses must invest in robust integration processes, advanced calibration techniques, and interoperable software solutions tailored to meet the specific needs of TLS applications. Successful integration enhances data quality, reliability, and usability, driving market competitiveness and customer satisfaction in the TLS industry.
Market Landscape
Acquisitions, Partnerships and R&D activities are key strategies adopted by players in the Terrestrial Laser Scanning market. Terrestrial Laser Scanning top 10 companies include
1. Maptek Pty Limited
2. Trimble Navigation Limited
3. Ametek Inc
4. RIEGL Laser Measurement Systems GmbH
5. FARO Technologies, Inc.
6. Hexagon AB
7. Blom ASA
8. General Electric
9. Fugro N.V
10. Harvey-Lynch, Inc
Acquisitions/Technology Launches
• In November 2022, 3D Systems enhanced its Selective Laser Sintering portfolio by partnering with Wematter. This collaboration provides 3D Systems with global distribution rights for Gravity, expanding the market scope for Wematter's storage solution in end-use component manufacturing, benefiting the Terrestrial Laser Scanning Market.
For more Automation and Instrumentation Market reports, please click here
1. Terrestrial Laser Scanning Market - Overview
1.1. Definitions and Scope
2. Terrestrial Laser Scanning Market - Executive summary
2.1. Market Revenue, Market Size and Key Trends by Company
2.2. Key Trends by Major Segments
2.3. Key Trends segmented by Geography
3. Terrestrial Laser Scanning Market
3.1. Comparative analysis
3.1.1. Product Benchmarking - Top 10 companies
3.1.2. Top 5 Financials Analysis
3.1.3. Market Value split by Top 10 companies
3.1.4. Patent Analysis - Top 10 companies
3.1.5. Pricing Analysis
4. Terrestrial Laser Scanning Market – Startup companies Scenario Premium
4.1. Top 10 startup company Analysis by
4.1.1. Investment
4.1.2. Revenue
4.1.3. Market Shares
4.1.4. Market Size and Application Analysis
4.1.5. Venture Capital and Funding Scenario
5. Terrestrial Laser Scanning Market – Industry Market Entry Scenario Premium
5.1. Regulatory Framework Overview
5.2. New Business and Ease of Doing business index
5.3. Case studies of successful ventures
5.4. Customer Analysis – Top 10 companies
6. Terrestrial Laser Scanning Market Forces
6.1. Drivers
6.2. Constraints
6.3. Challenges
6.4. Porters five force model
6.4.1. Bargaining power of suppliers
6.4.2. Bargaining powers of customers
6.4.3. Threat of new entrants
6.4.4. Rivalry among existing players
6.4.5. Threat of substitutes
7. Terrestrial Laser Scanning Market -Strategic analysis
7.1. Value chain analysis
7.2. Opportunities analysis
7.3. Product life cycle
7.4. Suppliers and distributors Market Share
8. Terrestrial Laser Scanning Market – By Mapping Type (Market Size -$Million / $Billion)
8.1. Market Size and Market Share Analysis
8.2. Application Revenue and Trend Research
8.3. Product Segment Analysis
8.3.1. Introduction
8.3.2. Panorama Scanner
8.3.3. Hybrid Scanner
8.3.4. Camera Scanner
8.3.5. Others
9. Terrestrial Laser Scanning Market – By Product (Market Size -$Million / $Billion)
9.1. Stationary/Static Terrestrial Laser Scanning
9.1.1. Short Range Laser Scanner
9.1.2. Medium Range Laser Scanner
9.1.3. Long Range Laser Scanner
9.2. Dynamic Terrestrial Laser Scanning
9.2.1. Commercial Laser Scanner
9.2.2. Custom Built Scanner
9.2.3. Research Laser Scanner
10. Terrestrial Laser Scanning Market – By Measurement Method (Market Size -$Million / $Billion)
10.1. Introduction
10.2. Phase Shift Scanner
10.3. Pulse Based Scanner/Time of Flight
10.4. Optical Triangulation
11. Terrestrial Laser Scanning Market – By Principle (Market Size -$Million / $Billion)
11.1. Galvanometer Scanner
11.2. Polygonal Scanner
11.3. Shaft Scanner
11.4. Others
12. Terrestrial Laser Scanning Market – By Application (Market Size -$Million / $Billion)
12.1. 3D Surveying
12.2. Mobile Mapping
12.3. Photogrammetry and Remote Sensing
12.4. Forest Monitoring
12.5. Topographic Survey
12.6. Reverse Engineering
12.7. Construction
12.8. Tunnelling
12.9. Volume Estimation
12.10. Others
13. Terrestrial Laser Scanning – By End Use Industry (Market Size -$Million / $Billion)
13.1. Nuclear Sites
13.2. Engineering Design
13.3 Industrial
13.4. Residential
13.5. Chemical
13.6. Power & Energy
13.7. Oil & Gas
13.7.1. Onshore
13.7.2. Offshore
13.8. Naval Industry
13.9. Research
13.10 Others
14. Terrestrial Laser Scanning - By Geography (Market Size -$Million / $Billion)
14.1. Terrestrial Laser Scanning Market - North America Segment Research
14.2. North America Market Research (Million / $Billion)
14.2.1. Segment type Size and Market Size Analysis
14.2.2. Revenue and Trends
14.2.4. Company Revenue and Product Analysis
14.2.5. North America Product type and Application Market Size
14.2.5.1. U.S.
14.2.5.2. Canada
14.2.5.3. Mexico
14.2.5.4. Rest of North America
14.3. Terrestrial Laser Scanning - South America Segment Research
14.4. South America Market Research (Market Size -$Million / $Billion)
14.4.1. Segment type Size and Market Size Analysis
14.4.2. Revenue and Trends
14.4.3. Application Revenue and Trends by type of Application
14.4.4. Company Revenue and Product Analysis
14.4.5. South America Product type and Application Market Size
14.4.5.1. Brazil
14.4.5.2. Argentina
14.4.5.3. Chile
14.4.5.4. Colombia
14.4.5.5. Rest of South America
14.5. Terrestrial Laser Scanning - Europe Segment Research
14.6. Europe Market Research (Market Size -$Million / $Billion)
14.6.1. Segment type Size and Market Size Analysis
14.6.2. Revenue and Trends
14.6.3. Application Revenue and Trends by type of Application
14.6.4. Company Revenue and Product Analysis
14.6.5. Europe Segment Product type and Application Market Size
14.6.5.1. U.K
14.6.5.2. Germany
14.6.5.3. Italy
14.6.5.4. France
14.6.5.5. Netherlands
14.6.5.6. Belgium
14.6.5.7. Spain
14.6.5.8. Denmark
14.6.5.9. Rest of Europe
14.7. Terrestrial Laser Scanning – APAC Segment Research
14.8. APAC Market Research (Market Size -$Million / $Billion)
14.8.1. Segment type Size and Market Size Analysis
14.8.2. Revenue and Trends
14.8.3. Application Revenue and Trends by type of Application
14.8.4. Company Revenue and Product Analysis
14.8.5. APAC Segment – Product type and Application Market Size
14.8.5.1. China
14.8.5.2. Australia
14.8.5.3. Japan
14.8.5.4. South Korea
14.8.5.5. India
14.8.5.6. Taiwan
14.8.5.7. Malaysia
14.8.5.8 Rest of APAC
14.9. ROW Market Research (Market Size -$Million / $Billion)
14.9.1. Segment type Size and Market Size Analysis
14.9.2. Revenue and Trends
14.9.3. Application Revenue and Trends by type of Application
14.9.4. Company Revenue and Product Analysis
14.9.5. Rest of World Market Segment – Product type and Application Market Size
14.9.5.1. Middle East
14.9.5.2. Africa
15. Terrestrial Laser Scanning Market - Entropy
15.1. New product launches
15.2. M&A's, collaborations, JVs and partnerships
16. Terrestrial Laser Scanning Market – Industry / Segment Competition landscape Premium
16.1. Market Share Analysis
16.1.1. Market Share by Region - Top companies
16.1.2. Market Share by Country- Top 10 companies
16.1.3. Market Share by type of Product / Product category- Top 10 companies
16.2. Best Practises for companies
17. Terrestrial Laser Scanning Market – Key Company List by Country Premium
18. Terrestrial Laser Scanning Market Company Analysis
18.1. Market Share, Company Revenue, Products, M&A, Developments
18.2. Maptek Pty Limited
18.3. Trimble Navigation Limited
18.4. Ametek Inc
18.5. Blom ASA
18.6. General Electric
18.7. RIEGL Laser Measurement Systems GmbH
18.8. Fugro N.V
18.9. FARO Technologies, Inc
18.10. Harvey-Lynch, Inc
18.11. Merrett Survey Limited
"Financials would be provided on a best-efforts basis for private companies"
List of Tables
Table 1 Terrestrial Laser Scanning Market Overview 2023-2030
Table 2 Terrestrial Laser Scanning Market Leader Analysis 2023-2030 (US$)
Table 3 Terrestrial Laser Scanning MarketProduct Analysis 2023-2030 (US$)
Table 4 Terrestrial Laser Scanning MarketEnd User Analysis 2023-2030 (US$)
Table 5 Terrestrial Laser Scanning MarketPatent Analysis 2013-2023* (US$)
Table 6 Terrestrial Laser Scanning MarketFinancial Analysis 2023-2030 (US$)
Table 7 Terrestrial Laser Scanning Market Driver Analysis 2023-2030 (US$)
Table 8 Terrestrial Laser Scanning MarketChallenges Analysis 2023-2030 (US$)
Table 9 Terrestrial Laser Scanning MarketConstraint Analysis 2023-2030 (US$)
Table 10 Terrestrial Laser Scanning Market Supplier Bargaining Power Analysis 2023-2030 (US$)
Table 11 Terrestrial Laser Scanning Market Buyer Bargaining Power Analysis 2023-2030 (US$)
Table 12 Terrestrial Laser Scanning Market Threat of Substitutes Analysis 2023-2030 (US$)
Table 13 Terrestrial Laser Scanning Market Threat of New Entrants Analysis 2023-2030 (US$)
Table 14 Terrestrial Laser Scanning Market Degree of Competition Analysis 2023-2030 (US$)
Table 15 Terrestrial Laser Scanning MarketValue Chain Analysis 2023-2030 (US$)
Table 16 Terrestrial Laser Scanning MarketPricing Analysis 2023-2030 (US$)
Table 17 Terrestrial Laser Scanning MarketOpportunities Analysis 2023-2030 (US$)
Table 18 Terrestrial Laser Scanning MarketProduct Life Cycle Analysis 2023-2030 (US$)
Table 19 Terrestrial Laser Scanning MarketSupplier Analysis 2023-2030 (US$)
Table 20 Terrestrial Laser Scanning MarketDistributor Analysis 2023-2030 (US$)
Table 21 Terrestrial Laser Scanning Market Trend Analysis 2023-2030 (US$)
Table 22 Terrestrial Laser Scanning Market Size 2023 (US$)
Table 23 Terrestrial Laser Scanning Market Forecast Analysis 2023-2030 (US$)
Table 24 Terrestrial Laser Scanning Market Sales Forecast Analysis 2023-2030 (Units)
Table 25 Terrestrial Laser Scanning Market, Revenue & Volume,By Mapping Type, 2023-2030 ($)
Table 26 Terrestrial Laser Scanning MarketBy Mapping Type, Revenue & Volume,By Panorama Scanner, 2023-2030 ($)
Table 27 Terrestrial Laser Scanning MarketBy Mapping Type, Revenue & Volume,By Hybrid Scanner, 2023-2030 ($)
Table 28 Terrestrial Laser Scanning MarketBy Mapping Type, Revenue & Volume,By Hybrid Scanner, 2023-2030 ($)
Table 29 Terrestrial Laser Scanning MarketBy Mapping Type, Revenue & Volume,By Camera Scanner, 2023-2030 ($)
Table 30 Terrestrial Laser Scanning Market, Revenue & Volume,By Product, 2023-2030 ($)
Table 31 Terrestrial Laser Scanning MarketBy Product, Revenue & Volume,By Stationary/Static Terrestrial Laser Scanning, 2023-2030 ($)
Table 32 Terrestrial Laser Scanning MarketBy Product, Revenue & Volume,By Dynamic Terrestrial Laser Scanning, 2023-2030 ($)
Table 33 Terrestrial Laser Scanning Market, Revenue & Volume,By Measurement Method, 2023-2030 ($)
Table 34 Terrestrial Laser Scanning MarketBy Measurement Method, Revenue & Volume,By Phase Shift Scanner, 2023-2030 ($)
Table 35 Terrestrial Laser Scanning MarketBy Measurement Method, Revenue & Volume,By Pulse Based Scanner/Time of Flight, 2023-2030 ($)
Table 36 Terrestrial Laser Scanning MarketBy Measurement Method, Revenue & Volume,By Optical Triangulation, 2023-2030 ($)
Table 37 Terrestrial Laser Scanning Market, Revenue & Volume,By Application, 2023-2030 ($)
Table 38 Terrestrial Laser Scanning MarketBy Application, Revenue & Volume,By 3D Surveying, 2023-2030 ($)
Table 39 Terrestrial Laser Scanning MarketBy Application, Revenue & Volume,By Mobile Mapping, 2023-2030 ($)
Table 40 Terrestrial Laser Scanning MarketBy Application, Revenue & Volume,By Photogrammetry and Remote Sensing, 2023-2030 ($)
Table 41 Terrestrial Laser Scanning MarketBy Application, Revenue & Volume,By Forest Monitoring, 2023-2030 ($)
Table 42 Terrestrial Laser Scanning MarketBy Application, Revenue & Volume,By Topographic Survey, 2023-2030 ($)
Table 43 Terrestrial Laser Scanning Market, Revenue & Volume,By End User Industry, 2023-2030 ($)
Table 44 Terrestrial Laser Scanning MarketBy End User Industry, Revenue & Volume,By Nuclear Sites, 2023-2030 ($)
Table 45 Terrestrial Laser Scanning MarketBy End User Industry, Revenue & Volume,By Engineering Design, 2023-2030 ($)
Table 46 Terrestrial Laser Scanning MarketBy End User Industry, Revenue & Volume,By Industrial, 2023-2030 ($)
Table 47 Terrestrial Laser Scanning MarketBy End User Industry, Revenue & Volume,By Residential, 2023-2030 ($)
Table 48 Terrestrial Laser Scanning MarketBy End User Industry, Revenue & Volume,By Chemical, 2023-2030 ($)
Table 49 North America Terrestrial Laser Scanning Market, Revenue & Volume,By Mapping Type, 2023-2030 ($)
Table 50 North America Terrestrial Laser Scanning Market, Revenue & Volume,By Product, 2023-2030 ($)
Table 51 North America Terrestrial Laser Scanning Market, Revenue & Volume,By Measurement Method, 2023-2030 ($)
Table 52 North America Terrestrial Laser Scanning Market, Revenue & Volume,By Application, 2023-2030 ($)
Table 53 North America Terrestrial Laser Scanning Market, Revenue & Volume,By End User Industry, 2023-2030 ($)
Table 54 South america Terrestrial Laser Scanning Market, Revenue & Volume,By Mapping Type, 2023-2030 ($)
Table 55 South america Terrestrial Laser Scanning Market, Revenue & Volume,By Product, 2023-2030 ($)
Table 56 South america Terrestrial Laser Scanning Market, Revenue & Volume,By Measurement Method, 2023-2030 ($)
Table 57 South america Terrestrial Laser Scanning Market, Revenue & Volume,By Application, 2023-2030 ($)
Table 58 South america Terrestrial Laser Scanning Market, Revenue & Volume,By End User Industry, 2023-2030 ($)
Table 59 Europe Terrestrial Laser Scanning Market, Revenue & Volume,By Mapping Type, 2023-2030 ($)
Table 60 Europe Terrestrial Laser Scanning Market, Revenue & Volume,By Product, 2023-2030 ($)
Table 61 Europe Terrestrial Laser Scanning Market, Revenue & Volume,By Measurement Method, 2023-2030 ($)
Table 62 Europe Terrestrial Laser Scanning Market, Revenue & Volume,By Application, 2023-2030 ($)
Table 63 Europe Terrestrial Laser Scanning Market, Revenue & Volume,By End User Industry, 2023-2030 ($)
Table 64 APAC Terrestrial Laser Scanning Market, Revenue & Volume,By Mapping Type, 2023-2030 ($)
Table 65 APAC Terrestrial Laser Scanning Market, Revenue & Volume,By Product, 2023-2030 ($)
Table 66 APAC Terrestrial Laser Scanning Market, Revenue & Volume,By Measurement Method, 2023-2030 ($)
Table 67 APAC Terrestrial Laser Scanning Market, Revenue & Volume,By Application, 2023-2030 ($)
Table 68 APAC Terrestrial Laser Scanning Market, Revenue & Volume,By End User Industry, 2023-2030 ($)
Table 69 Middle East & Africa Terrestrial Laser Scanning Market, Revenue & Volume,By Mapping Type, 2023-2030 ($)
Table 70 Middle East & Africa Terrestrial Laser Scanning Market, Revenue & Volume,By Product, 2023-2030 ($)
Table 71 Middle East & Africa Terrestrial Laser Scanning Market, Revenue & Volume,By Measurement Method, 2023-2030 ($)
Table 72 Middle East & Africa Terrestrial Laser Scanning Market, Revenue & Volume,By Application, 2023-2030 ($)
Table 73 Middle East & Africa Terrestrial Laser Scanning Market, Revenue & Volume,By End User Industry, 2023-2030 ($)
Table 74 Russia Terrestrial Laser Scanning Market, Revenue & Volume,By Mapping Type, 2023-2030 ($)
Table 75 Russia Terrestrial Laser Scanning Market, Revenue & Volume,By Product, 2023-2030 ($)
Table 76 Russia Terrestrial Laser Scanning Market, Revenue & Volume,By Measurement Method, 2023-2030 ($)
Table 77 Russia Terrestrial Laser Scanning Market, Revenue & Volume,By Application, 2023-2030 ($)
Table 78 Russia Terrestrial Laser Scanning Market, Revenue & Volume,By End User Industry, 2023-2030 ($)
Table 79 Israel Terrestrial Laser Scanning Market, Revenue & Volume,By Mapping Type, 2023-2030 ($)
Table 80 Israel Terrestrial Laser Scanning Market, Revenue & Volume,By Product, 2023-2030 ($)
Table 81 Israel Terrestrial Laser Scanning Market, Revenue & Volume,By Measurement Method, 2023-2030 ($)
Table 82 Israel Terrestrial Laser Scanning Market, Revenue & Volume,By Application, 2023-2030 ($)
Table 83 Israel Terrestrial Laser Scanning Market, Revenue & Volume,By End User Industry, 2023-2030 ($)
Table 84 Top Companies 2023 (US$)Terrestrial Laser Scanning Market, Revenue & Volume,,
Table 85 Product Launch 2023-2030Terrestrial Laser Scanning Market, Revenue & Volume,,
Table 86 Mergers & Acquistions 2023-2030Terrestrial Laser Scanning Market, Revenue & Volume,,
List of Figures
Figure 1 Overview of Terrestrial Laser Scanning Market 2023-2030
Figure 2 Market Share Analysis for Terrestrial Laser Scanning Market 2023 (US$)
Figure 3 Product Comparison in Terrestrial Laser Scanning Market 2023-2030 (US$)
Figure 4 End User Profile for Terrestrial Laser Scanning Market 2023-2030 (US$)
Figure 5 Patent Application and Grant in Terrestrial Laser Scanning Market 2013-2023* (US$)
Figure 6 Top 5 Companies Financial Analysis in Terrestrial Laser Scanning Market 2023-2030 (US$)
Figure 7 Market Entry Strategy in Terrestrial Laser Scanning Market 2023-2030
Figure 8 Ecosystem Analysis in Terrestrial Laser Scanning Market2023
Figure 9 Average Selling Price in Terrestrial Laser Scanning Market 2023-2030
Figure 10 Top Opportunites in Terrestrial Laser Scanning Market 2023-2030
Figure 11 Market Life Cycle Analysis in Terrestrial Laser Scanning Market
Figure 12 GlobalBy Mapping TypeTerrestrial Laser Scanning Market Revenue, 2023-2030 ($)
Figure 13 GlobalBy ProductTerrestrial Laser Scanning Market Revenue, 2023-2030 ($)
Figure 14 GlobalBy Measurement MethodTerrestrial Laser Scanning Market Revenue, 2023-2030 ($)
Figure 15 GlobalBy ApplicationTerrestrial Laser Scanning Market Revenue, 2023-2030 ($)
Figure 16 GlobalBy End User IndustryTerrestrial Laser Scanning Market Revenue, 2023-2030 ($)
Figure 17 Global Terrestrial Laser Scanning Market - By Geography
Figure 18 Global Terrestrial Laser Scanning Market Value & Volume, By Geography, 2023-2030 ($)
Figure 19 Global Terrestrial Laser Scanning Market CAGR, By Geography, 2023-2030 (%)
Figure 20 North America Terrestrial Laser Scanning Market Value & Volume, 2023-2030 ($)
Figure 21 US Terrestrial Laser Scanning Market Value & Volume, 2023-2030 ($)
Figure 22 US GDP and Population, 2023-2030 ($)
Figure 23 US GDP – Composition of 2023, By Sector of Origin
Figure 24 US Export and Import Value & Volume, 2023-2030 ($)
Figure 25 Canada Terrestrial Laser Scanning Market Value & Volume, 2023-2030 ($)
Figure 26 Canada GDP and Population, 2023-2030 ($)
Figure 27 Canada GDP – Composition of 2023, By Sector of Origin
Figure 28 Canada Export and Import Value & Volume, 2023-2030 ($)
Figure 29 Mexico Terrestrial Laser Scanning Market Value & Volume, 2023-2030 ($)
Figure 30 Mexico GDP and Population, 2023-2030 ($)
Figure 31 Mexico GDP – Composition of 2023, By Sector of Origin
Figure 32 Mexico Export and Import Value & Volume, 2023-2030 ($)
Figure 33 South America Terrestrial Laser Scanning MarketSouth America 3D Printing Market Value & Volume, 2023-2030 ($)
Figure 34 Brazil Terrestrial Laser Scanning Market Value & Volume, 2023-2030 ($)
Figure 35 Brazil GDP and Population, 2023-2030 ($)
Figure 36 Brazil GDP – Composition of 2023, By Sector of Origin
Figure 37 Brazil Export and Import Value & Volume, 2023-2030 ($)
Figure 38 Venezuela Terrestrial Laser Scanning Market Value & Volume, 2023-2030 ($)
Figure 39 Venezuela GDP and Population, 2023-2030 ($)
Figure 40 Venezuela GDP – Composition of 2023, By Sector of Origin
Figure 41 Venezuela Export and Import Value & Volume, 2023-2030 ($)
Figure 42 Argentina Terrestrial Laser Scanning Market Value & Volume, 2023-2030 ($)
Figure 43 Argentina GDP and Population, 2023-2030 ($)
Figure 44 Argentina GDP – Composition of 2023, By Sector of Origin
Figure 45 Argentina Export and Import Value & Volume, 2023-2030 ($)
Figure 46 Ecuador Terrestrial Laser Scanning Market Value & Volume, 2023-2030 ($)
Figure 47 Ecuador GDP and Population, 2023-2030 ($)
Figure 48 Ecuador GDP – Composition of 2023, By Sector of Origin
Figure 49 Ecuador Export and Import Value & Volume, 2023-2030 ($)
Figure 50 Peru Terrestrial Laser Scanning Market Value & Volume, 2023-2030 ($)
Figure 51 Peru GDP and Population, 2023-2030 ($)
Figure 52 Peru GDP – Composition of 2023, By Sector of Origin
Figure 53 Peru Export and Import Value & Volume, 2023-2030 ($)
Figure 54 Colombia Terrestrial Laser Scanning Market Value & Volume, 2023-2030 ($)
Figure 55 Colombia GDP and Population, 2023-2030 ($)
Figure 56 Colombia GDP – Composition of 2023, By Sector of Origin
Figure 57 Colombia Export and Import Value & Volume, 2023-2030 ($)
Figure 58 Costa Rica Terrestrial Laser Scanning MarketCosta Rica 3D Printing Market Value & Volume, 2023-2030 ($)
Figure 59 Costa Rica GDP and Population, 2023-2030 ($)
Figure 60 Costa Rica GDP – Composition of 2023, By Sector of Origin
Figure 61 Costa Rica Export and Import Value & Volume, 2023-2030 ($)
Figure 62 Europe Terrestrial Laser Scanning Market Value & Volume, 2023-2030 ($)
Figure 63 U.K Terrestrial Laser Scanning Market Value & Volume, 2023-2030 ($)
Figure 64 U.K GDP and Population, 2023-2030 ($)
Figure 65 U.K GDP – Composition of 2023, By Sector of Origin
Figure 66 U.K Export and Import Value & Volume, 2023-2030 ($)
Figure 67 Germany Terrestrial Laser Scanning Market Value & Volume, 2023-2030 ($)
Figure 68 Germany GDP and Population, 2023-2030 ($)
Figure 69 Germany GDP – Composition of 2023, By Sector of Origin
Figure 70 Germany Export and Import Value & Volume, 2023-2030 ($)
Figure 71 Italy Terrestrial Laser Scanning Market Value & Volume, 2023-2030 ($)
Figure 72 Italy GDP and Population, 2023-2030 ($)
Figure 73 Italy GDP – Composition of 2023, By Sector of Origin
Figure 74 Italy Export and Import Value & Volume, 2023-2030 ($)
Figure 75 France Terrestrial Laser Scanning Market Value & Volume, 2023-2030 ($)
Figure 76 France GDP and Population, 2023-2030 ($)
Figure 77 France GDP – Composition of 2023, By Sector of Origin
Figure 78 France Export and Import Value & Volume, 2023-2030 ($)
Figure 79 Netherlands Terrestrial Laser Scanning Market Value & Volume, 2023-2030 ($)
Figure 80 Netherlands GDP and Population, 2023-2030 ($)
Figure 81 Netherlands GDP – Composition of 2023, By Sector of Origin
Figure 82 Netherlands Export and Import Value & Volume, 2023-2030 ($)
Figure 83 Belgium Terrestrial Laser Scanning Market Value & Volume, 2023-2030 ($)
Figure 84 Belgium GDP and Population, 2023-2030 ($)
Figure 85 Belgium GDP – Composition of 2023, By Sector of Origin
Figure 86 Belgium Export and Import Value & Volume, 2023-2030 ($)
Figure 87 Spain Terrestrial Laser Scanning Market Value & Volume, 2023-2030 ($)
Figure 88 Spain GDP and Population, 2023-2030 ($)
Figure 89 Spain GDP – Composition of 2023, By Sector of Origin
Figure 90 Spain Export and Import Value & Volume, 2023-2030 ($)
Figure 91 Denmark Terrestrial Laser Scanning Market Value & Volume, 2023-2030 ($)
Figure 92 Denmark GDP and Population, 2023-2030 ($)
Figure 93 Denmark GDP – Composition of 2023, By Sector of Origin
Figure 94 Denmark Export and Import Value & Volume, 2023-2030 ($)
Figure 95 APAC Terrestrial Laser Scanning Market Value & Volume, 2023-2030 ($)
Figure 96 China Terrestrial Laser Scanning MarketValue & Volume, 2023-2030
Figure 97 China GDP and Population, 2023-2030 ($)
Figure 98 China GDP – Composition of 2023, By Sector of Origin
Figure 99 China Export and Import Value & Volume, 2023-2030 ($)Terrestrial Laser Scanning MarketChina Export and Import Value & Volume, 2023-2030 ($)
Figure 100 Australia Terrestrial Laser Scanning Market Value & Volume, 2023-2030 ($)
Figure 101 Australia GDP and Population, 2023-2030 ($)
Figure 102 Australia GDP – Composition of 2023, By Sector of Origin
Figure 103 Australia Export and Import Value & Volume, 2023-2030 ($)
Figure 104 South Korea Terrestrial Laser Scanning Market Value & Volume, 2023-2030 ($)
Figure 105 South Korea GDP and Population, 2023-2030 ($)
Figure 106 South Korea GDP – Composition of 2023, By Sector of Origin
Figure 107 South Korea Export and Import Value & Volume, 2023-2030 ($)
Figure 108 India Terrestrial Laser Scanning Market Value & Volume, 2023-2030 ($)
Figure 109 India GDP and Population, 2023-2030 ($)
Figure 110 India GDP – Composition of 2023, By Sector of Origin
Figure 111 India Export and Import Value & Volume, 2023-2030 ($)
Figure 112 Taiwan Terrestrial Laser Scanning MarketTaiwan 3D Printing Market Value & Volume, 2023-2030 ($)
Figure 113 Taiwan GDP and Population, 2023-2030 ($)
Figure 114 Taiwan GDP – Composition of 2023, By Sector of Origin
Figure 115 Taiwan Export and Import Value & Volume, 2023-2030 ($)
Figure 116 Malaysia Terrestrial Laser Scanning MarketMalaysia 3D Printing Market Value & Volume, 2023-2030 ($)
Figure 117 Malaysia GDP and Population, 2023-2030 ($)
Figure 118 Malaysia GDP – Composition of 2023, By Sector of Origin
Figure 119 Malaysia Export and Import Value & Volume, 2023-2030 ($)
Figure 120 Hong Kong Terrestrial Laser Scanning MarketHong Kong 3D Printing Market Value & Volume, 2023-2030 ($)
Figure 121 Hong Kong GDP and Population, 2023-2030 ($)
Figure 122 Hong Kong GDP – Composition of 2023, By Sector of Origin
Figure 123 Hong Kong Export and Import Value & Volume, 2023-2030 ($)
Figure 124 Middle East & Africa Terrestrial Laser Scanning MarketMiddle East & Africa 3D Printing Market Value & Volume, 2023-2030 ($)
Figure 125 Russia Terrestrial Laser Scanning MarketRussia 3D Printing Market Value & Volume, 2023-2030 ($)
Figure 126 Russia GDP and Population, 2023-2030 ($)
Figure 127 Russia GDP – Composition of 2023, By Sector of Origin
Figure 128 Russia Export and Import Value & Volume, 2023-2030 ($)
Figure 129 Israel Terrestrial Laser Scanning Market Value & Volume, 2023-2030 ($)
Figure 130 Israel GDP and Population, 2023-2030 ($)
Figure 131 Israel GDP – Composition of 2023, By Sector of Origin
Figure 132 Israel Export and Import Value & Volume, 2023-2030 ($)
Figure 133 Entropy Share, By Strategies, 2023-2030* (%)Terrestrial Laser Scanning Market
Figure 134 Developments, 2023-2030*Terrestrial Laser Scanning Market
Figure 135 Company 1 Terrestrial Laser Scanning Market Net Revenue, By Years, 2023-2030* ($)
Figure 136 Company 1 Terrestrial Laser Scanning Market Net Revenue Share, By Business segments, 2023 (%)
Figure 137 Company 1 Terrestrial Laser Scanning Market Net Sales Share, By Geography, 2023 (%)
Figure 138 Company 2 Terrestrial Laser Scanning Market Net Revenue, By Years, 2023-2030* ($)
Figure 139 Company 2 Terrestrial Laser Scanning Market Net Revenue Share, By Business segments, 2023 (%)
Figure 140 Company 2 Terrestrial Laser Scanning Market Net Sales Share, By Geography, 2023 (%)
Figure 141 Company 3Terrestrial Laser Scanning Market Net Revenue, By Years, 2023-2030* ($)
Figure 142 Company 3Terrestrial Laser Scanning Market Net Revenue Share, By Business segments, 2023 (%)
Figure 143 Company 3Terrestrial Laser Scanning Market Net Sales Share, By Geography, 2023 (%)
Figure 144 Company 4 Terrestrial Laser Scanning Market Net Revenue, By Years, 2023-2030* ($)
Figure 145 Company 4 Terrestrial Laser Scanning Market Net Revenue Share, By Business segments, 2023 (%)
Figure 146 Company 4 Terrestrial Laser Scanning Market Net Sales Share, By Geography, 2023 (%)
Figure 147 Company 5 Terrestrial Laser Scanning Market Net Revenue, By Years, 2023-2030* ($)
Figure 148 Company 5 Terrestrial Laser Scanning Market Net Revenue Share, By Business segments, 2023 (%)
Figure 149 Company 5 Terrestrial Laser Scanning Market Net Sales Share, By Geography, 2023 (%)
Figure 150 Company 6 Terrestrial Laser Scanning Market Net Revenue, By Years, 2023-2030* ($)
Figure 151 Company 6 Terrestrial Laser Scanning Market Net Revenue Share, By Business segments, 2023 (%)
Figure 152 Company 6 Terrestrial Laser Scanning Market Net Sales Share, By Geography, 2023 (%)
Figure 153 Company 7 Terrestrial Laser Scanning Market Net Revenue, By Years, 2023-2030* ($)
Figure 154 Company 7 Terrestrial Laser Scanning Market Net Revenue Share, By Business segments, 2023 (%)
Figure 155 Company 7 Terrestrial Laser Scanning Market Net Sales Share, By Geography, 2023 (%)
Figure 156 Company 8 Terrestrial Laser Scanning Market Net Revenue, By Years, 2023-2030* ($)
Figure 157 Company 8 Terrestrial Laser Scanning Market Net Revenue Share, By Business segments, 2023 (%)
Figure 158 Company 8 Terrestrial Laser Scanning Market Net Sales Share, By Geography, 2023 (%)
Figure 159 Company 9 Terrestrial Laser Scanning Market Net Revenue, By Years, 2023-2030* ($)
Figure 160 Company 9 Terrestrial Laser Scanning Market Net Revenue Share, By Business segments, 2023 (%)
Figure 161 Company 9 Terrestrial Laser Scanning Market Net Sales Share, By Geography, 2023 (%)
Figure 162 Company 10 Terrestrial Laser Scanning Market Net Revenue, By Years, 2023-2030* ($)
Figure 163 Company 10 Terrestrial Laser Scanning Market Net Revenue Share, By Business segments, 2023 (%)
Figure 164 Company 10 Terrestrial Laser Scanning Market Net Sales Share, By Geography, 2023 (%)
Figure 165 Company 11 Terrestrial Laser Scanning Market Net Revenue, By Years, 2023-2030* ($)
Figure 166 Company 11 Terrestrial Laser Scanning Market Net Revenue Share, By Business segments, 2023 (%)
Figure 167 Company 11 Terrestrial Laser Scanning Market Net Sales Share, By Geography, 2023 (%)
Figure 168 Company 12 Terrestrial Laser Scanning Market Net Revenue, By Years, 2023-2030* ($)
Figure 169 Company 12 Terrestrial Laser Scanning Market Net Revenue Share, By Business segments, 2023 (%)
Figure 170 Company 12 Terrestrial Laser Scanning Market Net Sales Share, By Geography, 2023 (%)
Figure 171 Company 13Terrestrial Laser Scanning Market Net Revenue, By Years, 2023-2030* ($)
Figure 172 Company 13Terrestrial Laser Scanning Market Net Revenue Share, By Business segments, 2023 (%)
Figure 173 Company 13Terrestrial Laser Scanning Market Net Sales Share, By Geography, 2023 (%)
Figure 174 Company 14 Terrestrial Laser Scanning Market Net Revenue, By Years, 2023-2030* ($)
Figure 175 Company 14 Terrestrial Laser Scanning Market Net Revenue Share, By Business segments, 2023 (%)
Figure 176 Company 14 Terrestrial Laser Scanning Market Net Sales Share, By Geography, 2023 (%)
Figure 177 Company 15 Terrestrial Laser Scanning Market Net Revenue, By Years, 2023-2030* ($)
Figure 178 Company 15 Terrestrial Laser Scanning Market Net Revenue Share, By Business segments, 2023 (%)
Figure 179 Company 15 Terrestrial Laser Scanning Market Net Sales Share, By Geography, 2023 (%)