 Email
Email Print
Print


Food Traceability market is expected to reach $18,528 million by 2023, registering a CAGR of 9.1% from 2018-2023. Food traceability comprise the ability to identify and validate various stages of food chain from production to distribution. It involves recognizing the origin of food and its destination, from where it will be distributed to end users. This system is essential for food investigations and is crucial in global food trade as multi ingredient food includes materials from variety of food chain and countries.
What is Food Traceability Market?
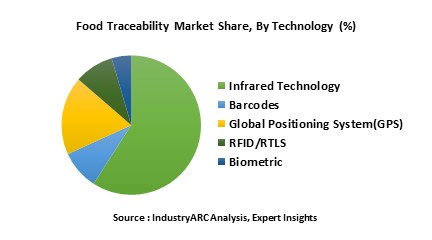
Food traceability system maintains the record of the flow of products which are actually meant for human consumption throughout the production process. Since food production and the distribution is a complex process the companies consider food traceability system as the best tool to solve all the food-related challenges. Food traceability helps the companies to make fresh food products available to their consumers, thereby helping in reducing food-borne diseases. In many countries, such as the US and UK, consumers are ready to pay more for products having a food traceability and point-of-origin certificate. Technologies such as infrared, RFID, biometrics, barcode, NFC and sensors have made food traceability convenient for companies in the food industry.
As food production consists of various stages, including sourcing seeds & fertilizers, farming, harvesting, processing, storage, transportation and retail sales, there are risks associated in it such as contamination, making it imperative to have a food traceability system. The procedures involved during this process include identification, link, records of information, collection & storage of information and verification.
What are the major applications for Food Traceability market?
The various end users assessed includes Food manufacturers, Warehouse/Pack farms, Food retailers, Defense and security departments and other Government departments. Food traceability market in retailers are used to achieve internal and external traceability. Internal traceability allows the company to follow the product through the system after receiving the receipt from the supplier whereas the external traceability allows for the connection with immediate supply chain partner.
Market Research and Market Trends of Food Traceability Nitride Ecosystem
- Companies are investing in research and developing new hardware and software tracing technologies like GS1-128 barcode which as the capability to capture more traceable data such as batch number, lot number, sell by date, Use date. The Company have to make sure that all DCs in their supply chain are capturing and storing all the dynamic information carried in the bar code.
- Another prevailing trend in the food tracing industry would be digital supply chain in which technologies like predictive analytics, better visibility over the movement of goods and robotics help the warehouse and distribution centers to trace food efficiently.
- Warehouse managers have designed a warehouse management system with radio frequency guns restricting the person to pick a wrong product. In case the person picks up a wrong product, a specially designed gun gives a beep indicating wrong product is picked up.
- The transportation management system would be digitized which was handled manually initially. This is achieved by using the systems own parameters, standards, data points and expectations, the retailers can give its suppliers specific delivery time frames using cloud based interconnected solution. This will not only streamlined the scheduling process, but it will also give the tremendous amount of tracking information and data that we don’t have before.
Who are the Major Players in Food tracing system?
The companies referred in the market research report includes Honeywell International Inc, C.H. Robinson INC, Dupoint Nutrition & Health, Intermec Inc, Motorola solutions, Cognex Corporation, MASS Group, Bio-Rad Laboratories, IBM Corp, Zebra Technologies and more than 10 other companies.
What is our report scope?
The report incorporates in-depth assessment of the competitive landscape, product market sizing, product benchmarking, market trends, product developments, financial analysis, strategic analysis and so on to gauge the impact forces and potential opportunities of the market. Apart from this the report also includes a study of major developments in the market such as product launches, agreements, acquisitions, collaborations, mergers and so on to comprehend the prevailing market dynamics at present and its impact during the forecast period 2018-2024.
All our reports are customizable to your company needs to a certain extent, we do provide 20 free consulting hours along with purchase of each report, and this will allow you to request any additional data to customize the report to your needs.
Key Takeaways from this Report
- Evaluate market potential through analyzing growth rates (CAGR %), Volume (Units) and Value ($M) data given at country level – for product types, end use applications and by different industry verticals.
- Understand the different dynamics influencing the market – key driving factors, challenges and hidden opportunities.
- Get in-depth insights on your competitor performance – market shares, strategies, financial benchmarking, product benchmarking, SWOT and more.
- Analyze the sales and distribution channels across key geographies to improve top-line revenues.
- Understand the industry supply chain with a deep-dive on the value augmentation at each step, in order to optimize value and bring efficiencies in your processes.
- Get a quick outlook on the market entropy – M&A’s, deals, partnerships, product launches of all key players for the past 4 years.
- Evaluate the supply-demand gaps, import-export statistics and regulatory landscape for more than top 20 countries globally for the market.
1. Food Traceability Market - Overview
1.1. Definitions and Scope
2. Food Traceability Market - Executive summary
2.1. Market Revenue, Market Size and Key Trends by Company
2.2. Key Trends by type of Application
2.3. Key Trends segmented by Geography
3. Food Traceability Market
3.1. Comparative analysis
3.1.1. Product Benchmarking - Top 10 companies
3.1.2. Top 5 Financials Analysis
3.1.3. Market Value split by Top 10 companies
3.1.4. Patent Analysis - Top 10 companies
3.1.5. Pricing Analysis
4. Food Traceability Market – Startup companies Scenario Premium
4.1. Top 10 startup company Analysis by
4.1.1. Investment
4.1.2. Revenue
4.1.3. Market Shares
4.1.4. Market Size and Application Analysis
4.1.5. Venture Capital and Funding Scenario
5. Food Traceability Market – Industry Market Entry Scenario Premium
5.1. Regulatory Framework Overview
5.2. New Business and Ease of Doing business index
5.3. Case studies of successful ventures
5.4. Customer Analysis – Top 10 companies
6. Food Traceability Market Forces
6.1. Drivers
6.2. Constraints
6.3. Challenges
6.4. Porters five force model
6.4.1. Bargaining power of suppliers
6.4.2. Bargaining powers of customers
6.4.3. Threat of new entrants
6.4.4. Rivalry among existing players
6.4.5. Threat of substitutes
7. Food Traceability Market - Strategic analysis
7.1. Value chain analysis
7.2. Opportunities analysis
7.3. Product life cycle
7.4. Suppliers and distributors Market Share
8. Food Traceability Market – By Equipment (Market Size -$Million / $Billion)
8.1. Market Size and Market Share Analysis
8.2. Application Revenue and Trend Research
8.3. Product Segment Analysis
8.3.1. Thermal printers
8.3.2. Sensors
8.3.3. Tags and labels
9. Food Traceability Market – By Technology (Market Size -$Million / $Billion)
9.1. Introduction
9.2. Infrared Technology
9.3. Barcode
9.4. Global positioning system(GPS)
9.5. RFID/RTLS
9.6. Biometric
9.7. NFC
10. Food Traceability Market – By Application (Market Size -$Million / $Billion)
10.1. Introduction
10.2. Fresh food Produce
10.3. Dairy Food
10.4. Meat and poultry
10.4.1. Red Meat
10.4.2. Sea Food
10.5. Beverages
10.6. Others
11. Food Traceability – By End Use Industry(Market Size -$Million / $Billion)
11.1. Segment type Size and Market Share Analysis
11.2. Application Revenue and Trends by type of Application
11.3. Application Segment Analysis by Type
11.3.1. Introduction
11.3.2. Food retailers
11.3.3. Warehouse
11.3.4. Government departments
11.3.5. Farmers
11.3.6. Others
12. Food Traceability - By Geography (Market Size -$Million / $Billion)
12.1. Food Traceability Market - North America Segment Research
12.2. North America Market Research (Million / $Billion)
12.2.1. Segment type Size and Market Size Analysis
12.2.2. Revenue and Trends
12.2.3. Application Revenue and Trends by type of Application
12.2.4. Company Revenue and Product Analysis
12.2.5. North America Product type and Application Market Size
12.2.5.1. U.S.
12.2.5.2. Canada
12.2.5.3. Mexico
12.2.5.4. Rest of North America
12.3. Food Traceability - South America Segment Research
12.4. South America Market Research (Market Size -$Million / $Billion)
12.4.1. Segment type Size and Market Size Analysis
12.4.2. Revenue and Trends
12.4.3. Application Revenue and Trends by type of Application
12.4.4. Company Revenue and Product Analysis
12.4.5. South America Product type and Application Market Size
12.4.5.1. Brazil
12.4.5.2. Venezuela
12.4.5.3. Argentina
12.4.5.4. Ecuador
12.4.5.5. Peru
12.4.5.6. Colombia
12.4.5.7. Costa Rica
12.4.5.8. Rest of South America
12.5. Food Traceability - Europe Segment Research
12.6. Europe Market Research (Market Size -$Million / $Billion)
12.6.1. Segment type Size and Market Size Analysis
12.6.2. Revenue and Trends
12.6.3. Application Revenue and Trends by type of Application
12.6.4. Company Revenue and Product Analysis
12.6.5. Europe Segment Product type and Application Market Size
12.6.5.1. U.K
12.6.5.2. Germany
12.6.5.3. Italy
12.6.5.4. France
12.6.5.5. Netherlands
12.6.5.6. Belgium
12.6.5.7. Spain
12.6.5.8. Denmark
12.6.5.9. Rest of Europe
12.7. Food Traceability – APAC Segment Research
12.8. APAC Market Research (Market Size -$Million / $Billion)
12.8.1. Segment type Size and Market Size Analysis
12.8.2. Revenue and Trends
12.8.3. Application Revenue and Trends by type of Application
12.8.4. Company Revenue and Product Analysis
12.8.5. APAC Segment – Product type and Application Market Size
12.8.5.1. China
12.8.5.2. Australia
12.8.5.3. Japan
12.8.5.4. South Korea
12.8.5.5. India
12.8.5.6. Taiwan
12.8.5.7. Malaysia
13. Food Traceability Market - Entropy
13.1. New product launches
13.2. M&A's, collaborations, JVs and partnerships
14. Food Traceability Market – Industry / Segment Competition landscape Premium
14.1. Market Share Analysis
14.1.1. Market Share by Country- Top companies
14.1.2. Market Share by Region- Top 10 companies
14.1.3. Market Share by type of Application – Top 10 companies
14.1.4. Market Share by type of Product / Product category- Top 10 companies
14.1.5. Market Share at global level- Top 10 companies
14.1.6. Best Practises for companies
15. Food Traceability Market – Key Company List by Country Premium
16. Food Traceability Market Company Analysis
16.1. Market Share, Company Revenue, Products, M&A, Developments
16.2. Honeywell International Inc
16.3. C.H. Robinson Inc
16.4. Dupoint Nutrition & Health
16.5. Intermec Inc
16.6. Motorola Solutions
16.7. Cognex Corporation
16.8. MASS Group
16.9. Bio-Rad Laboratories
16.10. IBM Corp
16.11. Zebra Technologies
16.12. Company 11
16.13. Company 12
16.14. Company 13 and More
"*Financials would be provided on a best efforts basis for private companies"
17. Food Traceability Market - Appendix
17.1. Abbreviations
17.2. Sources
18. Food Traceability Market - Methodology
18.1. Research Methodology
18.1.1. Company Expert Interviews
18.1.2. Industry Databases
18.1.3. Associations
18.1.4. Company News
18.1.5. Company Annual Reports
18.1.6. Application Trends
18.1.7. New Products and Product database
18.1.8. Company Transcripts
18.1.9. R&D Trends
18.1.10. Key Opinion Leaders Interviews
18.1.11. Supply and Demand Trends
List of Tables:
Table 1: Food Traceability Market Overview 2021-2026
Table 2: Food Traceability Market Leader Analysis 2018-2019 (US$)
Table 3: Food Traceability Market Product Analysis 2018-2019 (US$)
Table 4: Food Traceability Market End User Analysis 2018-2019 (US$)
Table 5: Food Traceability Market Patent Analysis 2013-2018* (US$)
Table 6: Food Traceability Market Financial Analysis 2018-2019 (US$)
Table 7: Food Traceability Market Driver Analysis 2018-2019 (US$)
Table 8: Food Traceability Market Challenges Analysis 2018-2019 (US$)
Table 9: Food Traceability Market Constraint Analysis 2018-2019 (US$)
Table 10: Food Traceability Market Supplier Bargaining Power Analysis 2018-2019 (US$)
Table 11: Food Traceability Market Buyer Bargaining Power Analysis 2018-2019 (US$)
Table 12: Food Traceability Market Threat of Substitutes Analysis 2018-2019 (US$)
Table 13: Food Traceability Market Threat of New Entrants Analysis 2018-2019 (US$)
Table 14: Food Traceability Market Degree of Competition Analysis 2018-2019 (US$)
Table 15: Food Traceability Market Value Chain Analysis 2018-2019 (US$)
Table 16: Food Traceability Market Pricing Analysis 2021-2026 (US$)
Table 17: Food Traceability Market Opportunities Analysis 2021-2026 (US$)
Table 18: Food Traceability Market Product Life Cycle Analysis 2021-2026 (US$)
Table 19: Food Traceability Market Supplier Analysis 2018-2019 (US$)
Table 20: Food Traceability Market Distributor Analysis 2018-2019 (US$)
Table 21: Food Traceability Market Trend Analysis 2018-2019 (US$)
Table 22: Food Traceability Market Size 2018 (US$)
Table 23: Food Traceability Market Forecast Analysis 2021-2026 (US$)
Table 24: Food Traceability Market Sales Forecast Analysis 2021-2026 (Units)
Table 25: Food Traceability Market, Revenue & Volume, By Equipment, 2021-2026 ($)
Table 26: Food Traceability Market By Equipment, Revenue & Volume, By Thermal printers, 2021-2026 ($)
Table 27: Food Traceability Market By Equipment, Revenue & Volume, By Sensors, 2021-2026 ($)
Table 28: Food Traceability Market By Equipment, Revenue & Volume, By Tags and labels, 2021-2026 ($)
Table 29: Food Traceability Market, Revenue & Volume, By Technology, 2021-2026 ($)
Table 30: Food Traceability Market By Technology, Revenue & Volume, By Infrared Technology, 2021-2026 ($)
Table 31: Food Traceability Market By Technology, Revenue & Volume, By Barcode, 2021-2026 ($)
Table 32: Food Traceability Market By Technology, Revenue & Volume, By Global positioning system(GPS), 2021-2026 ($)
Table 33: Food Traceability Market By Technology, Revenue & Volume, By RFID/RTLS, 2021-2026 ($)
Table 34: Food Traceability Market By Technology, Revenue & Volume, By Biometric, 2021-2026 ($)
Table 35: Food Traceability Market, Revenue & Volume, By Application, 2021-2026 ($)
Table 36: Food Traceability Market By Application, Revenue & Volume, By Fresh food Produce, 2021-2026 ($)
Table 37: Food Traceability Market By Application, Revenue & Volume, By Dairy Food, 2021-2026 ($)
Table 38: Food Traceability Market By Application, Revenue & Volume, By Meat and poultry, 2021-2026 ($)
Table 39: Food Traceability Market By Application, Revenue & Volume, By Beverages, 2021-2026 ($)
Table 40: Food Traceability Market, Revenue & Volume, By End User, 2021-2026 ($)
Table 41: Food Traceability Market By End User, Revenue & Volume, By Food retailers, 2021-2026 ($)
Table 42: Food Traceability Market By End User, Revenue & Volume, By Warehouse, 2021-2026 ($)
Table 43: Food Traceability Market By End User, Revenue & Volume, By Government departments, 2021-2026 ($)
Table 44: Food Traceability Market By End User, Revenue & Volume, By Farmers, 2021-2026 ($)
Table 45: North America Food Traceability Market, Revenue & Volume, By Equipment, 2021-2026 ($)
Table 46: North America Food Traceability Market, Revenue & Volume, By Technology, 2021-2026 ($)
Table 47: North America Food Traceability Market, Revenue & Volume, By Application, 2021-2026 ($)
Table 48: North America Food Traceability Market, Revenue & Volume, By End User, 2021-2026 ($)
Table 49: South america Food Traceability Market, Revenue & Volume, By Equipment, 2021-2026 ($)
Table 50: South america Food Traceability Market, Revenue & Volume, By Technology, 2021-2026 ($)
Table 51: South america Food Traceability Market, Revenue & Volume, By Application, 2021-2026 ($)
Table 52: South america Food Traceability Market, Revenue & Volume, By End User, 2021-2026 ($)
Table 53: Europe Food Traceability Market, Revenue & Volume, By Equipment, 2021-2026 ($)
Table 54: Europe Food Traceability Market, Revenue & Volume, By Technology, 2021-2026 ($)
Table 55: Europe Food Traceability Market, Revenue & Volume, By Application, 2021-2026 ($)
Table 56: Europe Food Traceability Market, Revenue & Volume, By End User, 2021-2026 ($)
Table 57: APAC Food Traceability Market, Revenue & Volume, By Equipment, 2021-2026 ($)
Table 58: APAC Food Traceability Market, Revenue & Volume, By Technology, 2021-2026 ($)
Table 59: APAC Food Traceability Market, Revenue & Volume, By Application, 2021-2026 ($)
Table 60: APAC Food Traceability Market, Revenue & Volume, By End User, 2021-2026 ($)
Table 61: Middle East & Africa Food Traceability Market, Revenue & Volume, By Equipment, 2021-2026 ($)
Table 62: Middle East & Africa Food Traceability Market, Revenue & Volume, By Technology, 2021-2026 ($)
Table 63: Middle East & Africa Food Traceability Market, Revenue & Volume, By Application, 2021-2026 ($)
Table 64: Middle East & Africa Food Traceability Market, Revenue & Volume, By End User, 2021-2026 ($)
Table 65: Russia Food Traceability Market, Revenue & Volume, By Equipment, 2021-2026 ($)
Table 66: Russia Food Traceability Market, Revenue & Volume, By Technology, 2021-2026 ($)
Table 67: Russia Food Traceability Market, Revenue & Volume, By Application, 2021-2026 ($)
Table 68: Russia Food Traceability Market, Revenue & Volume, By End User, 2021-2026 ($)
Table 69: Israel Food Traceability Market, Revenue & Volume, By Equipment, 2021-2026 ($)
Table 70: Israel Food Traceability Market, Revenue & Volume, By Technology, 2021-2026 ($)
Table 71: Israel Food Traceability Market, Revenue & Volume, By Application, 2021-2026 ($)
Table 72: Israel Food Traceability Market, Revenue & Volume, By End User, 2021-2026 ($)
Table 73: Top Companies 2018 (US$) Food Traceability Market, Revenue & Volume
Table 74: Product Launch 2018-2019 Food Traceability Market, Revenue & Volume
Table 75: Mergers & Acquistions 2018-2019 Food Traceability Market, Revenue & Volume
List of Figures:
Figure 1: Overview of Food Traceability Market 2021-2026
Figure 2: Market Share Analysis for Food Traceability Market 2018 (US$)
Figure 3: Product Comparison in Food Traceability Market 2018-2019 (US$)
Figure 4: End User Profile for Food Traceability Market 2018-2019 (US$)
Figure 5: Patent Application and Grant in Food Traceability Market 2013-2018* (US$)
Figure 6: Top 5 Companies Financial Analysis in Food Traceability Market 2018-2019 (US$)
Figure 7: Market Entry Strategy in Food Traceability Market 2018-2019
Figure 8: Ecosystem Analysis in Food Traceability Market 2018
Figure 9: Average Selling Price in Food Traceability Market 2021-2026
Figure 10: Top Opportunites in Food Traceability Market 2018-2019
Figure 11: Market Life Cycle Analysis in Food Traceability Market
Figure 12: GlobalBy Equipment Food Traceability Market Revenue, 2021-2026 ($)
Figure 13: GlobalBy Technology Food Traceability Market Revenue, 2021-2026 ($)
Figure 14: GlobalBy Application Food Traceability Market Revenue, 2021-2026 ($)
Figure 15: GlobalBy End User Food Traceability Market Revenue, 2021-2026 ($)
Figure 16: Global Food Traceability Market - By Geography
Figure 17: Global Food Traceability Market Value & Volume, By Geography, 2021-2026 ($)
Figure 18: Global Food Traceability Market CAGR, By Geography, 2021-2026 (%)
Figure 19: North America Food Traceability Market Value & Volume, 2021-2026 ($)
Figure 20: US Food Traceability Market Value & Volume, 2021-2026 ($)
Figure 21: US GDP and Population, 2018-2019 ($)
Figure 22: US GDP – Composition of 2018, By Sector of Origin
Figure 23: US Export and Import Value & Volume, 2018-2019 ($)
Figure 24: Canada Food Traceability Market Value & Volume, 2021-2026 ($)
Figure 25: Canada GDP and Population, 2018-2019 ($)
Figure 26: Canada GDP – Composition of 2018, By Sector of Origin
Figure 27: Canada Export and Import Value & Volume, 2018-2019 ($)
Figure 28: Mexico Food Traceability Market Value & Volume, 2021-2026 ($)
Figure 29: Mexico GDP and Population, 2018-2019 ($)
Figure 30: Mexico GDP – Composition of 2018, By Sector of Origin
Figure 31: Mexico Export and Import Value & Volume, 2018-2019 ($)
Figure 32: South America Food Traceability Market Value & Volume, 2021-2026 ($)
Figure 33: Brazil Food Traceability Market Value & Volume, 2021-2026 ($)
Figure 34: Brazil GDP and Population, 2018-2019 ($)
Figure 35: Brazil GDP – Composition of 2018, By Sector of Origin
Figure 36: Brazil Export and Import Value & Volume, 2018-2019 ($)
Figure 37: Venezuela Food Traceability Market Value & Volume, 2021-2026 ($)
Figure 38: Venezuela GDP and Population, 2018-2019 ($)
Figure 39: Venezuela GDP – Composition of 2018, By Sector of Origin
Figure 40: Venezuela Export and Import Value & Volume, 2018-2019 ($)
Figure 41: Argentina Food Traceability Market Value & Volume, 2021-2026 ($)
Figure 42: Argentina GDP and Population, 2018-2019 ($)
Figure 43: Argentina GDP – Composition of 2018, By Sector of Origin
Figure 44: Argentina Export and Import Value & Volume, 2018-2019 ($)
Figure 45: Ecuador Food Traceability Market Value & Volume, 2021-2026 ($)
Figure 46: Ecuador GDP and Population, 2018-2019 ($)
Figure 47: Ecuador GDP – Composition of 2018, By Sector of Origin
Figure 48: Ecuador Export and Import Value & Volume, 2018-2019 ($)
Figure 49: Peru Food Traceability Market Value & Volume, 2021-2026 ($)
Figure 50: Peru GDP and Population, 2018-2019 ($)
Figure 51: Peru GDP – Composition of 2018, By Sector of Origin
Figure 52: Peru Export and Import Value & Volume, 2018-2019 ($)
Figure 53: Colombia Food Traceability Market Value & Volume, 2021-2026 ($)
Figure 54: Colombia GDP and Population, 2018-2019 ($)
Figure 55: Colombia GDP – Composition of 2018, By Sector of Origin
Figure 56: Colombia Export and Import Value & Volume, 2018-2019 ($)
Figure 57: Costa Rica Food Traceability Market Value & Volume, 2021-2026 ($)
Figure 58: Costa Rica GDP and Population, 2018-2019 ($)
Figure 59: Costa Rica GDP – Composition of 2018, By Sector of Origin
Figure 60: Costa Rica Export and Import Value & Volume, 2018-2019 ($)
Figure 61: Europe Food Traceability Market Value & Volume, 2021-2026 ($)
Figure 62: U.K Food Traceability Market Value & Volume, 2021-2026 ($)
Figure 63: U.K GDP and Population, 2018-2019 ($)
Figure 64: U.K GDP – Composition of 2018, By Sector of Origin
Figure 65: U.K Export and Import Value & Volume, 2018-2019 ($)
Figure 66: Germany Food Traceability Market Value & Volume, 2021-2026 ($)
Figure 67: Germany GDP and Population, 2018-2019 ($)
Figure 68: Germany GDP – Composition of 2018, By Sector of Origin
Figure 69: Germany Export and Import Value & Volume, 2018-2019 ($)
Figure 70: Italy Food Traceability Market Value & Volume, 2021-2026 ($)
Figure 71: Italy GDP and Population, 2018-2019 ($)
Figure 72: Italy GDP – Composition of 2018, By Sector of Origin
Figure 73: Italy Export and Import Value & Volume, 2018-2019 ($)
Figure 74: France Food Traceability Market Value & Volume, 2021-2026 ($)
Figure 75: France GDP and Population, 2018-2019 ($)
Figure 76: France GDP – Composition of 2018, By Sector of Origin
Figure 77: France Export and Import Value & Volume, 2018-2019 ($)
Figure 78: Netherlands Food Traceability Market Value & Volume, 2021-2026 ($)
Figure 79: Netherlands GDP and Population, 2018-2019 ($)
Figure 80: Netherlands GDP – Composition of 2018, By Sector of Origin
Figure 81: Netherlands Export and Import Value & Volume, 2018-2019 ($)
Figure 82: Belgium Food Traceability Market Value & Volume, 2021-2026 ($)
Figure 83: Belgium GDP and Population, 2018-2019 ($)
Figure 84: Belgium GDP – Composition of 2018, By Sector of Origin
Figure 85: Belgium Export and Import Value & Volume, 2018-2019 ($)
Figure 86: Spain Food Traceability Market Value & Volume, 2021-2026 ($)
Figure 87: Spain GDP and Population, 2018-2019 ($)
Figure 88: Spain GDP – Composition of 2018, By Sector of Origin
Figure 89: Spain Export and Import Value & Volume, 2018-2019 ($)
Figure 90: Denmark Food Traceability Market Value & Volume, 2021-2026 ($)
Figure 91: Denmark GDP and Population, 2018-2019 ($)
Figure 92: Denmark GDP – Composition of 2018, By Sector of Origin
Figure 93: Denmark Export and Import Value & Volume, 2018-2019 ($)
Figure 94: APAC Food Traceability Market Value & Volume, 2021-2026 ($)
Figure 95: China Food Traceability Market Value & Volume, 2021-2026
Figure 96: China GDP and Population, 2018-2019 ($)
Figure 97: China GDP – Composition of 2018, By Sector of Origin
Figure 98: China Export and Import Value & Volume, 2018-2019 ($) Food Traceability Market China Export and Import Value & Volume, 2018-2019 ($)
Figure 99: Australia Food Traceability Market Value & Volume, 2021-2026 ($)
Figure 100: Australia GDP and Population, 2018-2019 ($)
Figure 101: Australia GDP – Composition of 2018, By Sector of Origin
Figure 102: Australia Export and Import Value & Volume, 2018-2019 ($)
Figure 103: South Korea Food Traceability Market Value & Volume, 2021-2026 ($)
Figure 104: South Korea GDP and Population, 2018-2019 ($)
Figure 105: South Korea GDP – Composition of 2018, By Sector of Origin
Figure 106: South Korea Export and Import Value & Volume, 2018-2019 ($)
Figure 107: India Food Traceability Market Value & Volume, 2021-2026 ($)
Figure 108: India GDP and Population, 2018-2019 ($)
Figure 109: India GDP – Composition of 2018, By Sector of Origin
Figure 110: India Export and Import Value & Volume, 2018-2019 ($)
Figure 111: Taiwan Food Traceability Market Value & Volume, 2021-2026 ($)
Figure 112: Taiwan GDP and Population, 2018-2019 ($)
Figure 113: Taiwan GDP – Composition of 2018, By Sector of Origin
Figure 114: Taiwan Export and Import Value & Volume, 2018-2019 ($)
Figure 115: Malaysia Food Traceability Market Value & Volume, 2021-2026 ($)
Figure 116: Malaysia GDP and Population, 2018-2019 ($)
Figure 117: Malaysia GDP – Composition of 2018, By Sector of Origin
Figure 118: Malaysia Export and Import Value & Volume, 2018-2019 ($)
Figure 119: Hong Kong Food Traceability Market Value & Volume, 2021-2026 ($)
Figure 120: Hong Kong GDP and Population, 2018-2019 ($)
Figure 121: Hong Kong GDP – Composition of 2018, By Sector of Origin
Figure 122: Hong Kong Export and Import Value & Volume, 2018-2019 ($)
Figure 123: Middle East & Africa Food Traceability Market Middle East & Africa 3D Printing Market Value & Volume, 2021-2026 ($)
Figure 124: Russia Food Traceability Market Value & Volume, 2021-2026 ($)
Figure 125: Russia GDP and Population, 2018-2019 ($)
Figure 126: Russia GDP – Composition of 2018, By Sector of Origin
Figure 127: Russia Export and Import Value & Volume, 2018-2019 ($)
Figure 128: Israel Food Traceability Market Value & Volume, 2021-2026 ($)
Figure 129: Israel GDP and Population, 2018-2019 ($)
Figure 130: Israel GDP – Composition of 2018, By Sector of Origin
Figure 131: Israel Export and Import Value & Volume, 2018-2019 ($)
Figure 132: Entropy Share, By Strategies, 2018-2019* (%) Food Traceability Market
Figure 133: Developments, 2018-2019* Food Traceability Market
Figure 134: Company 1 Food Traceability Market Net Revenue, By Years, 2018-2019* ($)
Figure 135: Company 1 Food Traceability Market Net Revenue Share, By Business segments, 2018 (%)
Figure 136: Company 1 Food Traceability Market Net Sales Share, By Geography, 2018 (%)
Figure 137: Company 2 Food Traceability Market Net Revenue, By Years, 2018-2019* ($)
Figure 138: Company 2 Food Traceability Market Net Revenue Share, By Business segments, 2018 (%)
Figure 139: Company 2 Food Traceability Market Net Sales Share, By Geography, 2018 (%)
Figure 140: Company 3 Food Traceability Market Net Revenue, By Years, 2018-2019* ($)
Figure 141: Company 3 Food Traceability Market Net Revenue Share, By Business segments, 2018 (%)
Figure 142: Company 3 Food Traceability Market Net Sales Share, By Geography, 2018 (%)
Figure 143: Company 4 Food Traceability Market Net Revenue, By Years, 2018-2019* ($)
Figure 144: Company 4 Food Traceability Market Net Revenue Share, By Business segments, 2018 (%)
Figure 145: Company 4 Food Traceability Market Net Sales Share, By Geography, 2018 (%)
Figure 146: Company 5 Food Traceability Market Net Revenue, By Years, 2018-2019* ($)
Figure 147: Company 5 Food Traceability Market Net Revenue Share, By Business segments, 2018 (%)
Figure 148: Company 5 Food Traceability Market Net Sales Share, By Geography, 2018 (%)
Figure 149: Company 6 Food Traceability Market Net Revenue, By Years, 2018-2019* ($)
Figure 150: Company 6 Food Traceability Market Net Revenue Share, By Business segments, 2018 (%)
Figure 151: Company 6 Food Traceability Market Net Sales Share, By Geography, 2018 (%)
Figure 152: Company 7 Food Traceability Market Net Revenue, By Years, 2018-2019* ($)
Figure 153: Company 7 Food Traceability Market Net Revenue Share, By Business segments, 2018 (%)
Figure 154: Company 7 Food Traceability Market Net Sales Share, By Geography, 2018 (%)
Figure 155: Company 8 Food Traceability Market Net Revenue, By Years, 2018-2019* ($)
Figure 156: Company 8 Food Traceability Market Net Revenue Share, By Business segments, 2018 (%)
Figure 157: Company 8 Food Traceability Market Net Sales Share, By Geography, 2018 (%)
Figure 158: Company 9 Food Traceability Market Net Revenue, By Years, 2018-2019* ($)
Figure 159: Company 9 Food Traceability Market Net Revenue Share, By Business segments, 2018 (%)
Figure 160: Company 9 Food Traceability Market Net Sales Share, By Geography, 2018 (%)
Figure 161: Company 10 Food Traceability Market Net Revenue, By Years, 2018-2019* ($)
Figure 162: Company 10 Food Traceability Market Net Revenue Share, By Business segments, 2018 (%)
Figure 163: Company 10 Food Traceability Market Net Sales Share, By Geography, 2018 (%)
Figure 164: Company 11 Food Traceability Market Net Revenue, By Years, 2018-2019* ($)
Figure 165: Company 11 Food Traceability Market Net Revenue Share, By Business segments, 2018 (%)
Figure 166: Company 11 Food Traceability Market Net Sales Share, By Geography, 2018 (%)
Figure 167: Company 12 Food Traceability Market Net Revenue, By Years, 2018-2019* ($)
Figure 168: Company 12 Food Traceability Market Net Revenue Share, By Business segments, 2018 (%)
Figure 169: Company 12 Food Traceability Market Net Sales Share, By Geography, 2018 (%)
Figure 170: Company 13 Food Traceability Market Net Revenue, By Years, 2018-2019* ($)
Figure 171: Company 13 Food Traceability Market Net Revenue Share, By Business segments, 2018 (%)
Figure 172: Company 13 Food Traceability Market Net Sales Share, By Geography, 2018 (%)
Figure 173: Company 14 Food Traceability Market Net Revenue, By Years, 2018-2019* ($)
Figure 174: Company 14 Food Traceability Market Net Revenue Share, By Business segments, 2018 (%)
Figure 175: Company 14 Food Traceability Market Net Sales Share, By Geography, 2018 (%)
Figure 176: Company 15 Food Traceability Market Net Revenue, By Years, 2018-2019* ($)
Figure 177: Company 15 Food Traceability Market Net Revenue Share, By Business segments, 2018 (%)
Figure 178: Company 15 Food Traceability Market Net Sales Share, By Geography, 2018 (%)