 Email
Email Print
Print


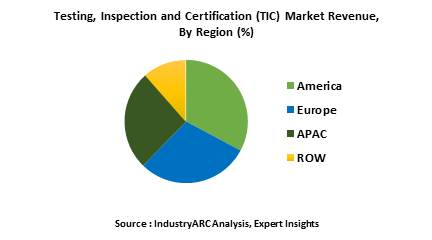
Testing, Inspection & Certification Market - Forecast(2024 - 2030)
Testing, inspection & certification (TIC) enhance the manufacturing productivity, and aid manufactures to align the conformity of the product with respect to global standards, and increase the quality of their products. The global testing, inspection, certification services Market is estimated to surpass $117.8 billion and is estimated to grow at a CAGR 5.07% during 2018-2023.
What is Testing, Inspection, and Certification?
Advent of new technologies, increasing health safety measure, stringent environment norms have changed the entire industry outlook entirely with respect to the compliance of norms and regulations which ensure the safety of the individual, machines, buildings, etc. TIC plays a significant role to ensure products, infrastructure, services are met with the suggested standards and regulations in terms of safety and quality.
What are the major applications for Testing, Inspection, and Certification?
The major application for testing, inspection and certification are quality and safety services, product performance evaluation, certification and valuation of shipments, production evaluation, valuation of imports with respect to standards, industrial inspections, maintenance turnarounds, system certification, supplier evaluation, laboratory outsourcing and others.
Market Research and Market Trends of & Testing, Inspection Certification
- Leading players in the TIC industry are utilizing Big Data and digital processing improvements to pull data from many different sources, without the integration challenges of the past. These are best placed to offer a premium service to their customers.
- Digital inspection, integrated sensors and predictive maintenance are replacing physical inspection. These further help operators to enter new markets, embed client relationships raise margins, and provide growth opportunities.
- TIC service is now avoiding labor work and being transformed to Drones for crop management and asset integrity. With this inspection, costs can be reduced and inspection can be tailored to the areas interpreted by the inspector in real time. Hence, automating the process slowly.
- Bureau veritas a leading player in the industry will acquire a 65% of equity stake in McKenzie group. With this transaction Bureau veritas will have the leadership position in building & construction services in Australia.
Who are the Major Players in Testing, Inspection Certification?
The companies referred in the market research report includes SGS group, Bureau Veritas SA, Intertek group PLC, DNV GL group, DEKRA SC, Eurofins, TUV SUD, TUV Nord group.
What is our report scope?
The report incorporates in-depth assessment of the competitive landscape, product market sizing, product benchmarking, market trends, product developments, financial analysis, strategic analysis and so on to gauge the impact forces and potential opportunities of the market. Apart from this the report also includes a study of major developments in the market such as product launches, agreements, acquisitions, collaborations, mergers and so on to comprehend the prevailing market dynamics at present and its impact during the forecast period 2018-2024.
All our reports are customizable to your company needs to a certain extent, we do provide 20 free consulting hours along with purchase of each report, and this will allow you to request any additional data to customize the report to your needs.
Key Takeaways from this Report
- Evaluate market potential through analyzing growth rates (CAGR %), Volume (Units) and Value ($M) data given at country level – for product types, end use applications and by different industry verticals.
- Understand the different dynamics influencing the market – key driving factors, challenges and hidden opportunities.
- Get in-depth insights on your competitor performance – market shares, strategies, financial benchmarking, product benchmarking, SWOT and more.
- Analyze the sales and distribution channels across key geographies to improve top-line revenues.
- Understand the industry supply chain with a deep-dive on the value augmentation at each step, in order to optimize value and bring efficiencies in your processes.
- Get a quick outlook on the market entropy – M&A’s, deals, partnerships, product launches of all key players for the past 4 years.
- Evaluate the supply-demand gaps, import-export statistics and regulatory landscape for more than top 20 countries globally for the market.
1. Testing, Inspection & Certification Market - Overview
1.1. Definitions and Scope
2. Testing, Inspection & Certification Market - Executive summary
2.1. Market Revenue, Market Size and Key Trends by Company
2.2. Key Trends by type of Application
2.3. Key Trends segmented by Geography
3. Testing, Inspection & Certification Market
3.1. Comparative analysis
3.1.1. Product Benchmarking - Top 10 companies
3.1.2. Top 5 Financials Analysis
3.1.3. Market Value split by Top 10 companies
3.1.4. Patent Analysis - Top 10 companies
3.1.5. Pricing Analysis
4. Testing, Inspection & Certification Market – Startup companies Scenario Premium
4.1. Top 10 startup company Analysis by
4.1.1. Investment
4.1.2. Revenue
4.1.3. Market Shares
4.1.4. Market Size and Application Analysis
4.1.5. Venture Capital and Funding Scenario
5. Testing, Inspection & Certification Market – Industry Market Entry Scenario Premium
5.1. Regulatory Framework Overview
5.2. New Business and Ease of Doing business index
5.3. Case studies of successful ventures
5.4. Customer Analysis – Top 10 companies
6. Testing, Inspection & Certification Market Forces
6.1. Drivers
6.2. Constraints
6.3. Challenges
6.4. Porters five force model
6.4.1. Bargaining power of suppliers
6.4.2. Bargaining powers of customers
6.4.3. Threat of new entrants
6.4.4. Rivalry among existing players
6.4.5. Threat of substitutes
7. Testing, Inspection & Certification Market -Strategic analysis
7.1. Value chain analysis
7.2. Opportunities analysis
7.3. Product life cycle
7.4. Suppliers and distributors Market Share
8. Testing, Inspection & Certification Market – By Type (Market Size -$Million / $Billion)
8.1. Market Size and Market Share Analysis
8.2. Application Revenue and Trend Research
8.3. Product Segment Analysis
8.3.1. In-House
8.3.2. Outsourced
9. Testing, Inspection & Certification Market – By Type of Service (Market Size -$Million / $Billion)
9.1. Testing Service
9.2. Inspection Service
9.3. Certification Service
10. Testing, Inspection & Certification Market – By Testing Methodology (Market Size -$Million / $Billion)
10.1. External Condition
10.1.1. Visual Testing
10.1.2. Magnetic Particle Testing
10.1.3. Eddy Current Testing
10.1.4. Penetrant Testing
10.2. Internal Condition
10.2.1. Ultrasonic Testing
10.2.2. Radiographic Testing
10.2.3. Leakage Testing
10.3. Others
11. Testing, Inspection & Certification Market – By Applications (Market Size -$Million / $Billion)
11.1. Quality and Safety Services
11.2. Product Performance Evaluation
11.3. Certification and Valuation of Shipments
11.4. Production Evaluation
11.5. Valuation of imports with respect to standards
11.6. Industrial Inspections
11.6.1. Maintenance Turnarounds
11.6.2. System Certification
11.6.3. Supplier Evaluation
11.6.4. Laboratory Outsourcing
11.6.5. Others
11.7. Others
12. Testing, Inspection & Certification – By End Use Industry(Market Size -$Million / $Billion)
12.1. Segment type Size and Market Share Analysis
12.2. Application Revenue and Trends by type of Application
12.3. Application Segment Analysis by Type
12.3.1. Agriculture
12.3.2. Automotive
12.3.3. Aerospace and Defense
12.3.4. Food
12.3.5. Consumer
12.3.6. Medicine & Life Science
12.3.7. Oil and Gas
12.3.8. System Compliance
12.3.9. Marine
12.3.10. Mining
12.3.11. Manufacturing
12.3.12. Chemicals
12.3.13. Energy and Power
12.3.14. Building & infrastructure
12.3.15. Industrial equipment
12.3.16. Retail
12.3.17. Rail
12.3.18. Logistics
12.3.19. others
13. Testing, Inspection & Certification - By Geography (Market Size -$Million / $Billion)
13.1. Testing, Inspection & Certification Market - North America Segment Research
13.2. North America Market Research (Million / $Billion)
13.2.1. Segment type Size and Market Size Analysis
13.2.2. Revenue and Trends
13.2.3. Application Revenue and Trends by type of Application
13.2.4. Company Revenue and Product Analysis
13.2.5. North America Product type and Application Market Size
13.2.5.1. U.S.
13.2.5.2. Canada
13.2.5.3. Mexico
13.2.5.4. Rest of North America
13.3. Testing, Inspection & Certification - South America Segment Research
13.4. South America Market Research (Market Size -$Million / $Billion)
13.4.1. Segment type Size and Market Size Analysis
13.4.2. Revenue and Trends
13.4.3. Application Revenue and Trends by type of Application
13.4.4. Company Revenue and Product Analysis
13.4.5. South America Product type and Application Market Size
13.4.5.1. Brazil
13.4.5.2. Venezuela
13.4.5.3. Argentina
13.4.5.4. Ecuador
13.4.5.5. Peru
13.4.5.6. Colombia
13.4.5.7. Costa Rica
13.4.5.8. Rest of South America
13.5. Testing, Inspection & Certification - Europe Segment Research
13.6. Europe Market Research (Market Size -$Million / $Billion)
13.6.1. Segment type Size and Market Size Analysis
13.6.2. Revenue and Trends
13.6.3. Application Revenue and Trends by type of Application
13.6.4. Company Revenue and Product Analysis
13.6.5. Europe Segment Product type and Application Market Size
13.6.5.1. U.K
13.6.5.2. Germany
13.6.5.3. Italy
13.6.5.4. France
13.6.5.5. Netherlands
13.6.5.6. Belgium
13.6.5.7. Spain
13.6.5.8. Denmark
13.6.5.9. Rest of Europe
13.7. Testing, Inspection & Certification – APAC Segment Research
13.8. APAC Market Research (Market Size -$Million / $Billion)
13.8.1. Segment type Size and Market Size Analysis
13.8.2. Revenue and Trends
13.8.3. Application Revenue and Trends by type of Application
13.8.4. Company Revenue and Product Analysis
13.8.5. APAC Segment – Product type and Application Market Size
13.8.5.1. China
13.8.5.2. Australia
13.8.5.3. Japan
13.8.5.4. South Korea
13.8.5.5. India
13.8.5.6. Taiwan
13.8.5.7. Malaysia
14. Testing, Inspection & Certification Market - Entropy
14.1. New product launches
14.2. M&A's, collaborations, JVs and partnerships
15. Testing, Inspection & Certification Market – Industry / Segment Competition landscape Premium
15.1. Market Share Analysis
15.1.1. Market Share by Country- Top companies
15.1.2. Market Share by Region- Top 10 companies
15.1.3. Market Share by type of Application – Top 10 companies
15.1.4. Market Share by type of Product / Product category- Top 10 companies
15.1.5. Market Share at global level- Top 10 companies
15.1.6. Best Practises for companies
16. Testing, Inspection & Certification Market – Key Company List by Country Premium
17. Testing, Inspection & Certification Market Company Analysis
17.1. Market Share, Company Revenue, Products, M&A, Developments
17.2. SGS group
17.3. Bureau Veritas SA
17.4. Intertek group PLC
17.5. DNV GL group
17.6. DEKRA SC
17.7. Eurofins
17.8. TUV SUD
17.9. TUV Nord group
17.10. Company 9
17.11. Company 10
17.12. Company 11
17.13. Company 12
17.14. Company 13
17.15. Company 14 and more
"*Financials would be provided on a best efforts basis for private companies"
18. Testing, Inspection & Certification Market -Appendix
18.1. Abbreviations
18.2. Sources
19. Testing, Inspection & Certification Market -Methodology Premium
19.1. Research Methodology
19.1.1. Company Expert Interviews
19.1.2. Industry Databases
19.1.3. Associations
19.1.4. Company News
19.1.5. Company Annual Reports
19.1.6. Application Trends
19.1.7. New Products and Product database
19.1.8. Company Transcripts
19.1.9. R&D Trends
19.1.10. Key Opinion Leaders Interviews
19.1.11. Supply and Demand Trends
List of Tables
Table1 Testing, Inspection & Certification Market Overview 2021-2026
Table2 Testing, Inspection & Certification Market Leader Analysis 2018-2019 (US$)
Table3 Testing, Inspection & Certification MarketProduct Analysis 2018-2019 (US$)
Table4 Testing, Inspection & Certification MarketEnd User Analysis 2018-2019 (US$)
Table5 Testing, Inspection & Certification MarketPatent Analysis 2013-2018* (US$)
Table6 Testing, Inspection & Certification MarketFinancial Analysis 2018-2019 (US$)
Table7 Testing, Inspection & Certification Market Driver Analysis 2018-2019 (US$)
Table8 Testing, Inspection & Certification MarketChallenges Analysis 2018-2019 (US$)
Table9 Testing, Inspection & Certification MarketConstraint Analysis 2018-2019 (US$)
Table10 Testing, Inspection & Certification Market Supplier Bargaining Power Analysis 2018-2019 (US$)
Table11 Testing, Inspection & Certification Market Buyer Bargaining Power Analysis 2018-2019 (US$)
Table12 Testing, Inspection & Certification Market Threat of Substitutes Analysis 2018-2019 (US$)
Table13 Testing, Inspection & Certification Market Threat of New Entrants Analysis 2018-2019 (US$)
Table14 Testing, Inspection & Certification Market Degree of Competition Analysis 2018-2019 (US$)
Table15 Testing, Inspection & Certification MarketValue Chain Analysis 2018-2019 (US$)
Table16 Testing, Inspection & Certification MarketPricing Analysis 2021-2026 (US$)
Table17 Testing, Inspection & Certification MarketOpportunities Analysis 2021-2026 (US$)
Table18 Testing, Inspection & Certification MarketProduct Life Cycle Analysis 2021-2026 (US$)
Table19 Testing, Inspection & Certification MarketSupplier Analysis 2018-2019 (US$)
Table20 Testing, Inspection & Certification MarketDistributor Analysis 2018-2019 (US$)
Table21 Testing, Inspection & Certification Market Trend Analysis 2018-2019 (US$)
Table22 Testing, Inspection & Certification Market Size 2018 (US$)
Table23 Testing, Inspection & Certification Market Forecast Analysis 2021-2026 (US$)
Table24 Testing, Inspection & Certification Market Sales Forecast Analysis 2021-2026 (Units)
Table25 Testing, Inspection & Certification Market, Revenue & Volume,By Type, 2021-2026 ($)
Table26 Testing, Inspection & Certification MarketBy Type, Revenue & Volume,By In-House, 2021-2026 ($)
Table27 Testing, Inspection & Certification MarketBy Type, Revenue & Volume,By Outsourced, 2021-2026 ($)
Table28 Testing, Inspection & Certification Market, Revenue & Volume,By Type of Service, 2021-2026 ($)
Table29 Testing, Inspection & Certification MarketBy Type of Service, Revenue & Volume,By Testing Service, 2021-2026 ($)
Table30 Testing, Inspection & Certification MarketBy Type of Service, Revenue & Volume,By Inspection Service, 2021-2026 ($)
Table31 Testing, Inspection & Certification MarketBy Type of Service, Revenue & Volume,By Certification Service, 2021-2026 ($)
Table32 Testing, Inspection & Certification Market, Revenue & Volume,By Testing Methodology, 2021-2026 ($)
Table33 Testing, Inspection & Certification MarketBy Testing Methodology, Revenue & Volume,By External Condition, 2021-2026 ($)
Table34 Testing, Inspection & Certification MarketBy Testing Methodology, Revenue & Volume,By Internal Condition, 2021-2026 ($)
Table35 Testing, Inspection & Certification Market, Revenue & Volume,By Application, 2021-2026 ($)
Table36 Testing, Inspection & Certification MarketBy Application, Revenue & Volume,By Quality and Safety Services, 2021-2026 ($)
Table37 Testing, Inspection & Certification MarketBy Application, Revenue & Volume,By Product Performance Evaluation, 2021-2026 ($)
Table38 Testing, Inspection & Certification MarketBy Application, Revenue & Volume,By Certification and Valuation of Shipments, 2021-2026 ($)
Table39 Testing, Inspection & Certification MarketBy Application, Revenue & Volume,By Production Evaluation, 2021-2026 ($)
Table40 Testing, Inspection & Certification MarketBy Application, Revenue & Volume,By Valuation of imports with respect to standards, 2021-2026 ($)
Table41 Testing, Inspection & Certification Market, Revenue & Volume,By End Use, 2021-2026 ($)
Table42 Testing, Inspection & Certification MarketBy End Use, Revenue & Volume,By Agriculture, 2021-2026 ($)
Table43 Testing, Inspection & Certification MarketBy End Use, Revenue & Volume,By Automotive, 2021-2026 ($)
Table44 Testing, Inspection & Certification MarketBy End Use, Revenue & Volume,By Aerospace and Defense, 2021-2026 ($)
Table45 Testing, Inspection & Certification MarketBy End Use, Revenue & Volume,By Food, 2021-2026 ($)
Table46 Testing, Inspection & Certification MarketBy End Use, Revenue & Volume,By Consumer, 2021-2026 ($)
Table47 North America Testing, Inspection & Certification Market, Revenue & Volume,By Type, 2021-2026 ($)
Table48 North America Testing, Inspection & Certification Market, Revenue & Volume,By Type of Service, 2021-2026 ($)
Table49 North America Testing, Inspection & Certification Market, Revenue & Volume,By Testing Methodology, 2021-2026 ($)
Table50 North America Testing, Inspection & Certification Market, Revenue & Volume,By Application, 2021-2026 ($)
Table51 North America Testing, Inspection & Certification Market, Revenue & Volume,By End Use, 2021-2026 ($)
Table52 South america Testing, Inspection & Certification Market, Revenue & Volume,By Type, 2021-2026 ($)
Table53 South america Testing, Inspection & Certification Market, Revenue & Volume,By Type of Service, 2021-2026 ($)
Table54 South america Testing, Inspection & Certification Market, Revenue & Volume,By Testing Methodology, 2021-2026 ($)
Table55 South america Testing, Inspection & Certification Market, Revenue & Volume,By Application, 2021-2026 ($)
Table56 South america Testing, Inspection & Certification Market, Revenue & Volume,By End Use, 2021-2026 ($)
Table57 Europe Testing, Inspection & Certification Market, Revenue & Volume,By Type, 2021-2026 ($)
Table58 Europe Testing, Inspection & Certification Market, Revenue & Volume,By Type of Service, 2021-2026 ($)
Table59 Europe Testing, Inspection & Certification Market, Revenue & Volume,By Testing Methodology, 2021-2026 ($)
Table60 Europe Testing, Inspection & Certification Market, Revenue & Volume,By Application, 2021-2026 ($)
Table61 Europe Testing, Inspection & Certification Market, Revenue & Volume,By End Use, 2021-2026 ($)
Table62 APAC Testing, Inspection & Certification Market, Revenue & Volume,By Type, 2021-2026 ($)
Table63 APAC Testing, Inspection & Certification Market, Revenue & Volume,By Type of Service, 2021-2026 ($)
Table64 APAC Testing, Inspection & Certification Market, Revenue & Volume,By Testing Methodology, 2021-2026 ($)
Table65 APAC Testing, Inspection & Certification Market, Revenue & Volume,By Application, 2021-2026 ($)
Table66 APAC Testing, Inspection & Certification Market, Revenue & Volume,By End Use, 2021-2026 ($)
Table67 Middle East & Africa Testing, Inspection & Certification Market, Revenue & Volume,By Type, 2021-2026 ($)
Table68 Middle East & Africa Testing, Inspection & Certification Market, Revenue & Volume,By Type of Service, 2021-2026 ($)
Table69 Middle East & Africa Testing, Inspection & Certification Market, Revenue & Volume,By Testing Methodology, 2021-2026 ($)
Table70 Middle East & Africa Testing, Inspection & Certification Market, Revenue & Volume,By Application, 2021-2026 ($)
Table71 Middle East & Africa Testing, Inspection & Certification Market, Revenue & Volume,By End Use, 2021-2026 ($)
Table72 Russia Testing, Inspection & Certification Market, Revenue & Volume,By Type, 2021-2026 ($)
Table73 Russia Testing, Inspection & Certification Market, Revenue & Volume,By Type of Service, 2021-2026 ($)
Table74 Russia Testing, Inspection & Certification Market, Revenue & Volume,By Testing Methodology, 2021-2026 ($)
Table75 Russia Testing, Inspection & Certification Market, Revenue & Volume,By Application, 2021-2026 ($)
Table76 Russia Testing, Inspection & Certification Market, Revenue & Volume,By End Use, 2021-2026 ($)
Table77 Israel Testing, Inspection & Certification Market, Revenue & Volume,By Type, 2021-2026 ($)
Table78 Israel Testing, Inspection & Certification Market, Revenue & Volume,By Type of Service, 2021-2026 ($)
Table79 Israel Testing, Inspection & Certification Market, Revenue & Volume,By Testing Methodology, 2021-2026 ($)
Table80 Israel Testing, Inspection & Certification Market, Revenue & Volume,By Application, 2021-2026 ($)
Table81 Israel Testing, Inspection & Certification Market, Revenue & Volume,By End Use, 2021-2026 ($)
Table82 Top Companies 2018 (US$)Testing, Inspection & Certification Market, Revenue & Volume,,
Table83 Product Launch 2018-2019Testing, Inspection & Certification Market, Revenue & Volume,,
Table84 Mergers & Acquistions 2018-2019Testing, Inspection & Certification Market, Revenue & Volume,,
List of Figures
Figure 1 Overview of Testing, Inspection & Certification Market 2021-2026
Figure 2 Market Share Analysis for Testing, Inspection & Certification Market 2018 (US$)
Figure 3 Product Comparison in Testing, Inspection & Certification Market 2018-2019 (US$)
Figure 4 End User Profile for Testing, Inspection & Certification Market 2018-2019 (US$)
Figure 5 Patent Application and Grant in Testing, Inspection & Certification Market 2013-2018* (US$)
Figure 6 Top 5 Companies Financial Analysis in Testing, Inspection & Certification Market 2018-2019 (US$)
Figure 7 Market Entry Strategy in Testing, Inspection & Certification Market 2018-2019
Figure 8 Ecosystem Analysis in Testing, Inspection & Certification Market2018
Figure 9 Average Selling Price in Testing, Inspection & Certification Market 2021-2026
Figure 10 Top Opportunites in Testing, Inspection & Certification Market 2018-2019
Figure 11 Market Life Cycle Analysis in Testing, Inspection & Certification Market
Figure 12 GlobalBy TypeTesting, Inspection & Certification Market Revenue, 2021-2026 ($)
Figure 13 GlobalBy Type of ServiceTesting, Inspection & Certification Market Revenue, 2021-2026 ($)
Figure 14 GlobalBy Testing MethodologyTesting, Inspection & Certification Market Revenue, 2021-2026 ($)
Figure 15 GlobalBy ApplicationTesting, Inspection & Certification Market Revenue, 2021-2026 ($)
Figure 16 GlobalBy End UseTesting, Inspection & Certification Market Revenue, 2021-2026 ($)
Figure 17 Global Testing, Inspection & Certification Market - By Geography
Figure 18 Global Testing, Inspection & Certification Market Value & Volume, By Geography, 2021-2026 ($)
Figure 19 Global Testing, Inspection & Certification Market CAGR, By Geography, 2021-2026 (%)
Figure 20 North America Testing, Inspection & Certification Market Value & Volume, 2021-2026 ($)
Figure 21 US Testing, Inspection & Certification Market Value & Volume, 2021-2026 ($)
Figure 22 US GDP and Population, 2018-2019 ($)
Figure 23 US GDP – Composition of 2018, By Sector of Origin
Figure 24 US Export and Import Value & Volume, 2018-2019 ($)
Figure 25 Canada Testing, Inspection & Certification Market Value & Volume, 2021-2026 ($)
Figure 26 Canada GDP and Population, 2018-2019 ($)
Figure 27 Canada GDP – Composition of 2018, By Sector of Origin
Figure 28 Canada Export and Import Value & Volume, 2018-2019 ($)
Figure 29 Mexico Testing, Inspection & Certification Market Value & Volume, 2021-2026 ($)
Figure 30 Mexico GDP and Population, 2018-2019 ($)
Figure 31 Mexico GDP – Composition of 2018, By Sector of Origin
Figure 32 Mexico Export and Import Value & Volume, 2018-2019 ($)
Figure 33 South America Testing, Inspection & Certification MarketSouth America 3D Printing Market Value & Volume, 2021-2026 ($)
Figure 34 Brazil Testing, Inspection & Certification Market Value & Volume, 2021-2026 ($)
Figure 35 Brazil GDP and Population, 2018-2019 ($)
Figure 36 Brazil GDP – Composition of 2018, By Sector of Origin
Figure 37 Brazil Export and Import Value & Volume, 2018-2019 ($)
Figure 38 Venezuela Testing, Inspection & Certification Market Value & Volume, 2021-2026 ($)
Figure 39 Venezuela GDP and Population, 2018-2019 ($)
Figure 40 Venezuela GDP – Composition of 2018, By Sector of Origin
Figure 41 Venezuela Export and Import Value & Volume, 2018-2019 ($)
Figure 42 Argentina Testing, Inspection & Certification Market Value & Volume, 2021-2026 ($)
Figure 43 Argentina GDP and Population, 2018-2019 ($)
Figure 44 Argentina GDP – Composition of 2018, By Sector of Origin
Figure 45 Argentina Export and Import Value & Volume, 2018-2019 ($)
Figure 46 Ecuador Testing, Inspection & Certification Market Value & Volume, 2021-2026 ($)
Figure 47 Ecuador GDP and Population, 2018-2019 ($)
Figure 48 Ecuador GDP – Composition of 2018, By Sector of Origin
Figure 49 Ecuador Export and Import Value & Volume, 2018-2019 ($)
Figure 50 Peru Testing, Inspection & Certification Market Value & Volume, 2021-2026 ($)
Figure 51 Peru GDP and Population, 2018-2019 ($)
Figure 52 Peru GDP – Composition of 2018, By Sector of Origin
Figure 53 Peru Export and Import Value & Volume, 2018-2019 ($)
Figure 54 Colombia Testing, Inspection & Certification Market Value & Volume, 2021-2026 ($)
Figure 55 Colombia GDP and Population, 2018-2019 ($)
Figure 56 Colombia GDP – Composition of 2018, By Sector of Origin
Figure 57 Colombia Export and Import Value & Volume, 2018-2019 ($)
Figure 58 Costa Rica Testing, Inspection & Certification MarketCosta Rica 3D Printing Market Value & Volume, 2021-2026 ($)
Figure 59 Costa Rica GDP and Population, 2018-2019 ($)
Figure 60 Costa Rica GDP – Composition of 2018, By Sector of Origin
Figure 61 Costa Rica Export and Import Value & Volume, 2018-2019 ($)
Figure 62 Europe Testing, Inspection & Certification Market Value & Volume, 2021-2026 ($)
Figure 63 U.K Testing, Inspection & Certification Market Value & Volume, 2021-2026 ($)
Figure 64 U.K GDP and Population, 2018-2019 ($)
Figure 65 U.K GDP – Composition of 2018, By Sector of Origin
Figure 66 U.K Export and Import Value & Volume, 2018-2019 ($)
Figure 67 Germany Testing, Inspection & Certification Market Value & Volume, 2021-2026 ($)
Figure 68 Germany GDP and Population, 2018-2019 ($)
Figure 69 Germany GDP – Composition of 2018, By Sector of Origin
Figure 70 Germany Export and Import Value & Volume, 2018-2019 ($)
Figure 71 Italy Testing, Inspection & Certification Market Value & Volume, 2021-2026 ($)
Figure 72 Italy GDP and Population, 2018-2019 ($)
Figure 73 Italy GDP – Composition of 2018, By Sector of Origin
Figure 74 Italy Export and Import Value & Volume, 2018-2019 ($)
Figure 75 France Testing, Inspection & Certification Market Value & Volume, 2021-2026 ($)
Figure 76 France GDP and Population, 2018-2019 ($)
Figure 77 France GDP – Composition of 2018, By Sector of Origin
Figure 78 France Export and Import Value & Volume, 2018-2019 ($)
Figure 79 Netherlands Testing, Inspection & Certification Market Value & Volume, 2021-2026 ($)
Figure 80 Netherlands GDP and Population, 2018-2019 ($)
Figure 81 Netherlands GDP – Composition of 2018, By Sector of Origin
Figure 82 Netherlands Export and Import Value & Volume, 2018-2019 ($)
Figure 83 Belgium Testing, Inspection & Certification Market Value & Volume, 2021-2026 ($)
Figure 84 Belgium GDP and Population, 2018-2019 ($)
Figure 85 Belgium GDP – Composition of 2018, By Sector of Origin
Figure 86 Belgium Export and Import Value & Volume, 2018-2019 ($)
Figure 87 Spain Testing, Inspection & Certification Market Value & Volume, 2021-2026 ($)
Figure 88 Spain GDP and Population, 2018-2019 ($)
Figure 89 Spain GDP – Composition of 2018, By Sector of Origin
Figure 90 Spain Export and Import Value & Volume, 2018-2019 ($)
Figure 91 Denmark Testing, Inspection & Certification Market Value & Volume, 2021-2026 ($)
Figure 92 Denmark GDP and Population, 2018-2019 ($)
Figure 93 Denmark GDP – Composition of 2018, By Sector of Origin
Figure 94 Denmark Export and Import Value & Volume, 2018-2019 ($)
Figure 95 APAC Testing, Inspection & Certification Market Value & Volume, 2021-2026 ($)
Figure 96 China Testing, Inspection & Certification MarketValue & Volume, 2021-2026
Figure 97 China GDP and Population, 2018-2019 ($)
Figure 98 China GDP – Composition of 2018, By Sector of Origin
Figure 99 China Export and Import Value & Volume, 2018-2019 ($)Testing, Inspection & Certification MarketChina Export and Import Value & Volume, 2018-2019 ($)
Figure 100 Australia Testing, Inspection & Certification Market Value & Volume, 2021-2026 ($)
Figure 101 Australia GDP and Population, 2018-2019 ($)
Figure 102 Australia GDP – Composition of 2018, By Sector of Origin
Figure 103 Australia Export and Import Value & Volume, 2018-2019 ($)
Figure 104 South Korea Testing, Inspection & Certification Market Value & Volume, 2021-2026 ($)
Figure 105 South Korea GDP and Population, 2018-2019 ($)
Figure 106 South Korea GDP – Composition of 2018, By Sector of Origin
Figure 107 South Korea Export and Import Value & Volume, 2018-2019 ($)
Figure 108 India Testing, Inspection & Certification Market Value & Volume, 2021-2026 ($)
Figure 109 India GDP and Population, 2018-2019 ($)
Figure 110 India GDP – Composition of 2018, By Sector of Origin
Figure 111 India Export and Import Value & Volume, 2018-2019 ($)
Figure 112 Taiwan Testing, Inspection & Certification MarketTaiwan 3D Printing Market Value & Volume, 2021-2026 ($)
Figure 113 Taiwan GDP and Population, 2018-2019 ($)
Figure 114 Taiwan GDP – Composition of 2018, By Sector of Origin
Figure 115 Taiwan Export and Import Value & Volume, 2018-2019 ($)
Figure 116 Malaysia Testing, Inspection & Certification MarketMalaysia 3D Printing Market Value & Volume, 2021-2026 ($)
Figure 117 Malaysia GDP and Population, 2018-2019 ($)
Figure 118 Malaysia GDP – Composition of 2018, By Sector of Origin
Figure 119 Malaysia Export and Import Value & Volume, 2018-2019 ($)
Figure 120 Hong Kong Testing, Inspection & Certification MarketHong Kong 3D Printing Market Value & Volume, 2021-2026 ($)
Figure 121 Hong Kong GDP and Population, 2018-2019 ($)
Figure 122 Hong Kong GDP – Composition of 2018, By Sector of Origin
Figure 123 Hong Kong Export and Import Value & Volume, 2018-2019 ($)
Figure 124 Middle East & Africa Testing, Inspection & Certification MarketMiddle East & Africa 3D Printing Market Value & Volume, 2021-2026 ($)
Figure 125 Russia Testing, Inspection & Certification MarketRussia 3D Printing Market Value & Volume, 2021-2026 ($)
Figure 126 Russia GDP and Population, 2018-2019 ($)
Figure 127 Russia GDP – Composition of 2018, By Sector of Origin
Figure 128 Russia Export and Import Value & Volume, 2018-2019 ($)
Figure 129 Israel Testing, Inspection & Certification Market Value & Volume, 2021-2026 ($)
Figure 130 Israel GDP and Population, 2018-2019 ($)
Figure 131 Israel GDP – Composition of 2018, By Sector of Origin
Figure 132 Israel Export and Import Value & Volume, 2018-2019 ($)
Figure 133 Entropy Share, By Strategies, 2018-2019* (%)Testing, Inspection & Certification Market
Figure 134 Developments, 2018-2019*Testing, Inspection & Certification Market
Figure 135 Company 1 Testing, Inspection & Certification Market Net Revenue, By Years, 2018-2019* ($)
Figure 136 Company 1 Testing, Inspection & Certification Market Net Revenue Share, By Business segments, 2018 (%)
Figure 137 Company 1 Testing, Inspection & Certification Market Net Sales Share, By Geography, 2018 (%)
Figure 138 Company 2 Testing, Inspection & Certification Market Net Revenue, By Years, 2018-2019* ($)
Figure 139 Company 2 Testing, Inspection & Certification Market Net Revenue Share, By Business segments, 2018 (%)
Figure 140 Company 2 Testing, Inspection & Certification Market Net Sales Share, By Geography, 2018 (%)
Figure 141 Company 3Testing, Inspection & Certification Market Net Revenue, By Years, 2018-2019* ($)
Figure 142 Company 3Testing, Inspection & Certification Market Net Revenue Share, By Business segments, 2018 (%)
Figure 143 Company 3Testing, Inspection & Certification Market Net Sales Share, By Geography, 2018 (%)
Figure 144 Company 4 Testing, Inspection & Certification Market Net Revenue, By Years, 2018-2019* ($)
Figure 145 Company 4 Testing, Inspection & Certification Market Net Revenue Share, By Business segments, 2018 (%)
Figure 146 Company 4 Testing, Inspection & Certification Market Net Sales Share, By Geography, 2018 (%)
Figure 147 Company 5 Testing, Inspection & Certification Market Net Revenue, By Years, 2018-2019* ($)
Figure 148 Company 5 Testing, Inspection & Certification Market Net Revenue Share, By Business segments, 2018 (%)
Figure 149 Company 5 Testing, Inspection & Certification Market Net Sales Share, By Geography, 2018 (%)
Figure 150 Company 6 Testing, Inspection & Certification Market Net Revenue, By Years, 2018-2019* ($)
Figure 151 Company 6 Testing, Inspection & Certification Market Net Revenue Share, By Business segments, 2018 (%)
Figure 152 Company 6 Testing, Inspection & Certification Market Net Sales Share, By Geography, 2018 (%)
Figure 153 Company 7 Testing, Inspection & Certification Market Net Revenue, By Years, 2018-2019* ($)
Figure 154 Company 7 Testing, Inspection & Certification Market Net Revenue Share, By Business segments, 2018 (%)
Figure 155 Company 7 Testing, Inspection & Certification Market Net Sales Share, By Geography, 2018 (%)
Figure 156 Company 8 Testing, Inspection & Certification Market Net Revenue, By Years, 2018-2019* ($)
Figure 157 Company 8 Testing, Inspection & Certification Market Net Revenue Share, By Business segments, 2018 (%)
Figure 158 Company 8 Testing, Inspection & Certification Market Net Sales Share, By Geography, 2018 (%)
Figure 159 Company 9 Testing, Inspection & Certification Market Net Revenue, By Years, 2018-2019* ($)
Figure 160 Company 9 Testing, Inspection & Certification Market Net Revenue Share, By Business segments, 2018 (%)
Figure 161 Company 9 Testing, Inspection & Certification Market Net Sales Share, By Geography, 2018 (%)
Figure 162 Company 10 Testing, Inspection & Certification Market Net Revenue, By Years, 2018-2019* ($)
Figure 163 Company 10 Testing, Inspection & Certification Market Net Revenue Share, By Business segments, 2018 (%)
Figure 164 Company 10 Testing, Inspection & Certification Market Net Sales Share, By Geography, 2018 (%)
Figure 165 Company 11 Testing, Inspection & Certification Market Net Revenue, By Years, 2018-2019* ($)
Figure 166 Company 11 Testing, Inspection & Certification Market Net Revenue Share, By Business segments, 2018 (%)
Figure 167 Company 11 Testing, Inspection & Certification Market Net Sales Share, By Geography, 2018 (%)
Figure 168 Company 12 Testing, Inspection & Certification Market Net Revenue, By Years, 2018-2019* ($)
Figure 169 Company 12 Testing, Inspection & Certification Market Net Revenue Share, By Business segments, 2018 (%)
Figure 170 Company 12 Testing, Inspection & Certification Market Net Sales Share, By Geography, 2018 (%)
Figure 171 Company 13Testing, Inspection & Certification Market Net Revenue, By Years, 2018-2019* ($)
Figure 172 Company 13Testing, Inspection & Certification Market Net Revenue Share, By Business segments, 2018 (%)
Figure 173 Company 13Testing, Inspection & Certification Market Net Sales Share, By Geography, 2018 (%)
Figure 174 Company 14 Testing, Inspection & Certification Market Net Revenue, By Years, 2018-2019* ($)
Figure 175 Company 14 Testing, Inspection & Certification Market Net Revenue Share, By Business segments, 2018 (%)
Figure 176 Company 14 Testing, Inspection & Certification Market Net Sales Share, By Geography, 2018 (%)
Figure 177 Company 15 Testing, Inspection & Certification Market Net Revenue, By Years, 2018-2019* ($)
Figure 178 Company 15 Testing, Inspection & Certification Market Net Revenue Share, By Business segments, 2018 (%)
Figure 179 Company 15 Testing, Inspection & Certification Market Net Sales Share, By Geography, 2018 (%)