 Email
Email Print
Print


Food Ingredients used in Bakeries are known as bakery ingredients. Some of the most commonly used bakery ingredients include baking powder, flour, butter, baking soda, eggs, honey, yeasts, fruits, nuts, additional flavors and flavors enhancers and color additives. These ingredients hold various functionalities like performing emulsification, protein strengthening and maintaining freshness in baked food.
Bakery products like bread are staple food predominantly in North America and Europe. However, these products are gaining prominence inmerging economies of APAC and Latin America owing to the risin preference for packaged food products and strengthening retail chains. The bakery products market was valued at $XX billion in 2015 and is forecast to grow at XX% CAGR in the coming five years.The baking powders & mixes segment accounts for the largest share in the Baking Ingredients Market, followed by oils, fats & shortenings.
The enzymes segment is expected to grow at the highest CAGR in terms of value. ingredients offering similar functionalities are facing competition due to raw material availability and production costs. For instance usage of enzymes in baking restricts the growth of emulsifiers in baking applications.
Baking Ingredients market is segmented by type as emulsifiers, leavening agents,enzymes, starch and many others. The market is also segmented by applications are bread biscuits & cookies, rolls and buns. Increasing demand for convenience foods, functional foods, and baked goods, coupled with the constantly changing lifestyles, has increased the demand for baked products in China and other developing Asian economies.The first biggest region for baking ingredients Market is North America. The key players in the supply chain of baking ingredients are raw material suppliers, government bodies, distributors, food-commodity exporters related to bakery & confectionery, and end users such as baked goods manufacturers.
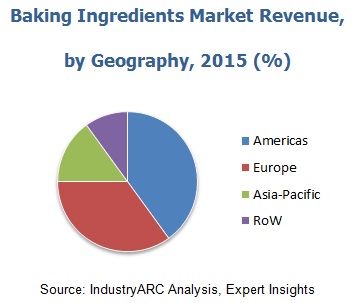
North America is the leading market for baking ingredients market with China being the major contributer. Asia-pacific region is forecast to have highest growth in the next five years due to growing adoption of baking ingredients market. Asia-pacific Baking Industrial markrt accounts to XX% of the global market for Baking Industrial Market and is the fastest growing market followed by Americas. The baking ingredients market, estimated at $XX billion in 2015, is projected to grow at a CAGR of XX% to reach $XX billion by 2021.
Increasing Preference for Packaged Bakery Items in APAC Drives the Baking Ingredients Market
Baking ingredients include baking powder, baking soda, flour, butter, eggs, yeasts, honey, fruits, nuts, and several flavor and color additives. General bakery products include biscuits, cookies, breads, cakes, pastries, pies, torts, donuts, and chalets. Baking ingredients are not just industry specific, but also have many domestic markets scattered around the world.The growth in the bakery ingredients market is directly related to the changing dimensions of the baking industry as a whole.
Breads and cakes are the staple food of the western culture, and not as much relevant in Asia-Pacific. The annual per capita consumption of baked food in these geographies is more than the consumption in the Asia-Pacific region. The bakery market is matured in these countries, but it is expected to grow exponentially in the Asia-Pacific region. India and China have clocked double digit growths in this market recently, and even if the consumption per capita is not set to match the western standards, the population is a key factor for the estimated increase in the market.
Bakery products like bread are staple food predominantly in North America and Europe. However, these products are gaining prominence inmerging economies of APAC and Latin America owing to the risin preference for packaged food products and strengthening retail chains. The bakery products market was valued at $XX billion in 2015 and is forecast to grow at XX% CAGR in the coming five years.The baking powders & mixes segment accounts for the largest share in the Baking Ingredients Market, followed by oils, fats & shortenings.
The enzymes segment is expected to grow at the highest CAGR in terms of value. ingredients offering similar functionalities are facing competition due to raw material availability and production costs. For instance usage of enzymes in baking restricts the growth of emulsifiers in baking applications.
Baking Ingredients market is segmented by type as emulsifiers, leavening agents,enzymes, starch and many others. The market is also segmented by applications are bread biscuits & cookies, rolls and buns. Increasing demand for convenience foods, functional foods, and baked goods, coupled with the constantly changing lifestyles, has increased the demand for baked products in China and other developing Asian economies.The first biggest region for baking ingredients Market is North America. The key players in the supply chain of baking ingredients are raw material suppliers, government bodies, distributors, food-commodity exporters related to bakery & confectionery, and end users such as baked goods manufacturers.
North America is the leading market for baking ingredients market with China being the major contributer. Asia-pacific region is forecast to have highest growth in the next five years due to growing adoption of baking ingredients market. Asia-pacific Baking Industrial markrt accounts to XX% of the global market for Baking Industrial Market and is the fastest growing market followed by Americas. The baking ingredients market, estimated at $XX billion in 2015, is projected to grow at a CAGR of XX% to reach $XX billion by 2021.
Increasing Preference for Packaged Bakery Items in APAC Drives the Baking Ingredients Market
Baking ingredients include baking powder, baking soda, flour, butter, eggs, yeasts, honey, fruits, nuts, and several flavor and color additives. General bakery products include biscuits, cookies, breads, cakes, pastries, pies, torts, donuts, and chalets. Baking ingredients are not just industry specific, but also have many domestic markets scattered around the world.The growth in the bakery ingredients market is directly related to the changing dimensions of the baking industry as a whole.
Breads and cakes are the staple food of the western culture, and not as much relevant in Asia-Pacific. The annual per capita consumption of baked food in these geographies is more than the consumption in the Asia-Pacific region. The bakery market is matured in these countries, but it is expected to grow exponentially in the Asia-Pacific region. India and China have clocked double digit growths in this market recently, and even if the consumption per capita is not set to match the western standards, the population is a key factor for the estimated increase in the market.
Sample Companies Profiled in this Report are:
- British Bakels Limited
- Cargill Incorporated
- Kerry Group PLC
- ROquette Group
- BakeryandSnacks.com
- 10+.
1. Baking Ingredients Market Overview
2. Executive Summary
3. Baking Ingredients Market Landscape
3.1. Market Share Analysis
3.2. Comparative Analysis
3.2.1. Product Benchmarking
3.2.2. End user Profiling
3.2.3. Top 5 Financials Analysis
4. Baking Ingredients Market Forces
4.1. Market Drivers
4.2. Market Constraints & Challenges
4.3. Attractiveness of the Solenoid Valve Industry
4.3.1. Power of Suppliers
4.3.2. Threats From New Entrants
4.3.3. Power of Buyer
4.3.4. Threat From Substitute Product
4.3.5. Degree of Competion
5. Baking Ingredients Market Strategic Analysis
5.1. Baking Ingredients Market - Value Chain Analysis
5.2. Pricing Analysis
5.3. Opportunity Analysis
5.4. Product Life Cycle
5.5. Suppliers and Distributors
6. Baking Ingredients Market-By Type
6.1. Introduction
6.2. Emulsifiers
6.3. Leaveing Agents
6.4. Enzymes
6.5. Baking Powder and Mixes
6.6. Fats & shortenings
6.7. Colors & Flavors
6.8. Dough Conditioners
6.9. Rising Agents
6.10. Starch
6.11. Others
7. Baking Ingredients Market-By Application
7.1. Introduction
7.2. Bread
7.3. Biscuits & Cookies
7.4. Cakes & Pastries
7.5. Rolls & pies
7.6. Buns
7.7. Others
8. Baking Ingredients Market -By Geography
8.1. Americas
8.1.1. U.S.
8.1.2. Canada
8.1.3. Mexico
8.1.4. Brazil
8.1.5. Others
8.2. Asia-pacific
8.2.1. China
8.2.2. South Korea
8.2.3. Japan
8.2.4. India
8.2.5. Others
8.3. Europe
8.3.1. U.K.
8.3.2. Germany
8.3.3. Italy
8.3.4. France
8.3.5. Spain
8.3.6. Rest of Europe
8.4. Rest of The World (ROW)
8.4.1. Middle East
8.4.2. Africa
9. Baking Ingredients Market-Entropy
9.1. New Product Developments
9.2. Mergers and Acquisitions
10. Company Profiles
10.1. Company 1
"*Financials would be provided on a best efforts basis for private companies"
2. Executive Summary
3. Baking Ingredients Market Landscape
3.1. Market Share Analysis
3.2. Comparative Analysis
3.2.1. Product Benchmarking
3.2.2. End user Profiling
3.2.3. Top 5 Financials Analysis
4. Baking Ingredients Market Forces
4.1. Market Drivers
4.2. Market Constraints & Challenges
4.3. Attractiveness of the Solenoid Valve Industry
4.3.1. Power of Suppliers
4.3.2. Threats From New Entrants
4.3.3. Power of Buyer
4.3.4. Threat From Substitute Product
4.3.5. Degree of Competion
5. Baking Ingredients Market Strategic Analysis
5.1. Baking Ingredients Market - Value Chain Analysis
5.2. Pricing Analysis
5.3. Opportunity Analysis
5.4. Product Life Cycle
5.5. Suppliers and Distributors
6. Baking Ingredients Market-By Type
6.1. Introduction
6.2. Emulsifiers
6.3. Leaveing Agents
6.4. Enzymes
6.5. Baking Powder and Mixes
6.6. Fats & shortenings
6.7. Colors & Flavors
6.8. Dough Conditioners
6.9. Rising Agents
6.10. Starch
6.11. Others
7. Baking Ingredients Market-By Application
7.1. Introduction
7.2. Bread
7.3. Biscuits & Cookies
7.4. Cakes & Pastries
7.5. Rolls & pies
7.6. Buns
7.7. Others
8. Baking Ingredients Market -By Geography
8.1. Americas
8.1.1. U.S.
8.1.2. Canada
8.1.3. Mexico
8.1.4. Brazil
8.1.5. Others
8.2. Asia-pacific
8.2.1. China
8.2.2. South Korea
8.2.3. Japan
8.2.4. India
8.2.5. Others
8.3. Europe
8.3.1. U.K.
8.3.2. Germany
8.3.3. Italy
8.3.4. France
8.3.5. Spain
8.3.6. Rest of Europe
8.4. Rest of The World (ROW)
8.4.1. Middle East
8.4.2. Africa
9. Baking Ingredients Market-Entropy
9.1. New Product Developments
9.2. Mergers and Acquisitions
10. Company Profiles
10.1. Company 1
10.2. Company 2
10.3. Company 3
10.4. Company 4
10.5. Company 5
10.6. Company 6
10.7. Company 7
10.8. Company 8
10.9. Company 9
10.10. Company 10
*More than 10 Companies are profiled in this Research Report*"*Financials would be provided on a best efforts basis for private companies"
11. Appendix
11.1. List of Abbreviations
11.2. Sources
11.3. Research Methodology
11.4. Expert Insights
11.5. Disclaimer
List of Tables
Table 1: Baking Ingredients Market Overview 2021-2026
Table 2: Baking Ingredients Market Leader Analysis 2018-2019 (US$)
Table 3: Baking Ingredients Market Product Analysis 2018-2019 (US$)
Table 4: Baking Ingredients Market End User Analysis 2018-2019 (US$)
Table 5: Baking Ingredients Market Patent Analysis 2013-2018* (US$)
Table 6: Baking Ingredients Market Financial Analysis 2018-2019 (US$)
Table 7: Baking Ingredients Market Driver Analysis 2018-2019 (US$)
Table 8: Baking Ingredients Market Challenges Analysis 2018-2019 (US$)
Table 9: Baking Ingredients Market Constraint Analysis 2018-2019 (US$)
Table 10: Baking Ingredients Market Supplier Bargaining Power Analysis 2018-2019 (US$)
Table 11: Baking Ingredients Market Buyer Bargaining Power Analysis 2018-2019 (US$)
Table 12: Baking Ingredients Market Threat of Substitutes Analysis 2018-2019 (US$)
Table 13: Baking Ingredients Market Threat of New Entrants Analysis 2018-2019 (US$)
Table 14: Baking Ingredients Market Degree of Competition Analysis 2018-2019 (US$)
Table 15: Baking Ingredients Market Value Chain Analysis 2018-2019 (US$)
Table 16: Baking Ingredients Market Pricing Analysis 2021-2026 (US$)
Table 17: Baking Ingredients Market Opportunities Analysis 2021-2026 (US$)
Table 18: Baking Ingredients Market Product Life Cycle Analysis 2021-2026 (US$)
Table 19: Baking Ingredients Market Supplier Analysis 2018-2019 (US$)
Table 20: Baking Ingredients Market Distributor Analysis 2018-2019 (US$)
Table 21: Baking Ingredients Market Trend Analysis 2018-2019 (US$)
Table 22: Baking Ingredients Market Size 2018 (US$)
Table 23: Baking Ingredients Market Forecast Analysis 2021-2026 (US$)
Table 24: Baking Ingredients Market Sales Forecast Analysis 2021-2026 (Units)
Table 25: Baking Ingredients Market, Revenue & Volume,By Type, 2021-2026 ($)
Table 26: Baking Ingredients Market By Type, Revenue & Volume,By Emulsifiers, 2021-2026 ($)
Table 27: Baking Ingredients Market By Type, Revenue & Volume,By Leaveing Agents, 2021-2026 ($)
Table 28: Baking Ingredients Market By Type, Revenue & Volume,By Enzymes, 2021-2026 ($)
Table 29: Baking Ingredients Market By Type, Revenue & Volume,By Baking Powder and Mixes, 2021-2026 ($)
Table 30: Baking Ingredients Market By Type, Revenue & Volume,By Fats & shortenings, 2021-2026 ($)
Table 31: Baking Ingredients Market, Revenue & Volume,By Application, 2021-2026 ($)
Table 32: Baking Ingredients Market By Application, Revenue & Volume,By Bread, 2021-2026 ($)
Table 33: Baking Ingredients Market By Application, Revenue & Volume,By Biscuits & Cookies, 2021-2026 ($)
Table 34: Baking Ingredients Market By Application, Revenue & Volume,By Cakes & Pastries, 2021-2026 ($)
Table 35: Baking Ingredients Market By Application, Revenue & Volume,By Rolls & pies, 2021-2026 ($)
Table 36: Baking Ingredients Market By Application, Revenue & Volume,By Buns, 2021-2026 ($)
Table 37: North America Baking Ingredients Market, Revenue & Volume,By Type, 2021-2026 ($)
Table 38: North America Baking Ingredients Market, Revenue & Volume,By Application, 2021-2026 ($)
Table 39: South america Baking Ingredients Market, Revenue & Volume,By Type, 2021-2026 ($)
Table 40: South america Baking Ingredients Market, Revenue & Volume,By Application, 2021-2026 ($)
Table 41: Europe Baking Ingredients Market, Revenue & Volume,By Type, 2021-2026 ($)
Table 42: Europe Baking Ingredients Market, Revenue & Volume,By Application, 2021-2026 ($)
Table 43: APAC Baking Ingredients Market, Revenue & Volume,By Type, 2021-2026 ($)
Table 44: APAC Baking Ingredients Market, Revenue & Volume,By Application, 2021-2026 ($)
Table 45: Middle East & Africa Baking Ingredients Market, Revenue & Volume,By Type, 2021-2026 ($)
Table 46: Middle East & Africa Baking Ingredients Market, Revenue & Volume,By Application, 2021-2026 ($)
Table 47: Russia Baking Ingredients Market, Revenue & Volume,By Type, 2021-2026 ($)
Table 48: Russia Baking Ingredients Market, Revenue & Volume,By Application, 2021-2026 ($)
Table 49: Israel Baking Ingredients Market, Revenue & Volume,By Type, 2021-2026 ($)
Table 50: Israel Baking Ingredients Market, Revenue & Volume,By Application, 2021-2026 ($)
Table 51: Top Companies 2018 (US$)Baking Ingredients Market, Revenue & Volume
Table 52: Product Launch 2018-2019Baking Ingredients Market, Revenue & Volume
Table 53: Mergers & Acquistions 2018-2019Baking Ingredients Market, Revenue & Volume
List of Figures
Figure 1: Overview of Baking Ingredients Market 2021-2026
Figure 2: Market Share Analysis for Baking Ingredients Market 2018 (US$)
Figure 3: Product Comparison in Baking Ingredients Market 2018-2019 (US$)
Figure 4: End User Profile for Baking Ingredients Market 2018-2019 (US$)
Figure 5: Patent Application and Grant in Baking Ingredients Market 2013-2018* (US$)
Figure 6: Top 5 Companies Financial Analysis in Baking Ingredients Market 2018-2019 (US$)
Figure 7: Market Entry Strategy in Baking Ingredients Market 2018-2019
Figure 8: Ecosystem Analysis in Baking Ingredients Market 2018
Figure 9: Average Selling Price in Baking Ingredients Market 2021-2026
Figure 10: Top Opportunites in Baking Ingredients Market 2018-2019
Figure 11: Market Life Cycle Analysis in Baking Ingredients Market
Figure 12: GlobalBy TypeBaking Ingredients Market Revenue, 2021-2026 ($)
Figure 13: GlobalBy ApplicationBaking Ingredients Market Revenue, 2021-2026 ($)
Figure 14: Global Baking Ingredients Market - By Geography
Figure 15: Global Baking Ingredients Market Value & Volume, By Geography, 2021-2026 ($)
Figure 16: Global Baking Ingredients Market CAGR, By Geography, 2021-2026 (%)
Figure 17: North America Baking Ingredients Market Value & Volume, 2021-2026 ($)
Figure 18: US Baking Ingredients Market Value & Volume, 2021-2026 ($)
Figure 19: US GDP and Population, 2018-2019 ($)
Figure 20: US GDP – Composition of 2018, By Sector of Origin
Figure 21: US Export and Import Value & Volume, 2018-2019 ($)
Figure 22: Canada Baking Ingredients Market Value & Volume, 2021-2026 ($)
Figure 23: Canada GDP and Population, 2018-2019 ($)
Figure 24: Canada GDP – Composition of 2018, By Sector of Origin
Figure 25: Canada Export and Import Value & Volume, 2018-2019 ($)
Figure 26: Mexico Baking Ingredients Market Value & Volume, 2021-2026 ($)
Figure 27: Mexico GDP and Population, 2018-2019 ($)
Figure 28: Mexico GDP – Composition of 2018, By Sector of Origin
Figure 29: Mexico Export and Import Value & Volume, 2018-2019 ($)
Figure 30: South America Baking Ingredients Market Value & Volume, 2021-2026 ($)
Figure 31: Brazil Baking Ingredients Market Value & Volume, 2021-2026 ($)
Figure 32: Brazil GDP and Population, 2018-2019 ($)
Figure 33: Brazil GDP – Composition of 2018, By Sector of Origin
Figure 34: Brazil Export and Import Value & Volume, 2018-2019 ($)
Figure 35: Venezuela Baking Ingredients Market Value & Volume, 2021-2026 ($)
Figure 36: Venezuela GDP and Population, 2018-2019 ($)
Figure 37: Venezuela GDP – Composition of 2018, By Sector of Origin
Figure 38: Venezuela Export and Import Value & Volume, 2018-2019 ($)
Figure 39: Argentina Baking Ingredients Market Value & Volume, 2021-2026 ($)
Figure 40: Argentina GDP and Population, 2018-2019 ($)
Figure 41: Argentina GDP – Composition of 2018, By Sector of Origin
Figure 42: Argentina Export and Import Value & Volume, 2018-2019 ($)
Figure 43: Ecuador Baking Ingredients Market Value & Volume, 2021-2026 ($)
Figure 44: Ecuador GDP and Population, 2018-2019 ($)
Figure 45: Ecuador GDP – Composition of 2018, By Sector of Origin
Figure 46: Ecuador Export and Import Value & Volume, 2018-2019 ($)
Figure 47: Peru Baking Ingredients Market Value & Volume, 2021-2026 ($)
Figure 48: Peru GDP and Population, 2018-2019 ($)
Figure 49: Peru GDP – Composition of 2018, By Sector of Origin
Figure 50: Peru Export and Import Value & Volume, 2018-2019 ($)
Figure 51: Colombia Baking Ingredients Market Value & Volume, 2021-2026 ($)
Figure 52: Colombia GDP and Population, 2018-2019 ($)
Figure 53: Colombia GDP – Composition of 2018, By Sector of Origin
Figure 54: Colombia Export and Import Value & Volume, 2018-2019 ($)
Figure 55: Costa Rica Baking Ingredients Market Value & Volume, 2021-2026 ($)
Figure 56: Costa Rica GDP and Population, 2018-2019 ($)
Figure 57: Costa Rica GDP – Composition of 2018, By Sector of Origin
Figure 58: Costa Rica Export and Import Value & Volume, 2018-2019 ($)
Figure 59: Europe Baking Ingredients Market Value & Volume, 2021-2026 ($)
Figure 60: U.K Baking Ingredients Market Value & Volume, 2021-2026 ($)
Figure 61: U.K GDP and Population, 2018-2019 ($)
Figure 62: U.K GDP – Composition of 2018, By Sector of Origin
Figure 63: U.K Export and Import Value & Volume, 2018-2019 ($)
Figure 64: Germany Baking Ingredients Market Value & Volume, 2021-2026 ($)
Figure 65: Germany GDP and Population, 2018-2019 ($)
Figure 66: Germany GDP – Composition of 2018, By Sector of Origin
Figure 67: Germany Export and Import Value & Volume, 2018-2019 ($)
Figure 68: Italy Baking Ingredients Market Value & Volume, 2021-2026 ($)
Figure 69: Italy GDP and Population, 2018-2019 ($)
Figure 70: Italy GDP – Composition of 2018, By Sector of Origin
Figure 71: Italy Export and Import Value & Volume, 2018-2019 ($)
Figure 72: France Baking Ingredients Market Value & Volume, 2021-2026 ($)
Figure 73: France GDP and Population, 2018-2019 ($)
Figure 74: France GDP – Composition of 2018, By Sector of Origin
Figure 75: France Export and Import Value & Volume, 2018-2019 ($)
Figure 76: Netherlands Baking Ingredients Market Value & Volume, 2021-2026 ($)
Figure 77: Netherlands GDP and Population, 2018-2019 ($)
Figure 78: Netherlands GDP – Composition of 2018, By Sector of Origin
Figure 79: Netherlands Export and Import Value & Volume, 2018-2019 ($)
Figure 80: Belgium Baking Ingredients Market Value & Volume, 2021-2026 ($)
Figure 81: Belgium GDP and Population, 2018-2019 ($)
Figure 82: Belgium GDP – Composition of 2018, By Sector of Origin
Figure 83: Belgium Export and Import Value & Volume, 2018-2019 ($)
Figure 84: Spain Baking Ingredients Market Value & Volume, 2021-2026 ($)
Figure 85: Spain GDP and Population, 2018-2019 ($)
Figure 86: Spain GDP – Composition of 2018, By Sector of Origin
Figure 87: Spain Export and Import Value & Volume, 2018-2019 ($)
Figure 88: Denmark Baking Ingredients Market Value & Volume, 2021-2026 ($)
Figure 89: Denmark GDP and Population, 2018-2019 ($)
Figure 90: Denmark GDP – Composition of 2018, By Sector of Origin
Figure 91: Denmark Export and Import Value & Volume, 2018-2019 ($)
Figure 92: APAC Baking Ingredients Market Value & Volume, 2021-2026 ($)
Figure 93: China Baking Ingredients Market Value & Volume, 2021-2026
Figure 94: China GDP and Population, 2018-2019 ($)
Figure 95: China GDP – Composition of 2018, By Sector of Origin
Figure 96: China Export and Import Value & Volume, 2018-2019 ($)Baking Ingredients Market China Export and Import Value & Volume, 2018-2019 ($)
Figure 97: Australia Baking Ingredients Market Value & Volume, 2021-2026 ($)
Figure 98: Australia GDP and Population, 2018-2019 ($)
Figure 99: Australia GDP – Composition of 2018, By Sector of Origin
Figure 100: Australia Export and Import Value & Volume, 2018-2019 ($)
Figure 101: South Korea Baking Ingredients Market Value & Volume, 2021-2026 ($)
Figure 102: South Korea GDP and Population, 2018-2019 ($)
Figure 103: South Korea GDP – Composition of 2018, By Sector of Origin
Figure 104: South Korea Export and Import Value & Volume, 2018-2019 ($)
Figure 105: India Baking Ingredients Market Value & Volume, 2021-2026 ($)
Figure 106: India GDP and Population, 2018-2019 ($)
Figure 107: India GDP – Composition of 2018, By Sector of Origin
Figure 108: India Export and Import Value & Volume, 2018-2019 ($)
Figure 109: Taiwan Baking Ingredients Market Value & Volume, 2021-2026 ($)
Figure 110: Taiwan GDP and Population, 2018-2019 ($)
Figure 111: Taiwan GDP – Composition of 2018, By Sector of Origin
Figure 112: Taiwan Export and Import Value & Volume, 2018-2019 ($)
Figure 113: Malaysia Baking Ingredients Market Value & Volume, 2021-2026 ($)
Figure 114: Malaysia GDP and Population, 2018-2019 ($)
Figure 115: Malaysia GDP – Composition of 2018, By Sector of Origin
Figure 116: Malaysia Export and Import Value & Volume, 2018-2019 ($)
Figure 117: Hong Kong Baking Ingredients Market Value & Volume, 2021-2026 ($)
Figure 118: Hong Kong GDP and Population, 2018-2019 ($)
Figure 119: Hong Kong GDP – Composition of 2018, By Sector of Origin
Figure 120: Hong Kong Export and Import Value & Volume, 2018-2019 ($)
Figure 121: Middle East & Africa Baking Ingredients Market Middle East & Africa 3D Printing Market Value & Volume, 2021-2026 ($)
Figure 122: Russia Baking Ingredients Market Value & Volume, 2021-2026 ($)
Figure 123: Russia GDP and Population, 2018-2019 ($)
Figure 124: Russia GDP – Composition of 2018, By Sector of Origin
Figure 125: Russia Export and Import Value & Volume, 2018-2019 ($)
Figure 126: Israel Baking Ingredients Market Value & Volume, 2021-2026 ($)
Figure 127: Israel GDP and Population, 2018-2019 ($)
Figure 128: Israel GDP – Composition of 2018, By Sector of Origin
Figure 129: Israel Export and Import Value & Volume, 2018-2019 ($)
Figure 130: Entropy Share, By Strategies, 2018-2019* (%)Baking Ingredients Market
Figure 131: Developments, 2018-2019*Baking Ingredients Market
Figure 132: Company 1 Baking Ingredients Market Net Revenue, By Years, 2018-2019* ($)
Figure 133: Company 1 Baking Ingredients Market Net Revenue Share, By Business segments, 2018 (%)
Figure 134: Company 1 Baking Ingredients Market Net Sales Share, By Geography, 2018 (%)
Figure 135: Company 2 Baking Ingredients Market Net Revenue, By Years, 2018-2019* ($)
Figure 136: Company 2 Baking Ingredients Market Net Revenue Share, By Business segments, 2018 (%)
Figure 137: Company 2 Baking Ingredients Market Net Sales Share, By Geography, 2018 (%)
Figure 138: Company 3Baking Ingredients Market Net Revenue, By Years, 2018-2019* ($)
Figure 139: Company 3Baking Ingredients Market Net Revenue Share, By Business segments, 2018 (%)
Figure 140: Company 3Baking Ingredients Market Net Sales Share, By Geography, 2018 (%)
Figure 141: Company 4 Baking Ingredients Market Net Revenue, By Years, 2018-2019* ($)
Figure 142: Company 4 Baking Ingredients Market Net Revenue Share, By Business segments, 2018 (%)
Figure 143: Company 4 Baking Ingredients Market Net Sales Share, By Geography, 2018 (%)
Figure 144: Company 5 Baking Ingredients Market Net Revenue, By Years, 2018-2019* ($)
Figure 145: Company 5 Baking Ingredients Market Net Revenue Share, By Business segments, 2018 (%)
Figure 146: Company 5 Baking Ingredients Market Net Sales Share, By Geography, 2018 (%)
Figure 147: Company 6 Baking Ingredients Market Net Revenue, By Years, 2018-2019* ($)
Figure 148: Company 6 Baking Ingredients Market Net Revenue Share, By Business segments, 2018 (%)
Figure 149: Company 6 Baking Ingredients Market Net Sales Share, By Geography, 2018 (%)
Figure 150: Company 7 Baking Ingredients Market Net Revenue, By Years, 2018-2019* ($)
Figure 151: Company 7 Baking Ingredients Market Net Revenue Share, By Business segments, 2018 (%)
Figure 152: Company 7 Baking Ingredients Market Net Sales Share, By Geography, 2018 (%)
Figure 153: Company 8 Baking Ingredients Market Net Revenue, By Years, 2018-2019* ($)
Figure 154: Company 8 Baking Ingredients Market Net Revenue Share, By Business segments, 2018 (%)
Figure 155: Company 8 Baking Ingredients Market Net Sales Share, By Geography, 2018 (%)
Figure 156: Company 9 Baking Ingredients Market Net Revenue, By Years, 2018-2019* ($)
Figure 157: Company 9 Baking Ingredients Market Net Revenue Share, By Business segments, 2018 (%)
Figure 158: Company 9 Baking Ingredients Market Net Sales Share, By Geography, 2018 (%)
Figure 159: Company 10 Baking Ingredients Market Net Revenue, By Years, 2018-2019* ($)
Figure 160: Company 10 Baking Ingredients Market Net Revenue Share, By Business segments, 2018 (%)
Figure 161: Company 10 Baking Ingredients Market Net Sales Share, By Geography, 2018 (%)
Figure 162: Company 11 Baking Ingredients Market Net Revenue, By Years, 2018-2019* ($)
Figure 163: Company 11 Baking Ingredients Market Net Revenue Share, By Business segments, 2018 (%)
Figure 164: Company 11 Baking Ingredients Market Net Sales Share, By Geography, 2018 (%)
Figure 165: Company 12 Baking Ingredients Market Net Revenue, By Years, 2018-2019* ($)
Figure 166: Company 12 Baking Ingredients Market Net Revenue Share, By Business segments, 2018 (%)
Figure 167: Company 12 Baking Ingredients Market Net Sales Share, By Geography, 2018 (%)
Figure 168: Company 13Baking Ingredients Market Net Revenue, By Years, 2018-2019* ($)
Figure 169: Company 13Baking Ingredients Market Net Revenue Share, By Business segments, 2018 (%)
Figure 170: Company 13Baking Ingredients Market Net Sales Share, By Geography, 2018 (%)
Figure 171: Company 14 Baking Ingredients Market Net Revenue, By Years, 2018-2019* ($)
Figure 172: Company 14 Baking Ingredients Market Net Revenue Share, By Business segments, 2018 (%)
Figure 173: Company 14 Baking Ingredients Market Net Sales Share, By Geography, 2018 (%)
Figure 174: Company 15 Baking Ingredients Market Net Revenue, By Years, 2018-2019* ($)
Figure 175: Company 15 Baking Ingredients Market Net Revenue Share, By Business segments, 2018 (%)
Figure 176: Company 15 Baking Ingredients Market Net Sales Share, By Geography, 2018 (%)