 Email
Email Print
Print


Phosphate Fertilizers Market - Forecast(2024 - 2030)
Fertilizers market has a humungous growth capacity as feeding the growing population is the major challenge. In the recent past, urbanization has become a basic need to survive for any economy. The total world population has increased from a mere 750 million in 1950 to an immense 7.3 billion in 2015. In such a globalized world, there should be enough food for feeding the increasing population. Hence, there is an upsurge in the demand for improving the yield of crops. This impetus has induced the growth of fertilizers market, which is directly related to the agricultural industry. One of the important components of these fertilizers is phosphorous.
Plants require phosphorus for metabolism like growth, utilization of starch, photosynthesis, nucleus formation and cell division to name among a few others. One of the main reasons why phosphorous is necessary for plants is due to its capacity to store energy generated from photosynthesis and the metabolism of carbohydrates, for later use in growth and reproduction. These fertilizers helps a plant convert other nutrients into usable building blocks. Phosphorus is one of the main three nutrients most commonly found in fertilizers. Today there is a range of phosphatic fertilizers available to farmers. Some contain only phosphorus, others contain two or more nutrients. Manufacturers often produce a variety of such fertilizers which contain nitrogen, phosphorus and potassium in various proportions.
Phosphate fertilizers market can be categorized into the type of fertilizers commercially available in the market which include monoammonium phosphate (MAP), diammonium phosphate (DAP), rock phosphate and super phosphate. DAP and super phosphates are the majorly consumed fertilizers among the list of phosphate fertilizers available.
The global market for phosphate fertilizers was estimated to be $XX billion in 2015. The global market for phosphate fertilizers market is estimated to grow at a CAGR of XX% and is forecast to reach $XX billion by 2021. The phosphate fertilizers are forecast to have the highest growth of X% during the forecast period 2016-2021. Americas and Asia alone are estimated to occupy a share of more than XX% during 2016-2021.
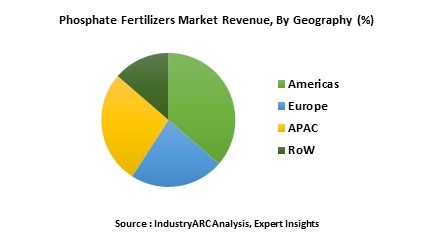
Asia-Pacific is the leading market for phosphate fertilizers. This region is forecast to have highest growth in the next few years owing to the growing adoption of phosphate fertilizers in agricultural applications. The phosphate fertilizer market in Asia accounts to XX% of the global market and is the fastest growing market followed by Americas.
Growing Population and Increase in Food Demand Drives the Use of Phosphate Fertilizers
With the growing population, there has been a dire need to improve the yield of agricultural production to feed the ever increasing population. Phosphorus is often considered as one of the most important raw fertilizers used for enhancing the prompt growth of the crops and also helps in imbedding some properties like getting mature faster and being more drought-resistant.
Demand for fertilizers is also, strongly tied to the population’s income and standard of living. With the increasing per capita income, the standard of living also increases, so does the consumption of food by the people. According to FAO statistics, over the last 5 decades, grain consumption has increased by 2.1% a year on average while population has grown by 1.6% per year.
Plants require phosphorus for metabolism like growth, utilization of starch, photosynthesis, nucleus formation and cell division to name among a few others. One of the main reasons why phosphorous is necessary for plants is due to its capacity to store energy generated from photosynthesis and the metabolism of carbohydrates, for later use in growth and reproduction. These fertilizers helps a plant convert other nutrients into usable building blocks. Phosphorus is one of the main three nutrients most commonly found in fertilizers. Today there is a range of phosphatic fertilizers available to farmers. Some contain only phosphorus, others contain two or more nutrients. Manufacturers often produce a variety of such fertilizers which contain nitrogen, phosphorus and potassium in various proportions.
Phosphate fertilizers market can be categorized into the type of fertilizers commercially available in the market which include monoammonium phosphate (MAP), diammonium phosphate (DAP), rock phosphate and super phosphate. DAP and super phosphates are the majorly consumed fertilizers among the list of phosphate fertilizers available.
The global market for phosphate fertilizers was estimated to be $XX billion in 2015. The global market for phosphate fertilizers market is estimated to grow at a CAGR of XX% and is forecast to reach $XX billion by 2021. The phosphate fertilizers are forecast to have the highest growth of X% during the forecast period 2016-2021. Americas and Asia alone are estimated to occupy a share of more than XX% during 2016-2021.
Asia-Pacific is the leading market for phosphate fertilizers. This region is forecast to have highest growth in the next few years owing to the growing adoption of phosphate fertilizers in agricultural applications. The phosphate fertilizer market in Asia accounts to XX% of the global market and is the fastest growing market followed by Americas.
Growing Population and Increase in Food Demand Drives the Use of Phosphate Fertilizers
With the growing population, there has been a dire need to improve the yield of agricultural production to feed the ever increasing population. Phosphorus is often considered as one of the most important raw fertilizers used for enhancing the prompt growth of the crops and also helps in imbedding some properties like getting mature faster and being more drought-resistant.
Demand for fertilizers is also, strongly tied to the population’s income and standard of living. With the increasing per capita income, the standard of living also increases, so does the consumption of food by the people. According to FAO statistics, over the last 5 decades, grain consumption has increased by 2.1% a year on average while population has grown by 1.6% per year.
Sample Companies Profiled in this Report are:
- Agrium Inc.
- Euro chem
- Israel Chemicals Limited
- Potash Corp of Saskatchewan Inc.
- The Mosaic Co.
- 10+.
1. Phosphate Fertilizers Market - Overview
1.1. Definitions and Scope
2. Phosphate Fertilizers Market - Executive summary
2.1. Market Revenue, Market Size and Key Trends by Company
2.2. Key Trends by type of Application
2.3. Key Trends segmented by Geography
3. Phosphate Fertilizers Market
3.1. Comparative analysis
3.1.1. Product Benchmarking - Top 10 companies
3.1.2. Top 5 Financials Analysis
3.1.3. Market Value split by Top 10 companies
3.1.4. Patent Analysis - Top 10 companies
3.1.5. Pricing Analysis
4. Phosphate Fertilizers Market – Startup companies Scenario Premium
4.1. Top 10 startup company Analysis by
4.1.1. Investment
4.1.2. Revenue
4.1.3. Market Shares
4.1.4. Market Size and Application Analysis
4.1.5. Venture Capital and Funding Scenario
5. Phosphate Fertilizers Market – Industry Market Entry Scenario Premium
5.1. Regulatory Framework Overview
5.2. New Business and Ease of Doing business index
5.3. Case studies of successful ventures
5.4. Customer Analysis – Top 10 companies
6. Phosphate Fertilizers Market Forces
6.1. Drivers
6.2. Constraints
6.3. Challenges
6.4. Porters five force model
6.4.1. Bargaining power of suppliers
6.4.2. Bargaining powers of customers
6.4.3. Threat of new entrants
6.4.4. Rivalry among existing players
6.4.5. Threat of substitutes
7. Phosphate Fertilizers Market -Strategic analysis
7.1. Value chain analysis
7.2. Opportunities analysis
7.3. Product life cycle
7.4. Suppliers and distributors Market Share
8. Phosphate Fertilizers Market – By Type (Market Size -$Million / $Billion)
8.1. Market Size and Market Share Analysis
8.2. Application Revenue and Trend Research
8.3. Product Segment Analysis
8.3.1. MAP (Monoammonium Phosphate)
8.3.2. DAP (Diammonium Phosphate)
8.3.3. Rock Phosphate
8.3.4. Super Phosphate
9. Phosphate Fertilizers Market – By Crop (Market Size -$Million / $Billion)
9.1. Grains
9.2. Oilseeds
9.3. Fruits
9.4. Vegetables
9.5. Others
10. Phosphate Fertilizers - By Geography (Market Size -$Million / $Billion)
10.1. Phosphate Fertilizers Market - North America Segment Research
10.2. North America Market Research (Million / $Billion)
10.2.1. Segment type Size and Market Size Analysis
10.2.2. Revenue and Trends
10.2.3. Application Revenue and Trends by type of Application
10.2.4. Company Revenue and Product Analysis
10.2.5. North America Product type and Application Market Size
10.2.5.1. U.S.
10.2.5.2. Canada
10.2.5.3. Mexico
10.2.5.4. Rest of North America
10.3. Phosphate Fertilizers - South America Segment Research
10.4. South America Market Research (Market Size -$Million / $Billion)
10.4.1. Segment type Size and Market Size Analysis
10.4.2. Revenue and Trends
10.4.3. Application Revenue and Trends by type of Application
10.4.4. Company Revenue and Product Analysis
10.4.5. South America Product type and Application Market Size
10.4.5.1. Brazil
10.4.5.2. Venezuela
10.4.5.3. Argentina
10.4.5.4. Ecuador
10.4.5.5. Peru
10.4.5.6. Colombia
10.4.5.7. Costa Rica
10.4.5.8. Rest of South America
10.5. Phosphate Fertilizers - Europe Segment Research
10.6. Europe Market Research (Market Size -$Million / $Billion)
10.6.1. Segment type Size and Market Size Analysis
10.6.2. Revenue and Trends
10.6.3. Application Revenue and Trends by type of Application
10.6.4. Company Revenue and Product Analysis
10.6.5. Europe Segment Product type and Application Market Size
10.6.5.1. U.K
10.6.5.2. Germany
10.6.5.3. Italy
10.6.5.4. France
10.6.5.5. Netherlands
10.6.5.6. Belgium
10.6.5.7. Spain
10.6.5.8. Denmark
10.6.5.9. Rest of Europe
10.7. Phosphate Fertilizers – APAC Segment Research
10.8. APAC Market Research (Market Size -$Million / $Billion)
10.8.1. Segment type Size and Market Size Analysis
10.8.2. Revenue and Trends
10.8.3. Application Revenue and Trends by type of Application
10.8.4. Company Revenue and Product Analysis
10.8.5. APAC Segment – Product type and Application Market Size
10.8.5.1. China
10.8.5.2. Australia
10.8.5.3. Japan
10.8.5.4. South Korea
10.8.5.5. India
10.8.5.6. Taiwan
10.8.5.7. Malaysia
11. Phosphate Fertilizers Market - Entropy
11.1. New product launches
11.2. M&A's, collaborations, JVs and partnerships
12. Phosphate Fertilizers Market – Industry / Segment Competition landscape Premium
12.1. Market Share Analysis
12.1.1. Market Share by Country- Top companies
12.1.2. Market Share by Region- Top 10 companies
12.1.3. Market Share by type of Application – Top 10 companies
12.1.4. Market Share by type of Product / Product category- Top 10 companies
12.1.5. Market Share at global level- Top 10 companies
12.1.6. Best Practises for companies
13 . Phosphate Fertilizers Market – Key Company List by Country Premium
14. Phosphate Fertilizers Market Company Analysis
14.1. Market Share, Company Revenue, Products, M&A, Developments
14.2. Agrium Inc.
14.3. CF Industries Holdings Inc.
14.4. Coromandel International Ltd.
14.5. Euro chem
14.6. Israel Chemicals Limited
14.7. Office Cherifien Des Phosphates
14.8. Phosagro
14.9. Potash Corp of Saskatchewan Inc.
14.10. The Mosaic Co.
14.11. Yara International Asa
14.12. JESA
14.13. MIRA Organics and Chemicals PVT LTD
14.14. Yunnan Yuntianhua International Chemical Co., Ltd.
14.15. California Organic Fertilizers Inc
14.16. California Organic Fertilizers Inc
14.17. Perfect Blend .L L C
14.18. Qatar fertilizer
14.19. Minera formas
14.20. Sichuan blue sword chemicals co., Ltd
14.21. Chuanxi xingda chemical plant
14.22. Sulux phosphate Ltd
14.23. Plasticizers and allied Chemicals
14.24. The Kugler Company
14.25. Company 26
14.26. Company 27
14.27. Company 28 and more
"*Financials would be provided on a best efforts basis for private companies"
15. Phosphate Fertilizers Market -Appendix
15.1. Abbreviations
15.2. Sources
16. Phosphate Fertilizers Market -Methodology Premium
16.1. Research Methodology
16.1.1. Company Expert Interviews
16.1.2. Industry Databases
16.1.3. Associations
16.1.4. Company News
16.1.5. Company Annual Reports
16.1.6. Application Trends
16.1.7. New Products and Product database
16.1.8. Company Transcripts
16.1.9. R&D Trends
16.1.10. Key Opinion Leaders Interviews
16.1.11. Supply and Demand Trends
List of Tables
Table 1 Phosphate Fertilizers Market Overview 2021-2026
Table 2 Phosphate Fertilizers Market Leader Analysis 2018-2019 (US$)
Table 3 Phosphate Fertilizers MarketProduct Analysis 2018-2019 (US$)
Table 4 Phosphate Fertilizers MarketEnd User Analysis 2018-2019 (US$)
Table 5 Phosphate Fertilizers MarketPatent Analysis 2013-2018* (US$)
Table 6 Phosphate Fertilizers MarketFinancial Analysis 2018-2019 (US$)
Table 7 Phosphate Fertilizers Market Driver Analysis 2018-2019 (US$)
Table 8 Phosphate Fertilizers MarketChallenges Analysis 2018-2019 (US$)
Table 9 Phosphate Fertilizers MarketConstraint Analysis 2018-2019 (US$)
Table 10 Phosphate Fertilizers Market Supplier Bargaining Power Analysis 2018-2019 (US$)
Table 11 Phosphate Fertilizers Market Buyer Bargaining Power Analysis 2018-2019 (US$)
Table 12 Phosphate Fertilizers Market Threat of Substitutes Analysis 2018-2019 (US$)
Table 13 Phosphate Fertilizers Market Threat of New Entrants Analysis 2018-2019 (US$)
Table 14 Phosphate Fertilizers Market Degree of Competition Analysis 2018-2019 (US$)
Table 15 Phosphate Fertilizers MarketValue Chain Analysis 2018-2019 (US$)
Table 16 Phosphate Fertilizers MarketPricing Analysis 2021-2026 (US$)
Table 17 Phosphate Fertilizers MarketOpportunities Analysis 2021-2026 (US$)
Table 18 Phosphate Fertilizers MarketProduct Life Cycle Analysis 2021-2026 (US$)
Table 19 Phosphate Fertilizers MarketSupplier Analysis 2018-2019 (US$)
Table 20 Phosphate Fertilizers MarketDistributor Analysis 2018-2019 (US$)
Table 21 Phosphate Fertilizers Market Trend Analysis 2018-2019 (US$)
Table 22 Phosphate Fertilizers Market Size 2018 (US$)
Table 23 Phosphate Fertilizers Market Forecast Analysis 2021-2026 (US$)
Table 24 Phosphate Fertilizers Market Sales Forecast Analysis 2021-2026 (Units)
Table 25 Phosphate Fertilizers Market, Revenue & Volume,By Type, 2021-2026 ($)
Table 26 Phosphate Fertilizers MarketBy Type, Revenue & Volume,By MAP (Monoammonium Phosphate), 2021-2026 ($)
Table 27 Phosphate Fertilizers MarketBy Type, Revenue & Volume,By DAP (Diammonium Phosphate), 2021-2026 ($)
Table 28 Phosphate Fertilizers MarketBy Type, Revenue & Volume,By Rock Phosphate, 2021-2026 ($)
Table 29 Phosphate Fertilizers MarketBy Type, Revenue & Volume,By Super Phosphate, 2021-2026 ($)
Table 30 Phosphate Fertilizers Market, Revenue & Volume,By Crop, 2021-2026 ($)
Table 31 Phosphate Fertilizers MarketBy Crop, Revenue & Volume,By Grains, 2021-2026 ($)
Table 32 Phosphate Fertilizers MarketBy Crop, Revenue & Volume,By Oilseeds, 2021-2026 ($)
Table 33 Phosphate Fertilizers MarketBy Crop, Revenue & Volume,By Fruits, 2021-2026 ($)
Table 34 Phosphate Fertilizers MarketBy Crop, Revenue & Volume,By Vegetables, 2021-2026 ($)
Table 35 North America Phosphate Fertilizers Market, Revenue & Volume,By Type, 2021-2026 ($)
Table 36 North America Phosphate Fertilizers Market, Revenue & Volume,By Crop, 2021-2026 ($)
Table 37 South america Phosphate Fertilizers Market, Revenue & Volume,By Type, 2021-2026 ($)
Table 38 South america Phosphate Fertilizers Market, Revenue & Volume,By Crop, 2021-2026 ($)
Table 39 Europe Phosphate Fertilizers Market, Revenue & Volume,By Type, 2021-2026 ($)
Table 40 Europe Phosphate Fertilizers Market, Revenue & Volume,By Crop, 2021-2026 ($)
Table 41 APAC Phosphate Fertilizers Market, Revenue & Volume,By Type, 2021-2026 ($)
Table 42 APAC Phosphate Fertilizers Market, Revenue & Volume,By Crop, 2021-2026 ($)
Table 43 Middle East & Africa Phosphate Fertilizers Market, Revenue & Volume,By Type, 2021-2026 ($)
Table 44 Middle East & Africa Phosphate Fertilizers Market, Revenue & Volume,By Crop, 2021-2026 ($)
Table 45 Russia Phosphate Fertilizers Market, Revenue & Volume,By Type, 2021-2026 ($)
Table 46 Russia Phosphate Fertilizers Market, Revenue & Volume,By Crop, 2021-2026 ($)
Table 47 Israel Phosphate Fertilizers Market, Revenue & Volume,By Type, 2021-2026 ($)
Table 48 Israel Phosphate Fertilizers Market, Revenue & Volume,By Crop, 2021-2026 ($)
Table 49 Top Companies 2018 (US$)Phosphate Fertilizers Market, Revenue & Volume,,
Table 50 Product Launch 2018-2019Phosphate Fertilizers Market, Revenue & Volume,,
Table 51 Mergers & Acquistions 2018-2019Phosphate Fertilizers Market, Revenue & Volume,,
List of Figures
Figure 1 Overview of Phosphate Fertilizers Market 2021-2026
Figure 2 Market Share Analysis for Phosphate Fertilizers Market 2018 (US$)
Figure 3 Product Comparison in Phosphate Fertilizers Market 2018-2019 (US$)
Figure 4 End User Profile for Phosphate Fertilizers Market 2018-2019 (US$)
Figure 5 Patent Application and Grant in Phosphate Fertilizers Market 2013-2018* (US$)
Figure 6 Top 5 Companies Financial Analysis in Phosphate Fertilizers Market 2018-2019 (US$)
Figure 7 Market Entry Strategy in Phosphate Fertilizers Market 2018-2019
Figure 8 Ecosystem Analysis in Phosphate Fertilizers Market2018
Figure 9 Average Selling Price in Phosphate Fertilizers Market 2021-2026
Figure 10 Top Opportunites in Phosphate Fertilizers Market 2018-2019
Figure 11 Market Life Cycle Analysis in Phosphate Fertilizers Market
Figure 12 GlobalBy TypePhosphate Fertilizers Market Revenue, 2021-2026 ($)
Figure 13 GlobalBy CropPhosphate Fertilizers Market Revenue, 2021-2026 ($)
Figure 14 Global Phosphate Fertilizers Market - By Geography
Figure 15 Global Phosphate Fertilizers Market Value & Volume, By Geography, 2021-2026 ($)
Figure 16 Global Phosphate Fertilizers Market CAGR, By Geography, 2021-2026 (%)
Figure 17 North America Phosphate Fertilizers Market Value & Volume, 2021-2026 ($)
Figure 18 US Phosphate Fertilizers Market Value & Volume, 2021-2026 ($)
Figure 19 US GDP and Population, 2018-2019 ($)
Figure 20 US GDP – Composition of 2018, By Sector of Origin
Figure 21 US Export and Import Value & Volume, 2018-2019 ($)
Figure 22 Canada Phosphate Fertilizers Market Value & Volume, 2021-2026 ($)
Figure 23 Canada GDP and Population, 2018-2019 ($)
Figure 24 Canada GDP – Composition of 2018, By Sector of Origin
Figure 25 Canada Export and Import Value & Volume, 2018-2019 ($)
Figure 26 Mexico Phosphate Fertilizers Market Value & Volume, 2021-2026 ($)
Figure 27 Mexico GDP and Population, 2018-2019 ($)
Figure 28 Mexico GDP – Composition of 2018, By Sector of Origin
Figure 29 Mexico Export and Import Value & Volume, 2018-2019 ($)
Figure 30 South America Phosphate Fertilizers MarketSouth America 3D Printing Market Value & Volume, 2021-2026 ($)
Figure 31 Brazil Phosphate Fertilizers Market Value & Volume, 2021-2026 ($)
Figure 32 Brazil GDP and Population, 2018-2019 ($)
Figure 33 Brazil GDP – Composition of 2018, By Sector of Origin
Figure 34 Brazil Export and Import Value & Volume, 2018-2019 ($)
Figure 35 Venezuela Phosphate Fertilizers Market Value & Volume, 2021-2026 ($)
Figure 36 Venezuela GDP and Population, 2018-2019 ($)
Figure 37 Venezuela GDP – Composition of 2018, By Sector of Origin
Figure 38 Venezuela Export and Import Value & Volume, 2018-2019 ($)
Figure 39 Argentina Phosphate Fertilizers Market Value & Volume, 2021-2026 ($)
Figure 40 Argentina GDP and Population, 2018-2019 ($)
Figure 41 Argentina GDP – Composition of 2018, By Sector of Origin
Figure 42 Argentina Export and Import Value & Volume, 2018-2019 ($)
Figure 43 Ecuador Phosphate Fertilizers Market Value & Volume, 2021-2026 ($)
Figure 44 Ecuador GDP and Population, 2018-2019 ($)
Figure 45 Ecuador GDP – Composition of 2018, By Sector of Origin
Figure 46 Ecuador Export and Import Value & Volume, 2018-2019 ($)
Figure 47 Peru Phosphate Fertilizers Market Value & Volume, 2021-2026 ($)
Figure 48 Peru GDP and Population, 2018-2019 ($)
Figure 49 Peru GDP – Composition of 2018, By Sector of Origin
Figure 50 Peru Export and Import Value & Volume, 2018-2019 ($)
Figure 51 Colombia Phosphate Fertilizers Market Value & Volume, 2021-2026 ($)
Figure 52 Colombia GDP and Population, 2018-2019 ($)
Figure 53 Colombia GDP – Composition of 2018, By Sector of Origin
Figure 54 Colombia Export and Import Value & Volume, 2018-2019 ($)
Figure 55 Costa Rica Phosphate Fertilizers MarketCosta Rica 3D Printing Market Value & Volume, 2021-2026 ($)
Figure 56 Costa Rica GDP and Population, 2018-2019 ($)
Figure 57 Costa Rica GDP – Composition of 2018, By Sector of Origin
Figure 58 Costa Rica Export and Import Value & Volume, 2018-2019 ($)
Figure 59 Europe Phosphate Fertilizers Market Value & Volume, 2021-2026 ($)
Figure 60 U.K Phosphate Fertilizers Market Value & Volume, 2021-2026 ($)
Figure 61 U.K GDP and Population, 2018-2019 ($)
Figure 62 U.K GDP – Composition of 2018, By Sector of Origin
Figure 63 U.K Export and Import Value & Volume, 2018-2019 ($)
Figure 64 Germany Phosphate Fertilizers Market Value & Volume, 2021-2026 ($)
Figure 65 Germany GDP and Population, 2018-2019 ($)
Figure 66 Germany GDP – Composition of 2018, By Sector of Origin
Figure 67 Germany Export and Import Value & Volume, 2018-2019 ($)
Figure 68 Italy Phosphate Fertilizers Market Value & Volume, 2021-2026 ($)
Figure 69 Italy GDP and Population, 2018-2019 ($)
Figure 70 Italy GDP – Composition of 2018, By Sector of Origin
Figure 71 Italy Export and Import Value & Volume, 2018-2019 ($)
Figure 72 France Phosphate Fertilizers Market Value & Volume, 2021-2026 ($)
Figure 73 France GDP and Population, 2018-2019 ($)
Figure 74 France GDP – Composition of 2018, By Sector of Origin
Figure 75 France Export and Import Value & Volume, 2018-2019 ($)
Figure 76 Netherlands Phosphate Fertilizers Market Value & Volume, 2021-2026 ($)
Figure 77 Netherlands GDP and Population, 2018-2019 ($)
Figure 78 Netherlands GDP – Composition of 2018, By Sector of Origin
Figure 79 Netherlands Export and Import Value & Volume, 2018-2019 ($)
Figure 80 Belgium Phosphate Fertilizers Market Value & Volume, 2021-2026 ($)
Figure 81 Belgium GDP and Population, 2018-2019 ($)
Figure 82 Belgium GDP – Composition of 2018, By Sector of Origin
Figure 83 Belgium Export and Import Value & Volume, 2018-2019 ($)
Figure 84 Spain Phosphate Fertilizers Market Value & Volume, 2021-2026 ($)
Figure 85 Spain GDP and Population, 2018-2019 ($)
Figure 86 Spain GDP – Composition of 2018, By Sector of Origin
Figure 87 Spain Export and Import Value & Volume, 2018-2019 ($)
Figure 88 Denmark Phosphate Fertilizers Market Value & Volume, 2021-2026 ($)
Figure 89 Denmark GDP and Population, 2018-2019 ($)
Figure 90 Denmark GDP – Composition of 2018, By Sector of Origin
Figure 91 Denmark Export and Import Value & Volume, 2018-2019 ($)
Figure 92 APAC Phosphate Fertilizers Market Value & Volume, 2021-2026 ($)
Figure 93 China Phosphate Fertilizers MarketValue & Volume, 2021-2026
Figure 94 China GDP and Population, 2018-2019 ($)
Figure 95 China GDP – Composition of 2018, By Sector of Origin
Figure 96 China Export and Import Value & Volume, 2018-2019 ($)Phosphate Fertilizers MarketChina Export and Import Value & Volume, 2018-2019 ($)
Figure 97 Australia Phosphate Fertilizers Market Value & Volume, 2021-2026 ($)
Figure 98 Australia GDP and Population, 2018-2019 ($)
Figure 99 Australia GDP – Composition of 2018, By Sector of Origin
Figure 100 Australia Export and Import Value & Volume, 2018-2019 ($)
Figure 101 South Korea Phosphate Fertilizers Market Value & Volume, 2021-2026 ($)
Figure 102 South Korea GDP and Population, 2018-2019 ($)
Figure 103 South Korea GDP – Composition of 2018, By Sector of Origin
Figure 104 South Korea Export and Import Value & Volume, 2018-2019 ($)
Figure 105 India Phosphate Fertilizers Market Value & Volume, 2021-2026 ($)
Figure 106 India GDP and Population, 2018-2019 ($)
Figure 107 India GDP – Composition of 2018, By Sector of Origin
Figure 108 India Export and Import Value & Volume, 2018-2019 ($)
Figure 109 Taiwan Phosphate Fertilizers MarketTaiwan 3D Printing Market Value & Volume, 2021-2026 ($)
Figure 110 Taiwan GDP and Population, 2018-2019 ($)
Figure 111 Taiwan GDP – Composition of 2018, By Sector of Origin
Figure 112 Taiwan Export and Import Value & Volume, 2018-2019 ($)
Figure 113 Malaysia Phosphate Fertilizers MarketMalaysia 3D Printing Market Value & Volume, 2021-2026 ($)
Figure 114 Malaysia GDP and Population, 2018-2019 ($)
Figure 115 Malaysia GDP – Composition of 2018, By Sector of Origin
Figure 116 Malaysia Export and Import Value & Volume, 2018-2019 ($)
Figure 117 Hong Kong Phosphate Fertilizers MarketHong Kong 3D Printing Market Value & Volume, 2021-2026 ($)
Figure 118 Hong Kong GDP and Population, 2018-2019 ($)
Figure 119 Hong Kong GDP – Composition of 2018, By Sector of Origin
Figure 120 Hong Kong Export and Import Value & Volume, 2018-2019 ($)
Figure 121 Middle East & Africa Phosphate Fertilizers MarketMiddle East & Africa 3D Printing Market Value & Volume, 2021-2026 ($)
Figure 122 Russia Phosphate Fertilizers MarketRussia 3D Printing Market Value & Volume, 2021-2026 ($)
Figure 123 Russia GDP and Population, 2018-2019 ($)
Figure 124 Russia GDP – Composition of 2018, By Sector of Origin
Figure 125 Russia Export and Import Value & Volume, 2018-2019 ($)
Figure 126 Israel Phosphate Fertilizers Market Value & Volume, 2021-2026 ($)
Figure 127 Israel GDP and Population, 2018-2019 ($)
Figure 128 Israel GDP – Composition of 2018, By Sector of Origin
Figure 129 Israel Export and Import Value & Volume, 2018-2019 ($)
Figure 130 Entropy Share, By Strategies, 2018-2019* (%)Phosphate Fertilizers Market
Figure 131 Developments, 2018-2019*Phosphate Fertilizers Market
Figure 132 Company 1 Phosphate Fertilizers Market Net Revenue, By Years, 2018-2019* ($)
Figure 133 Company 1 Phosphate Fertilizers Market Net Revenue Share, By Business segments, 2018 (%)
Figure 134 Company 1 Phosphate Fertilizers Market Net Sales Share, By Geography, 2018 (%)
Figure 135 Company 2 Phosphate Fertilizers Market Net Revenue, By Years, 2018-2019* ($)
Figure 136 Company 2 Phosphate Fertilizers Market Net Revenue Share, By Business segments, 2018 (%)
Figure 137 Company 2 Phosphate Fertilizers Market Net Sales Share, By Geography, 2018 (%)
Figure 138 Company 3Phosphate Fertilizers Market Net Revenue, By Years, 2018-2019* ($)
Figure 139 Company 3Phosphate Fertilizers Market Net Revenue Share, By Business segments, 2018 (%)
Figure 140 Company 3Phosphate Fertilizers Market Net Sales Share, By Geography, 2018 (%)
Figure 141 Company 4 Phosphate Fertilizers Market Net Revenue, By Years, 2018-2019* ($)
Figure 142 Company 4 Phosphate Fertilizers Market Net Revenue Share, By Business segments, 2018 (%)
Figure 143 Company 4 Phosphate Fertilizers Market Net Sales Share, By Geography, 2018 (%)
Figure 144 Company 5 Phosphate Fertilizers Market Net Revenue, By Years, 2018-2019* ($)
Figure 145 Company 5 Phosphate Fertilizers Market Net Revenue Share, By Business segments, 2018 (%)
Figure 146 Company 5 Phosphate Fertilizers Market Net Sales Share, By Geography, 2018 (%)
Figure 147 Company 6 Phosphate Fertilizers Market Net Revenue, By Years, 2018-2019* ($)
Figure 148 Company 6 Phosphate Fertilizers Market Net Revenue Share, By Business segments, 2018 (%)
Figure 149 Company 6 Phosphate Fertilizers Market Net Sales Share, By Geography, 2018 (%)
Figure 150 Company 7 Phosphate Fertilizers Market Net Revenue, By Years, 2018-2019* ($)
Figure 151 Company 7 Phosphate Fertilizers Market Net Revenue Share, By Business segments, 2018 (%)
Figure 152 Company 7 Phosphate Fertilizers Market Net Sales Share, By Geography, 2018 (%)
Figure 153 Company 8 Phosphate Fertilizers Market Net Revenue, By Years, 2018-2019* ($)
Figure 154 Company 8 Phosphate Fertilizers Market Net Revenue Share, By Business segments, 2018 (%)
Figure 155 Company 8 Phosphate Fertilizers Market Net Sales Share, By Geography, 2018 (%)
Figure 156 Company 9 Phosphate Fertilizers Market Net Revenue, By Years, 2018-2019* ($)
Figure 157 Company 9 Phosphate Fertilizers Market Net Revenue Share, By Business segments, 2018 (%)
Figure 158 Company 9 Phosphate Fertilizers Market Net Sales Share, By Geography, 2018 (%)
Figure 159 Company 10 Phosphate Fertilizers Market Net Revenue, By Years, 2018-2019* ($)
Figure 160 Company 10 Phosphate Fertilizers Market Net Revenue Share, By Business segments, 2018 (%)
Figure 161 Company 10 Phosphate Fertilizers Market Net Sales Share, By Geography, 2018 (%)
Figure 162 Company 11 Phosphate Fertilizers Market Net Revenue, By Years, 2018-2019* ($)
Figure 163 Company 11 Phosphate Fertilizers Market Net Revenue Share, By Business segments, 2018 (%)
Figure 164 Company 11 Phosphate Fertilizers Market Net Sales Share, By Geography, 2018 (%)
Figure 165 Company 12 Phosphate Fertilizers Market Net Revenue, By Years, 2018-2019* ($)
Figure 166 Company 12 Phosphate Fertilizers Market Net Revenue Share, By Business segments, 2018 (%)
Figure 167 Company 12 Phosphate Fertilizers Market Net Sales Share, By Geography, 2018 (%)
Figure 168 Company 13Phosphate Fertilizers Market Net Revenue, By Years, 2018-2019* ($)
Figure 169 Company 13Phosphate Fertilizers Market Net Revenue Share, By Business segments, 2018 (%)
Figure 170 Company 13Phosphate Fertilizers Market Net Sales Share, By Geography, 2018 (%)
Figure 171 Company 14 Phosphate Fertilizers Market Net Revenue, By Years, 2018-2019* ($)
Figure 172 Company 14 Phosphate Fertilizers Market Net Revenue Share, By Business segments, 2018 (%)
Figure 173 Company 14 Phosphate Fertilizers Market Net Sales Share, By Geography, 2018 (%)
Figure 174 Company 15 Phosphate Fertilizers Market Net Revenue, By Years, 2018-2019* ($)
Figure 175 Company 15 Phosphate Fertilizers Market Net Revenue Share, By Business segments, 2018 (%)
Figure 176 Company 15 Phosphate Fertilizers Market Net Sales Share, By Geography, 2018 (%)