 Email
Email Print
Print


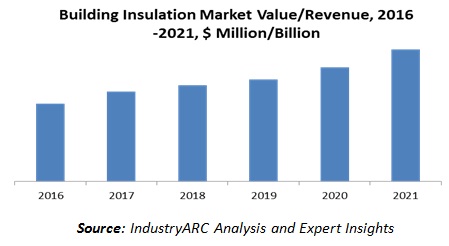
Building Insulation can be defined as one of the important techniques to reduce the energy demand by deploying various energy saving measures and avoiding heat losses. Building insulation is considered to be the most effective techniques in climates having varied range of annual average temperatures. The building insulation market is flourishing across the globe due to the popularity of various building insulation materials which also helps in energy saving while controlling the greenhouse gas emissions.
The global building insulation market has been segmented on the basis of types insulation material used, applications, and different geographical regions. Based on different insulation material, the global building insulation market is classified into wool insulation, plastic foams, and others. Wool insulation material is further classified into rock wool, glass wool and slag wool. Plastic foam insulation material is further divided into Extruded Polystyrene Foam (XPS), Polyurethane Foam (PUR/PIR), and Expanded Polystyrene Foam (EPS). Others include insulation materials such as perlite and wood fiber. By application, the market is characterized by roof insulation and wall insulation applications. Roof insulation applications are further classified into flat roof and pitch roof applications while wall insulation applications are divided into external, internal and cavity walls. Geographically, the market is characterized into Americas, Europe, Asia Pacific and rest of the World (RoW). In North America and Europe, the market growth is likely to be driven by the rising demand of wool market during the forecast period.
The introduction of various policy and regulations supporting the demand of insulation in residential and commercial building is currently recognized as one of the leading factors bolstering the building insulation market demand worldwide. This can be construed as growing need to construct energy efficient buildings worldwide as a part of various energy saving initiatives by governments. Moreover, the market demand is paving way due to rising stringent requirements for new insulation and building codes which are generating awareness about the market. The growing of real estate sector is also identified as key driver for the market during the forecast period. This is majorly supported by continuously happening rural to urban migrations, which is boosting housing construction in urban regions, thereby creating demand for insulation materials. During the forecast period, the market growth is predicted to get restricted by factors such as lack of awareness and slow growing construction sector in Europe.
Some of the leading players in the global building insulation market are:
- Rockwool International A/S
- Owens Corning Corporation
- Saint-Gobain S.A.
- Beijing New Building Material (Group) Co., Ltd.
- Johns Manville Inc.
1. Building Insulation Market - Overview
1.1. Definitions and Scope
2. Building Insulation Market - Executive summary
2.1. Market Revenue, Market Size and Key Trends by Company
2.2. Key Trends by type of Application
2.3. Key Trends segmented by Geography
3. Building Insulation Market
3.1. Comparative analysis
3.1.1. Product Benchmarking - Top 10 companies
3.1.2. Top 5 Financials Analysis
3.1.3. Market Value split by Top 10 companies
3.1.4. Patent Analysis - Top 10 companies
3.1.5. Pricing Analysis
4. Building Insulation Market – Startup companies Scenario Premium
4.1. Top 10 startup company Analysis by
4.1.1. Investment
4.1.2. Revenue
4.1.3. Market Shares
4.1.4. Market Size and Application Analysis
4.1.5. Venture Capital and Funding Scenario
5. Building Insulation Market – Industry Market Entry Scenario Premium
5.1. Regulatory Framework Overview
5.2. New Business and Ease of Doing business index
5.3. Case studies of successful ventures
5.4. Customer Analysis – Top 10 companies
6. Building Insulation Market Forces
6.1. Drivers
6.2. Constraints
6.3. Challenges
6.4. Porters five force model
6.4.1. Bargaining power of suppliers
6.4.2. Bargaining powers of customers
6.4.3. Threat of new entrants
6.4.4. Rivalry among existing players
6.4.5. Threat of substitutes
7. Building Insulation Market -Strategic analysis
7.1. Value chain analysis
7.2. Opportunities analysis
7.3. Product life cycle
7.4. Suppliers and distributors Market Share
8. Building Insulation Market – By Insulation Material (Market Size -$Million / $Billion)
8.1. Market Size and Market Share Analysis
8.2. Application Revenue and Trend Research
8.3. Product Segment Analysis
8.3.1. Wool Insulation
8.3.1.1. Rock Wool
8.3.1.2. Glass Wool
8.3.1.3. Slag Wool
8.3.2. Plastic Foams
8.3.2.1. Extruded Polystyrene Foam (XPS)
8.3.2.2. Polyurethane Foam (PUR/PIR)
8.3.2.3. Expanded Polystyrene Foam (EPS)
8.3.3. Others
8.3.3.1. Perlite
8.3.3.2. Wood Fiber
9. Building Insulation Market – By Application (Market Size -$Million / $Billion)
9.1. Roof Insulation
9.1.1. Flat Roof
9.1.2. Pitch Roof
9.2. Wall Insulation
9.2.1. External Walls
9.2.2. Internal Walls
9.2.3. Cavity Walls
10. Building Insulation - By Geography (Market Size -$Million / $Billion)
10.1. Building Insulation Market - North America Segment Research
10.2. North America Market Research (Million / $Billion)
10.2.1. Segment type Size and Market Size Analysis
10.2.2. Revenue and Trends
10.2.3. Application Revenue and Trends by type of Application
10.2.4. Company Revenue and Product Analysis
10.2.5. North America Product type and Application Market Size
10.2.5.1. U.S.
10.2.5.2. Canada
10.2.5.3. Mexico
10.2.5.4. Rest of North America
10.3. Building Insulation - South America Segment Research
10.4. South America Market Research (Market Size -$Million / $Billion)
10.4.1. Segment type Size and Market Size Analysis
10.4.2. Revenue and Trends
10.4.3. Application Revenue and Trends by type of Application
10.4.4. Company Revenue and Product Analysis
10.4.5. South America Product type and Application Market Size
10.4.5.1. Brazil
10.4.5.2. Venezuela
10.4.5.3. Argentina
10.4.5.4. Ecuador
10.4.5.5. Peru
10.4.5.6. Colombia
10.4.5.7. Costa Rica
10.4.5.8. Rest of South America
10.5. Building Insulation - Europe Segment Research
10.6. Europe Market Research (Market Size -$Million / $Billion)
10.6.1. Segment type Size and Market Size Analysis
10.6.2. Revenue and Trends
10.6.3. Application Revenue and Trends by type of Application
10.6.4. Company Revenue and Product Analysis
10.6.5. Europe Segment Product type and Application Market Size
10.6.5.1. U.K
10.6.5.2. Germany
10.6.5.3. Italy
10.6.5.4. France
10.6.5.5. Netherlands
10.6.5.6. Belgium
10.6.5.7. Spain
10.6.5.8. Denmark
10.6.5.9. Rest of Europe
10.7. Building Insulation – APAC Segment Research
10.8. APAC Market Research (Market Size -$Million / $Billion)
10.8.1. Segment type Size and Market Size Analysis
10.8.2. Revenue and Trends
10.8.3. Application Revenue and Trends by type of Application
10.8.4. Company Revenue and Product Analysis
10.8.5. APAC Segment – Product type and Application Market Size
10.8.5.1. China
10.8.5.2. Australia
10.8.5.3. Japan
10.8.5.4. South Korea
10.8.5.5. India
10.8.5.6. Taiwan
10.8.5.7. Malaysia
11. Building Insulation Market - Entropy
11.1. New product launches
11.2. M&A's, collaborations, JVs and partnerships
12. Building Insulation Market – Industry / Segment Competition landscape Premium
12.1. Market Share Analysis
12.1.1. Market Share by Country- Top companies
12.1.2. Market Share by Region- Top 10 companies
12.1.3. Market Share by type of Application – Top 10 companies
12.1.4. Market Share by type of Product / Product category- Top 10 companies
12.1.5. Market Share at global level- Top 10 companies
12.1.6. Best Practises for companies
13. Building Insulation Market – Key Company List by Country Premium
14. Building Insulation Market Company Analysis
14.1. Market Share, Company Revenue, Products, M&A, Developments
14.2. Rockwool International A/S
14.3. Owens Corning Corporation
14.4. Saint-Gobain S.A.
14.5. Beijing New Building Material (Group) Co., Ltd.
14.6. Johns Manville Inc.
14.7. Company 6
14.8. Company 7
14.9. Company 8
14.10. Company 9
14.11. Company 10 and more
"*Financials would be provided on a best efforts basis for private companies"
15. Building Insulation Market -Appendix
15.1. Abbreviations
15.2. Sources
16. Building Insulation Market -Methodology Premium
16.1. Research Methodology
16.1.1. Company Expert Interviews
16.1.2. Industry Databases
16.1.3. Associations
16.1.4. Company News
16.1.5. Company Annual Reports
16.1.6. Application Trends
16.1.7. New Products and Product database
16.1.8. Company Transcripts
16.1.9. R&D Trends
16.1.10. Key Opinion Leaders Interviews
16.1.11. Supply and Demand Trends
List of Tables
Table1 Building Insulation Market Overview 2021-2026
Table2 Building Insulation Market Leader Analysis 2018-2019 (US$)
Table3 Building Insulation MarketProduct Analysis 2018-2019 (US$)
Table4 Building Insulation MarketEnd User Analysis 2018-2019 (US$)
Table5 Building Insulation MarketPatent Analysis 2013-2018* (US$)
Table6 Building Insulation MarketFinancial Analysis 2018-2019 (US$)
Table7 Building Insulation Market Driver Analysis 2018-2019 (US$)
Table8 Building Insulation MarketChallenges Analysis 2018-2019 (US$)
Table9 Building Insulation MarketConstraint Analysis 2018-2019 (US$)
Table10 Building Insulation Market Supplier Bargaining Power Analysis 2018-2019 (US$)
Table11 Building Insulation Market Buyer Bargaining Power Analysis 2018-2019 (US$)
Table12 Building Insulation Market Threat of Substitutes Analysis 2018-2019 (US$)
Table13 Building Insulation Market Threat of New Entrants Analysis 2018-2019 (US$)
Table14 Building Insulation Market Degree of Competition Analysis 2018-2019 (US$)
Table15 Building Insulation MarketValue Chain Analysis 2018-2019 (US$)
Table16 Building Insulation MarketPricing Analysis 2021-2026 (US$)
Table17 Building Insulation MarketOpportunities Analysis 2021-2026 (US$)
Table18 Building Insulation MarketProduct Life Cycle Analysis 2021-2026 (US$)
Table19 Building Insulation MarketSupplier Analysis 2018-2019 (US$)
Table20 Building Insulation MarketDistributor Analysis 2018-2019 (US$)
Table21 Building Insulation Market Trend Analysis 2018-2019 (US$)
Table22 Building Insulation Market Size 2018 (US$)
Table23 Building Insulation Market Forecast Analysis 2021-2026 (US$)
Table24 Building Insulation Market Sales Forecast Analysis 2021-2026 (Units)
Table25 Building Insulation Market, Revenue & Volume,By Insulation Material, 2021-2026 ($)
Table26 Building Insulation MarketBy Insulation Material, Revenue & Volume,By Wool Insulation, 2021-2026 ($)
Table27 Building Insulation MarketBy Insulation Material, Revenue & Volume,By Plastic Foams, 2021-2026 ($)
Table28 Building Insulation Market, Revenue & Volume,By Application, 2021-2026 ($)
Table29 Building Insulation MarketBy Application, Revenue & Volume,By Roof Insulation, 2021-2026 ($)
Table30 Building Insulation MarketBy Application, Revenue & Volume,By Wall Insulation, 2021-2026 ($)
Table31 North America Building Insulation Market, Revenue & Volume,By Insulation Material, 2021-2026 ($)
Table32 North America Building Insulation Market, Revenue & Volume,By Application, 2021-2026 ($)
Table33 South america Building Insulation Market, Revenue & Volume,By Insulation Material, 2021-2026 ($)
Table34 South america Building Insulation Market, Revenue & Volume,By Application, 2021-2026 ($)
Table35 Europe Building Insulation Market, Revenue & Volume,By Insulation Material, 2021-2026 ($)
Table36 Europe Building Insulation Market, Revenue & Volume,By Application, 2021-2026 ($)
Table37 APAC Building Insulation Market, Revenue & Volume,By Insulation Material, 2021-2026 ($)
Table38 APAC Building Insulation Market, Revenue & Volume,By Application, 2021-2026 ($)
Table39 Middle East & Africa Building Insulation Market, Revenue & Volume,By Insulation Material, 2021-2026 ($)
Table40 Middle East & Africa Building Insulation Market, Revenue & Volume,By Application, 2021-2026 ($)
Table41 Russia Building Insulation Market, Revenue & Volume,By Insulation Material, 2021-2026 ($)
Table42 Russia Building Insulation Market, Revenue & Volume,By Application, 2021-2026 ($)
Table43 Israel Building Insulation Market, Revenue & Volume,By Insulation Material, 2021-2026 ($)
Table44 Israel Building Insulation Market, Revenue & Volume,By Application, 2021-2026 ($)
Table45 Top Companies 2018 (US$)Building Insulation Market, Revenue & Volume,,
Table46 Product Launch 2018-2019Building Insulation Market, Revenue & Volume,,
Table47 Mergers & Acquistions 2018-2019Building Insulation Market, Revenue & Volume,,
List of Figures
Figure 1 Overview of Building Insulation Market 2021-2026
Figure 2 Market Share Analysis for Building Insulation Market 2018 (US$)
Figure 3 Product Comparison in Building Insulation Market 2018-2019 (US$)
Figure 4 End User Profile for Building Insulation Market 2018-2019 (US$)
Figure 5 Patent Application and Grant in Building Insulation Market 2013-2018* (US$)
Figure 6 Top 5 Companies Financial Analysis in Building Insulation Market 2018-2019 (US$)
Figure 7 Market Entry Strategy in Building Insulation Market 2018-2019
Figure 8 Ecosystem Analysis in Building Insulation Market2018
Figure 9 Average Selling Price in Building Insulation Market 2021-2026
Figure 10 Top Opportunites in Building Insulation Market 2018-2019
Figure 11 Market Life Cycle Analysis in Building Insulation Market
Figure 12 GlobalBy Insulation MaterialBuilding Insulation Market Revenue, 2021-2026 ($)
Figure 13 GlobalBy ApplicationBuilding Insulation Market Revenue, 2021-2026 ($)
Figure 14 Global Building Insulation Market - By Geography
Figure 15 Global Building Insulation Market Value & Volume, By Geography, 2021-2026 ($)
Figure 16 Global Building Insulation Market CAGR, By Geography, 2021-2026 (%)
Figure 17 North America Building Insulation Market Value & Volume, 2021-2026 ($)
Figure 18 US Building Insulation Market Value & Volume, 2021-2026 ($)
Figure 19 US GDP and Population, 2018-2019 ($)
Figure 20 US GDP – Composition of 2018, By Sector of Origin
Figure 21 US Export and Import Value & Volume, 2018-2019 ($)
Figure 22 Canada Building Insulation Market Value & Volume, 2021-2026 ($)
Figure 23 Canada GDP and Population, 2018-2019 ($)
Figure 24 Canada GDP – Composition of 2018, By Sector of Origin
Figure 25 Canada Export and Import Value & Volume, 2018-2019 ($)
Figure 26 Mexico Building Insulation Market Value & Volume, 2021-2026 ($)
Figure 27 Mexico GDP and Population, 2018-2019 ($)
Figure 28 Mexico GDP – Composition of 2018, By Sector of Origin
Figure 29 Mexico Export and Import Value & Volume, 2018-2019 ($)
Figure 30 South America Building Insulation MarketSouth America 3D Printing Market Value & Volume, 2021-2026 ($)
Figure 31 Brazil Building Insulation Market Value & Volume, 2021-2026 ($)
Figure 32 Brazil GDP and Population, 2018-2019 ($)
Figure 33 Brazil GDP – Composition of 2018, By Sector of Origin
Figure 34 Brazil Export and Import Value & Volume, 2018-2019 ($)
Figure 35 Venezuela Building Insulation Market Value & Volume, 2021-2026 ($)
Figure 36 Venezuela GDP and Population, 2018-2019 ($)
Figure 37 Venezuela GDP – Composition of 2018, By Sector of Origin
Figure 38 Venezuela Export and Import Value & Volume, 2018-2019 ($)
Figure 39 Argentina Building Insulation Market Value & Volume, 2021-2026 ($)
Figure 40 Argentina GDP and Population, 2018-2019 ($)
Figure 41 Argentina GDP – Composition of 2018, By Sector of Origin
Figure 42 Argentina Export and Import Value & Volume, 2018-2019 ($)
Figure 43 Ecuador Building Insulation Market Value & Volume, 2021-2026 ($)
Figure 44 Ecuador GDP and Population, 2018-2019 ($)
Figure 45 Ecuador GDP – Composition of 2018, By Sector of Origin
Figure 46 Ecuador Export and Import Value & Volume, 2018-2019 ($)
Figure 47 Peru Building Insulation Market Value & Volume, 2021-2026 ($)
Figure 48 Peru GDP and Population, 2018-2019 ($)
Figure 49 Peru GDP – Composition of 2018, By Sector of Origin
Figure 50 Peru Export and Import Value & Volume, 2018-2019 ($)
Figure 51 Colombia Building Insulation Market Value & Volume, 2021-2026 ($)
Figure 52 Colombia GDP and Population, 2018-2019 ($)
Figure 53 Colombia GDP – Composition of 2018, By Sector of Origin
Figure 54 Colombia Export and Import Value & Volume, 2018-2019 ($)
Figure 55 Costa Rica Building Insulation MarketCosta Rica 3D Printing Market Value & Volume, 2021-2026 ($)
Figure 56 Costa Rica GDP and Population, 2018-2019 ($)
Figure 57 Costa Rica GDP – Composition of 2018, By Sector of Origin
Figure 58 Costa Rica Export and Import Value & Volume, 2018-2019 ($)
Figure 59 Europe Building Insulation Market Value & Volume, 2021-2026 ($)
Figure 60 U.K Building Insulation Market Value & Volume, 2021-2026 ($)
Figure 61 U.K GDP and Population, 2018-2019 ($)
Figure 62 U.K GDP – Composition of 2018, By Sector of Origin
Figure 63 U.K Export and Import Value & Volume, 2018-2019 ($)
Figure 64 Germany Building Insulation Market Value & Volume, 2021-2026 ($)
Figure 65 Germany GDP and Population, 2018-2019 ($)
Figure 66 Germany GDP – Composition of 2018, By Sector of Origin
Figure 67 Germany Export and Import Value & Volume, 2018-2019 ($)
Figure 68 Italy Building Insulation Market Value & Volume, 2021-2026 ($)
Figure 69 Italy GDP and Population, 2018-2019 ($)
Figure 70 Italy GDP – Composition of 2018, By Sector of Origin
Figure 71 Italy Export and Import Value & Volume, 2018-2019 ($)
Figure 72 France Building Insulation Market Value & Volume, 2021-2026 ($)
Figure 73 France GDP and Population, 2018-2019 ($)
Figure 74 France GDP – Composition of 2018, By Sector of Origin
Figure 75 France Export and Import Value & Volume, 2018-2019 ($)
Figure 76 Netherlands Building Insulation Market Value & Volume, 2021-2026 ($)
Figure 77 Netherlands GDP and Population, 2018-2019 ($)
Figure 78 Netherlands GDP – Composition of 2018, By Sector of Origin
Figure 79 Netherlands Export and Import Value & Volume, 2018-2019 ($)
Figure 80 Belgium Building Insulation Market Value & Volume, 2021-2026 ($)
Figure 81 Belgium GDP and Population, 2018-2019 ($)
Figure 82 Belgium GDP – Composition of 2018, By Sector of Origin
Figure 83 Belgium Export and Import Value & Volume, 2018-2019 ($)
Figure 84 Spain Building Insulation Market Value & Volume, 2021-2026 ($)
Figure 85 Spain GDP and Population, 2018-2019 ($)
Figure 86 Spain GDP – Composition of 2018, By Sector of Origin
Figure 87 Spain Export and Import Value & Volume, 2018-2019 ($)
Figure 88 Denmark Building Insulation Market Value & Volume, 2021-2026 ($)
Figure 89 Denmark GDP and Population, 2018-2019 ($)
Figure 90 Denmark GDP – Composition of 2018, By Sector of Origin
Figure 91 Denmark Export and Import Value & Volume, 2018-2019 ($)
Figure 92 APAC Building Insulation Market Value & Volume, 2021-2026 ($)
Figure 93 China Building Insulation MarketValue & Volume, 2021-2026
Figure 94 China GDP and Population, 2018-2019 ($)
Figure 95 China GDP – Composition of 2018, By Sector of Origin
Figure 96 China Export and Import Value & Volume, 2018-2019 ($)Building Insulation MarketChina Export and Import Value & Volume, 2018-2019 ($)
Figure 97 Australia Building Insulation Market Value & Volume, 2021-2026 ($)
Figure 98 Australia GDP and Population, 2018-2019 ($)
Figure 99 Australia GDP – Composition of 2018, By Sector of Origin
Figure 100 Australia Export and Import Value & Volume, 2018-2019 ($)
Figure 101 South Korea Building Insulation Market Value & Volume, 2021-2026 ($)
Figure 102 South Korea GDP and Population, 2018-2019 ($)
Figure 103 South Korea GDP – Composition of 2018, By Sector of Origin
Figure 104 South Korea Export and Import Value & Volume, 2018-2019 ($)
Figure 105 India Building Insulation Market Value & Volume, 2021-2026 ($)
Figure 106 India GDP and Population, 2018-2019 ($)
Figure 107 India GDP – Composition of 2018, By Sector of Origin
Figure 108 India Export and Import Value & Volume, 2018-2019 ($)
Figure 109 Taiwan Building Insulation MarketTaiwan 3D Printing Market Value & Volume, 2021-2026 ($)
Figure 110 Taiwan GDP and Population, 2018-2019 ($)
Figure 111 Taiwan GDP – Composition of 2018, By Sector of Origin
Figure 112 Taiwan Export and Import Value & Volume, 2018-2019 ($)
Figure 113 Malaysia Building Insulation MarketMalaysia 3D Printing Market Value & Volume, 2021-2026 ($)
Figure 114 Malaysia GDP and Population, 2018-2019 ($)
Figure 115 Malaysia GDP – Composition of 2018, By Sector of Origin
Figure 116 Malaysia Export and Import Value & Volume, 2018-2019 ($)
Figure 117 Hong Kong Building Insulation MarketHong Kong 3D Printing Market Value & Volume, 2021-2026 ($)
Figure 118 Hong Kong GDP and Population, 2018-2019 ($)
Figure 119 Hong Kong GDP – Composition of 2018, By Sector of Origin
Figure 120 Hong Kong Export and Import Value & Volume, 2018-2019 ($)
Figure 121 Middle East & Africa Building Insulation MarketMiddle East & Africa 3D Printing Market Value & Volume, 2021-2026 ($)
Figure 122 Russia Building Insulation MarketRussia 3D Printing Market Value & Volume, 2021-2026 ($)
Figure 123 Russia GDP and Population, 2018-2019 ($)
Figure 124 Russia GDP – Composition of 2018, By Sector of Origin
Figure 125 Russia Export and Import Value & Volume, 2018-2019 ($)
Figure 126 Israel Building Insulation Market Value & Volume, 2021-2026 ($)
Figure 127 Israel GDP and Population, 2018-2019 ($)
Figure 128 Israel GDP – Composition of 2018, By Sector of Origin
Figure 129 Israel Export and Import Value & Volume, 2018-2019 ($)
Figure 130 Entropy Share, By Strategies, 2018-2019* (%)Building Insulation Market
Figure 131 Developments, 2018-2019*Building Insulation Market
Figure 132 Company 1 Building Insulation Market Net Revenue, By Years, 2018-2019* ($)
Figure 133 Company 1 Building Insulation Market Net Revenue Share, By Business segments, 2018 (%)
Figure 134 Company 1 Building Insulation Market Net Sales Share, By Geography, 2018 (%)
Figure 135 Company 2 Building Insulation Market Net Revenue, By Years, 2018-2019* ($)
Figure 136 Company 2 Building Insulation Market Net Revenue Share, By Business segments, 2018 (%)
Figure 137 Company 2 Building Insulation Market Net Sales Share, By Geography, 2018 (%)
Figure 138 Company 3Building Insulation Market Net Revenue, By Years, 2018-2019* ($)
Figure 139 Company 3Building Insulation Market Net Revenue Share, By Business segments, 2018 (%)
Figure 140 Company 3Building Insulation Market Net Sales Share, By Geography, 2018 (%)
Figure 141 Company 4 Building Insulation Market Net Revenue, By Years, 2018-2019* ($)
Figure 142 Company 4 Building Insulation Market Net Revenue Share, By Business segments, 2018 (%)
Figure 143 Company 4 Building Insulation Market Net Sales Share, By Geography, 2018 (%)
Figure 144 Company 5 Building Insulation Market Net Revenue, By Years, 2018-2019* ($)
Figure 145 Company 5 Building Insulation Market Net Revenue Share, By Business segments, 2018 (%)
Figure 146 Company 5 Building Insulation Market Net Sales Share, By Geography, 2018 (%)
Figure 147 Company 6 Building Insulation Market Net Revenue, By Years, 2018-2019* ($)
Figure 148 Company 6 Building Insulation Market Net Revenue Share, By Business segments, 2018 (%)
Figure 149 Company 6 Building Insulation Market Net Sales Share, By Geography, 2018 (%)
Figure 150 Company 7 Building Insulation Market Net Revenue, By Years, 2018-2019* ($)
Figure 151 Company 7 Building Insulation Market Net Revenue Share, By Business segments, 2018 (%)
Figure 152 Company 7 Building Insulation Market Net Sales Share, By Geography, 2018 (%)
Figure 153 Company 8 Building Insulation Market Net Revenue, By Years, 2018-2019* ($)
Figure 154 Company 8 Building Insulation Market Net Revenue Share, By Business segments, 2018 (%)
Figure 155 Company 8 Building Insulation Market Net Sales Share, By Geography, 2018 (%)
Figure 156 Company 9 Building Insulation Market Net Revenue, By Years, 2018-2019* ($)
Figure 157 Company 9 Building Insulation Market Net Revenue Share, By Business segments, 2018 (%)
Figure 158 Company 9 Building Insulation Market Net Sales Share, By Geography, 2018 (%)
Figure 159 Company 10 Building Insulation Market Net Revenue, By Years, 2018-2019* ($)
Figure 160 Company 10 Building Insulation Market Net Revenue Share, By Business segments, 2018 (%)
Figure 161 Company 10 Building Insulation Market Net Sales Share, By Geography, 2018 (%)
Figure 162 Company 11 Building Insulation Market Net Revenue, By Years, 2018-2019* ($)
Figure 163 Company 11 Building Insulation Market Net Revenue Share, By Business segments, 2018 (%)
Figure 164 Company 11 Building Insulation Market Net Sales Share, By Geography, 2018 (%)
Figure 165 Company 12 Building Insulation Market Net Revenue, By Years, 2018-2019* ($)
Figure 166 Company 12 Building Insulation Market Net Revenue Share, By Business segments, 2018 (%)
Figure 167 Company 12 Building Insulation Market Net Sales Share, By Geography, 2018 (%)
Figure 168 Company 13Building Insulation Market Net Revenue, By Years, 2018-2019* ($)
Figure 169 Company 13Building Insulation Market Net Revenue Share, By Business segments, 2018 (%)
Figure 170 Company 13Building Insulation Market Net Sales Share, By Geography, 2018 (%)
Figure 171 Company 14 Building Insulation Market Net Revenue, By Years, 2018-2019* ($)
Figure 172 Company 14 Building Insulation Market Net Revenue Share, By Business segments, 2018 (%)
Figure 173 Company 14 Building Insulation Market Net Sales Share, By Geography, 2018 (%)
Figure 174 Company 15 Building Insulation Market Net Revenue, By Years, 2018-2019* ($)
Figure 175 Company 15 Building Insulation Market Net Revenue Share, By Business segments, 2018 (%)
Figure 176 Company 15 Building Insulation Market Net Sales Share, By Geography, 2018 (%)