 Email
Email Print
Print


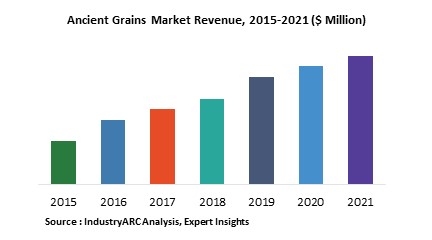
Ancient Grains Market Overview
The Chia ancient grains market, which forms part of the larger ancient grains market, is estimated to surpass $2,560.43m by 2023, growing at a CAGR of 36.60% during the forecast period 2018–2023. The ancient grains market is poised to witness significant growth owing to the increased applications of these grains in the food, cosmetics, pharmaceutical, and medical industries. The Americas region is the largest market for ancient grains as the market is more prevalent in South America and the U.S.
Ancient Grains Market Outlook
Ancient grains are defined as grains that remain largely unchanged over several hundred years. Ancient grains are gaining popularity among the Americans. They are being used in almost everything – from cereals, salads, breads, and crackers to pizza, quiche, and light snacks. Amaranth and quinoa have received considerable interest because of their gluten-free property. Gluten is found in other grains such as wheat, barley, and rye. Chia can be considered as a functional food because apart from contributing to human nutrition, it helps increase satiety index, and prevent cardiovascular diseases, inflammatory and nervous system disorders, and diabetes.
This report provides an in-depth analysis of the ancient grains market by grain type, application, and geography. Based on grain type, the market is majorly segmented into chia, amaranth, and quinoa.
The report also analyzes the market taking into consideration the various regions including the Americas, Europe, Asia-Pacific, and Rest of the world as well as the prominent countries for the ancient grains market across these regions. The chia ancient grains market in the Americas was valued at $199m in 2017 and is estimated to reach $1,225.37m by 2023, growing at a CAGR of 35.4% during the forecast period. The quinoa ancient grains market in the Americas was valued at $381m in 2017 and is projected to reach $2,115.76m by 2023, growing at a CAGR of 33.1% during the forecast period. The amaranth ancient grains market in the Americas was valued at $50.8m in 2017 and is estimated to reach $180,067.94m by 2023, growing at a CAGR of 23.5% during the forecast period.
Ancient Grains Market Growth Drivers
Consumer inclination towards super foods is propelling the growth of the market.
The increased aversion to grain and wheat among consumers is expected to benefit the market for pseudo-grains such as amaranth and quinoa.
Minimal effort and prerequisites for cultivating chia, amaranth and quinoa compared to other grains are set to drive the market.
The growing health-consciousness among consumers and the demand for gluten-free food & beverages have been creating an upsurge in demand for ancient grains.
Increasing demand for organic and natural products from the cosmetic industry is driving the global chia, amaranth, and quinoa markets.
Ancient Grains Market Challenges
High cost of labor, and unavailability of irrigation facilities in many regions are acting as and challenges for the market.
Growing consumption and production limitations are together causing a surge in prices for pseudo-grains such as quinoa and amaranth.
Increase in non-authentic, non-organic, non-fair trade quinoa varieties
Soil degradation caused by production intensification will result in lower yields and lower quality of chia, quinoa, and amaranth.
Ancient Grains Market Research Scope
The base year of the study is 2017, with forecast done up to 2023. The study presents a thorough analysis of the competitive landscape, taking into account the market shares of the leading companies. It also provides information on unit shipments. These provide the key market participants with the necessary business intelligence and help them understand the future of the grains in ancient grains market. The assessment includes the forecast, an overview of the competitive structure, the market shares of the competitors, as well as the market trends, market demands, market drivers, market challenges, and product analysis. The market drivers and restraints have been assessed to fathom their impact over the forecast period. This report further identifies the key opportunities for growth while also detailing the key challenges and possible threats. The key areas of focus include the types of ancient grains, and their specific applications.
Ancient Grains Market Report: Industry Coverage
Types of Ancient Grains: Chia, Amaranth, and Quinoa
Applications of Ancient Grains: Bakery & confectionary, infant formula, cereals, beverages, animal feed, frozen food and others
The Ancient Grains market report also analyzes the major geographic regions for the market as well as the major countries for the market in these regions. The regions and countries covered in the study include:
- The Americas: The U.S., Canada, Mexico, Brazil, Venezuela, Argentina, and Rest of Americas
- Europe: The U.K., Germany, Italy, France, Spain, Russia, Ukraine and Rest of Europe
- APAC: China, Australia, South Korea, India and Rest of APAC
- Rest of the World: The Middle East and Africa
Ancient Grains Market Key Players Perspective
Some of the key players mentioned in this report are Cargill Inc., Bunge Limited, Glanbia plc, and Archer Daniels Midland Company.
Ancient Grains Market Trends
- Increasing promotion and continual innovation of ancient grains such as chia, amaranth, and quinoa in the food sector provides significant opportunities for food product manufacturers.
- Growing demand for niche gluten free products
- Increasing applications of chia, amaranth and quinoa in the pharmaceutical and cosmetic industries
1. Ancient Grains Market - Overview
1.1. Definitions and Scope
2. Ancient Grains Market - Executive summary
2.1. Market Revenue, Market Size and Key Trends by Company
2.2. Key Trends by type of Application
2.3. Key Trends segmented by Geography
3. Ancient Grains Market
3.1. Comparative analysis
3.1.1. Product Benchmarking - Top 10 companies
3.1.2. Top 5 Financials Analysis
3.1.3. Market Value split by Top 10 companies
3.1.4. Patent Analysis - Top 10 companies
3.1.5. Pricing Analysis
4. Ancient Grains Market – Startup companies Scenario Premium
4.1. Top 10 startup company Analysis by
4.1.1. Investment
4.1.2. Revenue
4.1.3. Market Shares
4.1.4. Market Size and Application Analysis
4.1.5. Venture Capital and Funding Scenario
5. Ancient Grains Market – Industry Market Entry Scenario Premium
5.1. Regulatory Framework Overview
5.2. New Business and Ease of Doing business index
5.3. Case studies of successful ventures
5.4. Customer Analysis – Top 10 companies
6. Ancient Grains Market Forces
6.1. Drivers
6.2. Constraints
6.3. Challenges
6.4. Porters five force model
6.4.1. Bargaining power of suppliers
6.4.2. Bargaining powers of customers
6.4.3. Threat of new entrants
6.4.4. Rivalry among existing players
6.4.5. Threat of substitutes
7. Ancient Grains Market -Strategic analysis
7.1. Value chain analysis
7.2. Opportunities analysis
7.3. Product life cycle
7.4. Suppliers and distributors Market Share
8. Ancient Grains Market – By Grain Type (Market Size -$Million / $Billion)
8.1. Market Size and Market Share Analysis
8.2. Application Revenue and Trend Research
8.3. Product Segment Analysis
8.3.1. Chia
8.3.2. Amaranth
8.3.3. Quinoa
9. Ancient Grains Market – By Application (Market Size -$Million / $Billion)
9.1. Introduction
9.2. Bakery & Confectionary
9.3. Infant Formula
9.4. Cereals
9.5. Beverages
9.6. Animal Feed
9.7. Frozen Food
9.8. Others
10. Ancient Grains - By Geography (Market Size -$Million / $Billion)
10.1. Ancient Grains Market - North America Segment Research
10.2. North America Market Research (Million / $Billion)
10.2.1. Segment type Size and Market Size Analysis
10.2.2. Revenue and Trends
10.2.3. Application Revenue and Trends by type of Application
10.2.4. Company Revenue and Product Analysis
10.2.5. North America Product type and Application Market Size
10.2.5.1. U.S.
10.2.5.2. Canada
10.2.5.3. Mexico
10.2.5.4. Rest of North America
10.3. Ancient Grains - South America Segment Research
10.4. South America Market Research (Market Size -$Million / $Billion)
10.4.1. Segment type Size and Market Size Analysis
10.4.2. Revenue and Trends
10.4.3. Application Revenue and Trends by type of Application
10.4.4. Company Revenue and Product Analysis
10.4.5. South America Product type and Application Market Size
10.4.5.1. Brazil
10.4.5.2. Venezuela
10.4.5.3. Argentina
10.4.5.4. Ecuador
10.4.5.5. Peru
10.4.5.6. Colombia
10.4.5.7. Costa Rica
10.4.5.8. Rest of South America
10.5. Ancient Grains - Europe Segment Research
10.6. Europe Market Research (Market Size -$Million / $Billion)
10.6.1. Segment type Size and Market Size Analysis
10.6.2. Revenue and Trends
10.6.3. Application Revenue and Trends by type of Application
10.6.4. Company Revenue and Product Analysis
10.6.5. Europe Segment Product type and Application Market Size
10.6.5.1. U.K
10.6.5.2. Germany
10.6.5.3. Italy
10.6.5.4. France
10.6.5.5. Netherlands
10.6.5.6. Belgium
10.6.5.7. Spain
10.6.5.8. Denmark
10.6.5.9. Rest of Europe
10.7. Ancient Grains – APAC Segment Research
10.8. APAC Market Research (Market Size -$Million / $Billion)
10.8.1. Segment type Size and Market Size Analysis
10.8.2. Revenue and Trends
10.8.3. Application Revenue and Trends by type of Application
10.8.4. Company Revenue and Product Analysis
10.8.5. APAC Segment – Product type and Application Market Size
10.8.5.1. China
10.8.5.2. Australia
10.8.5.3. Japan
10.8.5.4. South Korea
10.8.5.5. India
10.8.5.6. Taiwan
10.8.5.7. Malaysia
11. Ancient Grains Market - Entropy
11.1. New product launches
11.2. M&A's, collaborations, JVs and partnerships
12. Ancient Grains Market – Industry / Segment Competition landscape Premium
12.1. Market Share Analysis
12.1.1. Market Share by Country- Top companies
12.1.2. Market Share by Region- Top 10 companies
12.1.3. Market Share by type of Application – Top 10 companies
12.1.4. Market Share by type of Product / Product category- Top 10 companies
12.1.5. Market Share at global level- Top 10 companies
12.1.6. Best Practises for companies
13. Ancient Grains Market – Key Company List by Country Premium
14. Ancient Grains Market Company Analysis
14.1. Market Share, Company Revenue, Products, M&A, Developments
14.2. Cargill Inc.
14.3. Bunge Limited
14.4. Glanbia plc
14.5. Archer Daniels Midland Company
14.6. Company 5
14.7. Company 6
14.8. Company 7
14.9. Company 8
14.10. Company 9
14.10. Company 10 and more
"*Financials would be provided on a best efforts basis for private companies"
15. Ancient Grains Market -Appendix
15.1. Abbreviations
15.2. Sources
16. Ancient Grains Market -Methodology Premium
16.1. Research Methodology
16.1.1. Company Expert Interviews
16.1.2. Industry Databases
16.1.3. Associations
16.1.4. Company News
16.1.5. Company Annual Reports
16.1.6. Application Trends
16.1.7. New Products and Product database
16.1.8. Company Transcripts
16.1.9. R&D Trends
16.1.10. Key Opinion Leaders Interviews
16.1.10. Supply and Demand Trends
List of Tables
Table 1 Ancient Grains Market Overview 2021-2026
Table 2 Ancient Grains Market Leader Analysis 2018-2019 (US$)
Table 3 Ancient Grains MarketProduct Analysis 2018-2019 (US$)
Table 4 Ancient Grains MarketEnd User Analysis 2018-2019 (US$)
Table 5 Ancient Grains MarketPatent Analysis 2013-2018* (US$)
Table 6 Ancient Grains MarketFinancial Analysis 2018-2019 (US$)
Table 7 Ancient Grains Market Driver Analysis 2018-2019 (US$)
Table 8 Ancient Grains MarketChallenges Analysis 2018-2019 (US$)
Table 9 Ancient Grains MarketConstraint Analysis 2018-2019 (US$)
Table 10 Ancient Grains Market Supplier Bargaining Power Analysis 2018-2019 (US$)
Table 11 Ancient Grains Market Buyer Bargaining Power Analysis 2018-2019 (US$)
Table 12 Ancient Grains Market Threat of Substitutes Analysis 2018-2019 (US$)
Table 13 Ancient Grains Market Threat of New Entrants Analysis 2018-2019 (US$)
Table 14 Ancient Grains Market Degree of Competition Analysis 2018-2019 (US$)
Table 15 Ancient Grains MarketValue Chain Analysis 2018-2019 (US$)
Table 16 Ancient Grains MarketPricing Analysis 2021-2026 (US$)
Table 17 Ancient Grains MarketOpportunities Analysis 2021-2026 (US$)
Table 18 Ancient Grains MarketProduct Life Cycle Analysis 2021-2026 (US$)
Table 19 Ancient Grains MarketSupplier Analysis 2018-2019 (US$)
Table 20 Ancient Grains MarketDistributor Analysis 2018-2019 (US$)
Table 21 Ancient Grains Market Trend Analysis 2018-2019 (US$)
Table 22 Ancient Grains Market Size 2018 (US$)
Table 23 Ancient Grains Market Forecast Analysis 2021-2026 (US$)
Table 24 Ancient Grains Market Sales Forecast Analysis 2021-2026 (Units)
Table 25 Ancient Grains Market, Revenue & Volume,By Crop Type, 2021-2026 ($)
Table 26 Ancient Grains MarketBy Crop Type, Revenue & Volume,By Gluten Free Ancient Grains, 2021-2026 ($)
Table 27 Ancient Grains MarketBy Crop Type, Revenue & Volume,By Amaranth, 2021-2026 ($)
Table 28 Ancient Grains MarketBy Crop Type, Revenue & Volume,By Buckwheat, 2021-2026 ($)
Table 29 Ancient Grains MarketBy Crop Type, Revenue & Volume,By Gluten Containing Ancient Grains, 2021-2026 ($)
Table 30 Ancient Grains MarketBy Crop Type, Revenue & Volume,By Barley, 2021-2026 ($)
Table 31 Ancient Grains Market, Revenue & Volume,By Application, 2021-2026 ($)
Table 32 Ancient Grains MarketBy Application, Revenue & Volume,By Bakery, 2021-2026 ($)
Table 33 Ancient Grains MarketBy Application, Revenue & Volume,By Confectionery, 2021-2026 ($)
Table 34 Ancient Grains MarketBy Application, Revenue & Volume,By Sports Nutrition, 2021-2026 ($)
Table 35 Ancient Grains MarketBy Application, Revenue & Volume,By Infant Formula, 2021-2026 ($)
Table 36 Ancient Grains MarketBy Application, Revenue & Volume,By Cereals, 2021-2026 ($)
Table 37 North America Ancient Grains Market, Revenue & Volume,By Crop Type, 2021-2026 ($)
Table 38 North America Ancient Grains Market, Revenue & Volume,By Application, 2021-2026 ($)
Table 39 South america Ancient Grains Market, Revenue & Volume,By Crop Type, 2021-2026 ($)
Table 40 South america Ancient Grains Market, Revenue & Volume,By Application, 2021-2026 ($)
Table 41 Europe Ancient Grains Market, Revenue & Volume,By Crop Type, 2021-2026 ($)
Table 42 Europe Ancient Grains Market, Revenue & Volume,By Application, 2021-2026 ($)
Table 43 APAC Ancient Grains Market, Revenue & Volume,By Crop Type, 2021-2026 ($)
Table 44 APAC Ancient Grains Market, Revenue & Volume,By Application, 2021-2026 ($)
Table 45 Middle East & Africa Ancient Grains Market, Revenue & Volume,By Crop Type, 2021-2026 ($)
Table 46 Middle East & Africa Ancient Grains Market, Revenue & Volume,By Application, 2021-2026 ($)
Table 47 Russia Ancient Grains Market, Revenue & Volume,By Crop Type, 2021-2026 ($)
Table 48 Russia Ancient Grains Market, Revenue & Volume,By Application, 2021-2026 ($)
Table 49 Israel Ancient Grains Market, Revenue & Volume,By Crop Type, 2021-2026 ($)
Table 50 Israel Ancient Grains Market, Revenue & Volume,By Application, 2021-2026 ($)
Table 51 Top Companies 2018 (US$)Ancient Grains Market, Revenue & Volume,,
Table 52 Product Launch 2018-2019Ancient Grains Market, Revenue & Volume,,
Table 53 Mergers & Acquistions 2018-2019Ancient Grains Market, Revenue & Volume,,
List of Figures
Figure 1 Overview of Ancient Grains Market 2021-2026
Figure 2 Market Share Analysis for Ancient Grains Market 2018 (US$)
Figure 3 Product Comparison in Ancient Grains Market 2018-2019 (US$)
Figure 4 End User Profile for Ancient Grains Market 2018-2019 (US$)
Figure 5 Patent Application and Grant in Ancient Grains Market 2013-2018* (US$)
Figure 6 Top 5 Companies Financial Analysis in Ancient Grains Market 2018-2019 (US$)
Figure 7 Market Entry Strategy in Ancient Grains Market 2018-2019
Figure 8 Ecosystem Analysis in Ancient Grains Market2018
Figure 9 Average Selling Price in Ancient Grains Market 2021-2026
Figure 10 Top Opportunites in Ancient Grains Market 2018-2019
Figure 11 Market Life Cycle Analysis in Ancient Grains Market
Figure 12 GlobalBy Crop TypeAncient Grains Market Revenue, 2021-2026 ($)
Figure 13 GlobalBy ApplicationAncient Grains Market Revenue, 2021-2026 ($)
Figure 14 Global Ancient Grains Market - By Geography
Figure 15 Global Ancient Grains Market Value & Volume, By Geography, 2021-2026 ($)
Figure 16 Global Ancient Grains Market CAGR, By Geography, 2021-2026 (%)
Figure 17 North America Ancient Grains Market Value & Volume, 2021-2026 ($)
Figure 18 US Ancient Grains Market Value & Volume, 2021-2026 ($)
Figure 19 US GDP and Population, 2018-2019 ($)
Figure 20 US GDP – Composition of 2018, By Sector of Origin
Figure 21 US Export and Import Value & Volume, 2018-2019 ($)
Figure 22 Canada Ancient Grains Market Value & Volume, 2021-2026 ($)
Figure 23 Canada GDP and Population, 2018-2019 ($)
Figure 24 Canada GDP – Composition of 2018, By Sector of Origin
Figure 25 Canada Export and Import Value & Volume, 2018-2019 ($)
Figure 26 Mexico Ancient Grains Market Value & Volume, 2021-2026 ($)
Figure 27 Mexico GDP and Population, 2018-2019 ($)
Figure 28 Mexico GDP – Composition of 2018, By Sector of Origin
Figure 29 Mexico Export and Import Value & Volume, 2018-2019 ($)
Figure 30 South America Ancient Grains MarketSouth America 3D Printing Market Value & Volume, 2021-2026 ($)
Figure 31 Brazil Ancient Grains Market Value & Volume, 2021-2026 ($)
Figure 32 Brazil GDP and Population, 2018-2019 ($)
Figure 33 Brazil GDP – Composition of 2018, By Sector of Origin
Figure 34 Brazil Export and Import Value & Volume, 2018-2019 ($)
Figure 35 Venezuela Ancient Grains Market Value & Volume, 2021-2026 ($)
Figure 36 Venezuela GDP and Population, 2018-2019 ($)
Figure 37 Venezuela GDP – Composition of 2018, By Sector of Origin
Figure 38 Venezuela Export and Import Value & Volume, 2018-2019 ($)
Figure 39 Argentina Ancient Grains Market Value & Volume, 2021-2026 ($)
Figure 40 Argentina GDP and Population, 2018-2019 ($)
Figure 41 Argentina GDP – Composition of 2018, By Sector of Origin
Figure 42 Argentina Export and Import Value & Volume, 2018-2019 ($)
Figure 43 Ecuador Ancient Grains Market Value & Volume, 2021-2026 ($)
Figure 44 Ecuador GDP and Population, 2018-2019 ($)
Figure 45 Ecuador GDP – Composition of 2018, By Sector of Origin
Figure 46 Ecuador Export and Import Value & Volume, 2018-2019 ($)
Figure 47 Peru Ancient Grains Market Value & Volume, 2021-2026 ($)
Figure 48 Peru GDP and Population, 2018-2019 ($)
Figure 49 Peru GDP – Composition of 2018, By Sector of Origin
Figure 50 Peru Export and Import Value & Volume, 2018-2019 ($)
Figure 51 Colombia Ancient Grains Market Value & Volume, 2021-2026 ($)
Figure 52 Colombia GDP and Population, 2018-2019 ($)
Figure 53 Colombia GDP – Composition of 2018, By Sector of Origin
Figure 54 Colombia Export and Import Value & Volume, 2018-2019 ($)
Figure 55 Costa Rica Ancient Grains MarketCosta Rica 3D Printing Market Value & Volume, 2021-2026 ($)
Figure 56 Costa Rica GDP and Population, 2018-2019 ($)
Figure 57 Costa Rica GDP – Composition of 2018, By Sector of Origin
Figure 58 Costa Rica Export and Import Value & Volume, 2018-2019 ($)
Figure 59 Europe Ancient Grains Market Value & Volume, 2021-2026 ($)
Figure 60 U.K Ancient Grains Market Value & Volume, 2021-2026 ($)
Figure 61 U.K GDP and Population, 2018-2019 ($)
Figure 62 U.K GDP – Composition of 2018, By Sector of Origin
Figure 63 U.K Export and Import Value & Volume, 2018-2019 ($)
Figure 64 Germany Ancient Grains Market Value & Volume, 2021-2026 ($)
Figure 65 Germany GDP and Population, 2018-2019 ($)
Figure 66 Germany GDP – Composition of 2018, By Sector of Origin
Figure 67 Germany Export and Import Value & Volume, 2018-2019 ($)
Figure 68 Italy Ancient Grains Market Value & Volume, 2021-2026 ($)
Figure 69 Italy GDP and Population, 2018-2019 ($)
Figure 70 Italy GDP – Composition of 2018, By Sector of Origin
Figure 71 Italy Export and Import Value & Volume, 2018-2019 ($)
Figure 72 France Ancient Grains Market Value & Volume, 2021-2026 ($)
Figure 73 France GDP and Population, 2018-2019 ($)
Figure 74 France GDP – Composition of 2018, By Sector of Origin
Figure 75 France Export and Import Value & Volume, 2018-2019 ($)
Figure 76 Netherlands Ancient Grains Market Value & Volume, 2021-2026 ($)
Figure 77 Netherlands GDP and Population, 2018-2019 ($)
Figure 78 Netherlands GDP – Composition of 2018, By Sector of Origin
Figure 79 Netherlands Export and Import Value & Volume, 2018-2019 ($)
Figure 80 Belgium Ancient Grains Market Value & Volume, 2021-2026 ($)
Figure 81 Belgium GDP and Population, 2018-2019 ($)
Figure 82 Belgium GDP – Composition of 2018, By Sector of Origin
Figure 83 Belgium Export and Import Value & Volume, 2018-2019 ($)
Figure 84 Spain Ancient Grains Market Value & Volume, 2021-2026 ($)
Figure 85 Spain GDP and Population, 2018-2019 ($)
Figure 86 Spain GDP – Composition of 2018, By Sector of Origin
Figure 87 Spain Export and Import Value & Volume, 2018-2019 ($)
Figure 88 Denmark Ancient Grains Market Value & Volume, 2021-2026 ($)
Figure 89 Denmark GDP and Population, 2018-2019 ($)
Figure 90 Denmark GDP – Composition of 2018, By Sector of Origin
Figure 91 Denmark Export and Import Value & Volume, 2018-2019 ($)
Figure 92 APAC Ancient Grains Market Value & Volume, 2021-2026 ($)
Figure 93 China Ancient Grains MarketValue & Volume, 2021-2026
Figure 94 China GDP and Population, 2018-2019 ($)
Figure 95 China GDP – Composition of 2018, By Sector of Origin
Figure 96 China Export and Import Value & Volume, 2018-2019 ($)Ancient Grains MarketChina Export and Import Value & Volume, 2018-2019 ($)
Figure 97 Australia Ancient Grains Market Value & Volume, 2021-2026 ($)
Figure 98 Australia GDP and Population, 2018-2019 ($)
Figure 99 Australia GDP – Composition of 2018, By Sector of Origin
Figure 100 Australia Export and Import Value & Volume, 2018-2019 ($)
Figure 101 South Korea Ancient Grains Market Value & Volume, 2021-2026 ($)
Figure 102 South Korea GDP and Population, 2018-2019 ($)
Figure 103 South Korea GDP – Composition of 2018, By Sector of Origin
Figure 104 South Korea Export and Import Value & Volume, 2018-2019 ($)
Figure 105 India Ancient Grains Market Value & Volume, 2021-2026 ($)
Figure 106 India GDP and Population, 2018-2019 ($)
Figure 107 India GDP – Composition of 2018, By Sector of Origin
Figure 108 India Export and Import Value & Volume, 2018-2019 ($)
Figure 109 Taiwan Ancient Grains MarketTaiwan 3D Printing Market Value & Volume, 2021-2026 ($)
Figure 110 Taiwan GDP and Population, 2018-2019 ($)
Figure 111 Taiwan GDP – Composition of 2018, By Sector of Origin
Figure 112 Taiwan Export and Import Value & Volume, 2018-2019 ($)
Figure 113 Malaysia Ancient Grains MarketMalaysia 3D Printing Market Value & Volume, 2021-2026 ($)
Figure 114 Malaysia GDP and Population, 2018-2019 ($)
Figure 115 Malaysia GDP – Composition of 2018, By Sector of Origin
Figure 116 Malaysia Export and Import Value & Volume, 2018-2019 ($)
Figure 117 Hong Kong Ancient Grains MarketHong Kong 3D Printing Market Value & Volume, 2021-2026 ($)
Figure 118 Hong Kong GDP and Population, 2018-2019 ($)
Figure 119 Hong Kong GDP – Composition of 2018, By Sector of Origin
Figure 120 Hong Kong Export and Import Value & Volume, 2018-2019 ($)
Figure 121 Middle East & Africa Ancient Grains MarketMiddle East & Africa 3D Printing Market Value & Volume, 2021-2026 ($)
Figure 122 Russia Ancient Grains MarketRussia 3D Printing Market Value & Volume, 2021-2026 ($)
Figure 123 Russia GDP and Population, 2018-2019 ($)
Figure 124 Russia GDP – Composition of 2018, By Sector of Origin
Figure 125 Russia Export and Import Value & Volume, 2018-2019 ($)
Figure 126 Israel Ancient Grains Market Value & Volume, 2021-2026 ($)
Figure 127 Israel GDP and Population, 2018-2019 ($)
Figure 128 Israel GDP – Composition of 2018, By Sector of Origin
Figure 129 Israel Export and Import Value & Volume, 2018-2019 ($)
Figure 130 Entropy Share, By Strategies, 2018-2019* (%)Ancient Grains Market
Figure 131 Developments, 2018-2019*Ancient Grains Market
Figure 132 Company 1 Ancient Grains Market Net Revenue, By Years, 2018-2019* ($)
Figure 133 Company 1 Ancient Grains Market Net Revenue Share, By Business segments, 2018 (%)
Figure 134 Company 1 Ancient Grains Market Net Sales Share, By Geography, 2018 (%)
Figure 135 Company 2 Ancient Grains Market Net Revenue, By Years, 2018-2019* ($)
Figure 136 Company 2 Ancient Grains Market Net Revenue Share, By Business segments, 2018 (%)
Figure 137 Company 2 Ancient Grains Market Net Sales Share, By Geography, 2018 (%)
Figure 138 Company 3Ancient Grains Market Net Revenue, By Years, 2018-2019* ($)
Figure 139 Company 3Ancient Grains Market Net Revenue Share, By Business segments, 2018 (%)
Figure 140 Company 3Ancient Grains Market Net Sales Share, By Geography, 2018 (%)
Figure 141 Company 4 Ancient Grains Market Net Revenue, By Years, 2018-2019* ($)
Figure 142 Company 4 Ancient Grains Market Net Revenue Share, By Business segments, 2018 (%)
Figure 143 Company 4 Ancient Grains Market Net Sales Share, By Geography, 2018 (%)
Figure 144 Company 5 Ancient Grains Market Net Revenue, By Years, 2018-2019* ($)
Figure 145 Company 5 Ancient Grains Market Net Revenue Share, By Business segments, 2018 (%)
Figure 146 Company 5 Ancient Grains Market Net Sales Share, By Geography, 2018 (%)
Figure 147 Company 6 Ancient Grains Market Net Revenue, By Years, 2018-2019* ($)
Figure 148 Company 6 Ancient Grains Market Net Revenue Share, By Business segments, 2018 (%)
Figure 149 Company 6 Ancient Grains Market Net Sales Share, By Geography, 2018 (%)
Figure 150 Company 7 Ancient Grains Market Net Revenue, By Years, 2018-2019* ($)
Figure 151 Company 7 Ancient Grains Market Net Revenue Share, By Business segments, 2018 (%)
Figure 152 Company 7 Ancient Grains Market Net Sales Share, By Geography, 2018 (%)
Figure 153 Company 8 Ancient Grains Market Net Revenue, By Years, 2018-2019* ($)
Figure 154 Company 8 Ancient Grains Market Net Revenue Share, By Business segments, 2018 (%)
Figure 155 Company 8 Ancient Grains Market Net Sales Share, By Geography, 2018 (%)
Figure 156 Company 9 Ancient Grains Market Net Revenue, By Years, 2018-2019* ($)
Figure 157 Company 9 Ancient Grains Market Net Revenue Share, By Business segments, 2018 (%)
Figure 158 Company 9 Ancient Grains Market Net Sales Share, By Geography, 2018 (%)
Figure 159 Company 10 Ancient Grains Market Net Revenue, By Years, 2018-2019* ($)
Figure 160 Company 10 Ancient Grains Market Net Revenue Share, By Business segments, 2018 (%)
Figure 161 Company 10 Ancient Grains Market Net Sales Share, By Geography, 2018 (%)
Figure 162 Company 11 Ancient Grains Market Net Revenue, By Years, 2018-2019* ($)
Figure 163 Company 11 Ancient Grains Market Net Revenue Share, By Business segments, 2018 (%)
Figure 164 Company 11 Ancient Grains Market Net Sales Share, By Geography, 2018 (%)
Figure 165 Company 12 Ancient Grains Market Net Revenue, By Years, 2018-2019* ($)
Figure 166 Company 12 Ancient Grains Market Net Revenue Share, By Business segments, 2018 (%)
Figure 167 Company 12 Ancient Grains Market Net Sales Share, By Geography, 2018 (%)
Figure 168 Company 13Ancient Grains Market Net Revenue, By Years, 2018-2019* ($)
Figure 169 Company 13Ancient Grains Market Net Revenue Share, By Business segments, 2018 (%)
Figure 170 Company 13Ancient Grains Market Net Sales Share, By Geography, 2018 (%)
Figure 171 Company 14 Ancient Grains Market Net Revenue, By Years, 2018-2019* ($)
Figure 172 Company 14 Ancient Grains Market Net Revenue Share, By Business segments, 2018 (%)
Figure 173 Company 14 Ancient Grains Market Net Sales Share, By Geography, 2018 (%)
Figure 174 Company 15 Ancient Grains Market Net Revenue, By Years, 2018-2019* ($)
Figure 175 Company 15 Ancient Grains Market Net Revenue Share, By Business segments, 2018 (%)
Figure 176 Company 15 Ancient Grains Market Net Sales Share, By Geography, 2018 (%)