 Email
Email Print
Print


Laser Capture Microdissection Market - Forecast(2024 - 2030)
Laser capture microdissection is a contact- and contamination-free, anautomated sample preparation technology of isolating specific single cells or entire areas of tissues from a wide variety of samples using direct microscopic visualization. Globally, rising healthcare expenditure, technique being contamination-free, and technological advancements are the prime growth drivers of global laser capture microdissection market. In addition, emerging economies such as China, India and others will create new opportunities for global laser capture microdissection market. However, higher costs of instruments, accessories, and maintenance, and lack of skilled personnel and technical expertise are the key restraints for global laser capture microdissection market.
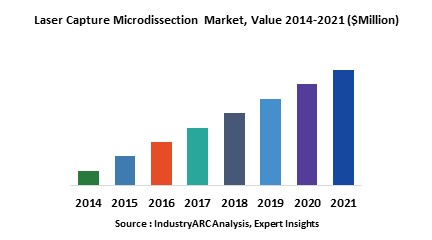
This report identifies the global laser capture microdissection market size in for the year 2014-2016, and forecast of the same for year 2021. It also highlights the potential growth opportunities in the coming years, while also reviewing the market drivers, restraints, growth indicators, challenges, market dynamics, competitive landscape, and other key aspects with respect to global laser capture microdissection market.
Geographically North America dominated global laser capture microdissection market due to availability of skilled personnel. Asia Pacific is projected to have fastest growth, owing to expansion of laser capture microdissection companies and R & D spending in this region. Among all the end-users, academic and government research institutes segment have the highest market share in global laser capture microdissection market. Ultraviolet laser capture microdissection leads the market among all types of laser capture microdissection. Majority of laser capture microdissection are used for research and development applications.
This report segments global laser capture microdissection market on the basis of product, type, application, end-user, and regional market as follows:
This report identifies all the major companies operating in the laser capture microdissection market. Some of the major companies’ profiles in detail are as follows:
This report identifies the global laser capture microdissection market size in for the year 2014-2016, and forecast of the same for year 2021. It also highlights the potential growth opportunities in the coming years, while also reviewing the market drivers, restraints, growth indicators, challenges, market dynamics, competitive landscape, and other key aspects with respect to global laser capture microdissection market.
Geographically North America dominated global laser capture microdissection market due to availability of skilled personnel. Asia Pacific is projected to have fastest growth, owing to expansion of laser capture microdissection companies and R & D spending in this region. Among all the end-users, academic and government research institutes segment have the highest market share in global laser capture microdissection market. Ultraviolet laser capture microdissection leads the market among all types of laser capture microdissection. Majority of laser capture microdissection are used for research and development applications.
This report segments global laser capture microdissection market on the basis of product, type, application, end-user, and regional market as follows:
- Laser Capture Microdissection Market, By Product: Instruments, Consumables, and Software and Services
- Laser Capture Microdissection Market, By Type: Ultraviolet Laser Capture Microdissection, Infrared Laser Capture Microdissection, Ultraviolet and Infrared Laser Capture Microdissection, and Immunofluorescence Laser Capture Microdissection
- Laser Capture Microdissection Market, By Application: Diagnostics, Research and Development, and others
- The report has focused study on laser capture microdissection market by basis of end-user such as: Academic and Government Research Institutes, Hospitals, Pharmaceutical and Biotechnology Companies, and Contract Research Organizations
- This report has been further segmented into major regions, which includes detailed analysis of each region such as: North America, Europe, Asia-Pacific (APAC), and Rest of the World (RoW) covering all the major country level markets in each of the region
This report identifies all the major companies operating in the laser capture microdissection market. Some of the major companies’ profiles in detail are as follows:
- Carl Zeiss Ag
- Danaher Corporation
- Thermo Fisher Scientific, Inc.
- Avansci BIO LLC
- Denova Sciences Pte. Ltd.
1. Laser Capture Microdissection – Market Overview
2. Executive Summary
3. Laser Capture Microdissection Market Landscape
3.1. Market Share Analysis
3.2. Comparative Analysis
3.3. Product Benchmarking
3.4. End User Profiling
3.5. Top 5 Financials Analysis
4. Laser Capture Microdissection – Market Forces
4.1. Drivers
4.1.1. Rising healthcare expenditure
4.1.2. Technique being contamination-free
4.1.3. Technological advancements
4.2. Restraints
4.2.1. Higher costs of instruments, accessories, and maintenance
4.2.2. lack of skilled personnel and technical expertise
4.3. Opportunities
4.3.1. Emerging economies
4.4. Porter’s Five Forces Analysis
4.4.1. Bargaining Power of Suppliers
4.4.2. Bargaining Power of Buyers
4.4.3. Threat of New Entrants
4.4.4. Threat of Substitutes
4.4.5. Degree of Competition
5. Laser Capture Microdissection Market, By Product
5.1. Instruments
5.2. Consumables
5.3. Software and Services
6. Laser Capture Microdissection Market, By Type
6.1. Ultraviolet Laser Capture Microdissection
6.2. Infrared Laser Capture Microdissection
6.3. Ultraviolet and Infrared Laser Capture Microdissection
6.4. Immunofluorescence Laser Capture Microdissection
7. Laser Capture Microdissection Market, By Application
7.1. Research & Development
7.2. Diagnostics
7.3. Others
8. Laser Capture Microdissection Market, By End-User
8.1. Academic and Government Research Institutes
8.2. Hospitals
8.3. Pharmaceutical and Biotechnology Companies
8.4. Contract Research Organizations
9. Global Laser Capture Microdissection Market, By Geography
9.1. Europe
9.1.1. Germany
9.1.2. France
9.1.3. Italy
9.1.4. Spain
9.1.5. Russia
9.1.6. U.K.
9.1.7. Rest of Europe
9.2. Asia Pacific
9.2.1. China
9.2.2. India
9.2.3. Japan
9.2.4. South Korea
9.2.5. Rest of Asia-Pacific
9.3. North America
9.3.1. U.S.
9.3.2. Canada
9.3.3. Mexico
9.4. Rest of the World (RoW)
9.4.1. Brazil
9.4.2. Rest of RoW
10. Laser Capture Microdissection – Market Entropy
10.1. Expansion
10.2. Technological Developments
10.3. Merger & Acquisitions, and Joint Ventures
10.4. Supply- Contract
11. Company Profiles
11.1. Carl Zeiss Ag
11.1.1. Introduction
11.1.2. Financials
11.1.3. Key Insights
11.1.4. Key Strategy
11.1.5. Product Portfolio
11.1.6. SWOT Analysis
11.2. Danaher Corporation
11.2.1. Introduction
11.2.2. Financials
11.2.3. Key Insights
11.2.4. Key Strategy
11.2.5. Product Portfolio
11.2.6. SWOT Analysis
11.3. Thermo Fisher Scientific, Inc.
11.3.1. Introduction
11.3.2. Financials
11.3.3. Key Insights
11.3.4. Key Strategy
11.3.5. Product Portfolio
11.3.6. SWOT Analysis
11.4. Avansci BIO LLC
11.4.1. Introduction
11.4.2. Financials
11.4.3. Key Insights
11.4.4. Key Strategy
11.4.5. Product Portfolio
11.4.6. SWOT Analysis
11.5. Denova Sciences Pte. Ltd.
11.5.1. Introduction
11.5.2. Financials
11.5.3. Key Insights
11.5.4. Key Strategy
11.5.5. Product Portfolio
11.5.6. SWOT Analysis
11.6. Indivumed GmbH
11.6.1. Introduction
11.6.2. Financials
11.6.3. Key Insights
11.6.4. Key Strategy
11.6.5. Product Portfolio
11.6.6. SWOT Analysis
11.7. Ocimum Biosolutions Ltd.
11.7.1. Introduction
11.7.2. Financials
11.7.3. Key Insights
11.7.4. Key Strategy
11.7.5. Product Portfolio
11.7.6. SWOT Analysis
11.8. Molecular Machines & Industries
11.8.1. Introduction
11.8.2. Financials
11.8.3. Key Insights
11.8.4. Key Strategy
11.8.5. Product Portfolio
11.8.6. SWOT Analysis
11.9. Theranostics Health Inc.
11.9.1. Introduction
11.9.2. Financials
11.9.3. Key Insights
11.9.4. Key Strategy
11.9.5. Product Portfolio
11.9.6. SWOT Analysis
11.10. 3dhistech Ltd
11.10.1. Introduction
11.10.2. Financials
11.10.3. Key Insights
11.10.4. Key Strategy
11.10.5. Product Portfolio
11.10.6. SWOT Analysis
*More than 40 Companies are profiled in this Research Report, Complete List available on Request*
"*Financials would be provided on a best efforts basis for private companies"
12. Appendix
12.1. Abbreviations
12.2. Sources
12.3. Research Methodology
12.4. Expert Insights
List of Tables:
Table 1: Laser Capture Microdissection Market Overview 2021-2026
Table 2: Laser Capture Microdissection Market Leader Analysis 2018-2019 (US$)
Table 3: Laser Capture Microdissection Market Product Analysis 2018-2019 (US$)
Table 4: Laser Capture Microdissection Market End User Analysis 2018-2019 (US$)
Table 5: Laser Capture Microdissection Market Patent Analysis 2013-2018* (US$)
Table 6: Laser Capture Microdissection Market Financial Analysis 2018-2019 (US$)
Table 7: Laser Capture Microdissection Market Driver Analysis 2018-2019 (US$)
Table 8: Laser Capture Microdissection Market Challenges Analysis 2018-2019 (US$)
Table 9: Laser Capture Microdissection Market Constraint Analysis 2018-2019 (US$)
Table 10: Laser Capture Microdissection Market Supplier Bargaining Power Analysis 2018-2019 (US$)
Table 11: Laser Capture Microdissection Market Buyer Bargaining Power Analysis 2018-2019 (US$)
Table 12: Laser Capture Microdissection Market Threat of Substitutes Analysis 2018-2019 (US$)
Table 13: Laser Capture Microdissection Market Threat of New Entrants Analysis 2018-2019 (US$)
Table 14: Laser Capture Microdissection Market Degree of Competition Analysis 2018-2019 (US$)
Table 15: Laser Capture Microdissection Market Value Chain Analysis 2018-2019 (US$)
Table 16: Laser Capture Microdissection Market Pricing Analysis 2021-2026 (US$)
Table 17: Laser Capture Microdissection Market Opportunities Analysis 2021-2026 (US$)
Table 18: Laser Capture Microdissection Market Product Life Cycle Analysis 2021-2026 (US$)
Table 19: Laser Capture Microdissection Market Supplier Analysis 2018-2019 (US$)
Table 20: Laser Capture Microdissection Market Distributor Analysis 2018-2019 (US$)
Table 21: Laser Capture Microdissection Market Trend Analysis 2018-2019 (US$)
Table 22: Laser Capture Microdissection Market Size 2018 (US$)
Table 23: Laser Capture Microdissection Market Forecast Analysis 2021-2026 (US$)
Table 24: Laser Capture Microdissection Market Sales Forecast Analysis 2021-2026 (Units)
Table 25: Laser Capture Microdissection Market , Revenue & Volume,By Type, 2021-2026 ($)
Table 26: Laser Capture Microdissection Market By Type, Revenue & Volume,By Ultraviolet Laser Capture Microdissection, 2021-2026 ($)
Table 27: Laser Capture Microdissection Market By Type, Revenue & Volume,By Infrared Laser Capture Microdissection, 2021-2026 ($)
Table 28: Laser Capture Microdissection Market By Type, Revenue & Volume,By Ultraviolet and Infrared Laser Capture Microdissection, 2021-2026 ($)
Table 29: Laser Capture Microdissection Market By Type, Revenue & Volume,By Immunofluorescence Laser Capture Microdissection, 2021-2026 ($)
Table 30: Laser Capture Microdissection Market , Revenue & Volume,By Product, 2021-2026 ($)
Table 31: Laser Capture Microdissection Market By Product, Revenue & Volume,By Instruments, 2021-2026 ($)
Table 32: Laser Capture Microdissection Market By Product, Revenue & Volume,By Consumables, 2021-2026 ($)
Table 33: Laser Capture Microdissection Market By Product, Revenue & Volume,By Software and Services , 2021-2026 ($)
Table 34: Laser Capture Microdissection Market , Revenue & Volume,By Application, 2021-2026 ($)
Table 35: Laser Capture Microdissection Market By Application, Revenue & Volume,By Research & Development, 2021-2026 ($)
Table 36: Laser Capture Microdissection Market By Application, Revenue & Volume,By Diagnostics, 2021-2026 ($)
Table 37: Laser Capture Microdissection Market , Revenue & Volume,By End-User, 2021-2026 ($)
Table 38: Laser Capture Microdissection Market By End-User, Revenue & Volume,By Academic and Government Research Institutes , 2021-2026 ($)
Table 39: Laser Capture Microdissection Market By End-User, Revenue & Volume,By Hospitals , 2021-2026 ($)
Table 40: Laser Capture Microdissection Market By End-User, Revenue & Volume,By Pharmaceutical and Biotechnology Companies , 2021-2026 ($)
Table 41: Laser Capture Microdissection Market By End-User, Revenue & Volume,By Contract Research Organizations, 2021-2026 ($)
Table 42: North America Laser Capture Microdissection Market , Revenue & Volume,By Type, 2021-2026 ($)
Table 43: North America Laser Capture Microdissection Market , Revenue & Volume,By Product, 2021-2026 ($)
Table 44: North America Laser Capture Microdissection Market , Revenue & Volume,By Application, 2021-2026 ($)
Table 45: North America Laser Capture Microdissection Market , Revenue & Volume,By End-User, 2021-2026 ($)
Table 46: South america Laser Capture Microdissection Market , Revenue & Volume,By Type, 2021-2026 ($)
Table 47: South america Laser Capture Microdissection Market , Revenue & Volume,By Product, 2021-2026 ($)
Table 48: South america Laser Capture Microdissection Market , Revenue & Volume,By Application, 2021-2026 ($)
Table 49: South america Laser Capture Microdissection Market , Revenue & Volume,By End-User, 2021-2026 ($)
Table 50: Europe Laser Capture Microdissection Market , Revenue & Volume,By Type, 2021-2026 ($)
Table 51: Europe Laser Capture Microdissection Market , Revenue & Volume,By Product, 2021-2026 ($)
Table 52: Europe Laser Capture Microdissection Market , Revenue & Volume,By Application, 2021-2026 ($)
Table 53: Europe Laser Capture Microdissection Market , Revenue & Volume,By End-User, 2021-2026 ($)
Table 54: APAC Laser Capture Microdissection Market , Revenue & Volume,By Type, 2021-2026 ($)
Table 55: APAC Laser Capture Microdissection Market , Revenue & Volume,By Product, 2021-2026 ($)
Table 56: APAC Laser Capture Microdissection Market , Revenue & Volume,By Application, 2021-2026 ($)
Table 57: APAC Laser Capture Microdissection Market , Revenue & Volume,By End-User, 2021-2026 ($)
Table 58: Middle East & Africa Laser Capture Microdissection Market , Revenue & Volume,By Type, 2021-2026 ($)
Table 59: Middle East & Africa Laser Capture Microdissection Market , Revenue & Volume,By Product, 2021-2026 ($)
Table 60: Middle East & Africa Laser Capture Microdissection Market , Revenue & Volume,By Application, 2021-2026 ($)
Table 61: Middle East & Africa Laser Capture Microdissection Market , Revenue & Volume,By End-User, 2021-2026 ($)
Table 62: Russia Laser Capture Microdissection Market , Revenue & Volume,By Type, 2021-2026 ($)
Table 63: Russia Laser Capture Microdissection Market , Revenue & Volume,By Product, 2021-2026 ($)
Table 64: Russia Laser Capture Microdissection Market , Revenue & Volume,By Application, 2021-2026 ($)
Table 65: Russia Laser Capture Microdissection Market , Revenue & Volume,By End-User, 2021-2026 ($)
Table 66: Israel Laser Capture Microdissection Market , Revenue & Volume,By Type, 2021-2026 ($)
Table 67: Israel Laser Capture Microdissection Market , Revenue & Volume,By Product, 2021-2026 ($)
Table 68: Israel Laser Capture Microdissection Market , Revenue & Volume,By Application, 2021-2026 ($)
Table 69: Israel Laser Capture Microdissection Market , Revenue & Volume,By End-User, 2021-2026 ($)
Table 70: Top Companies 2018 (US$) Laser Capture Microdissection Market , Revenue & Volume
Table 71: Product Launch 2018-2019 Laser Capture Microdissection Market , Revenue & Volume
Table 72: Mergers & Acquistions 2018-2019 Laser Capture Microdissection Market , Revenue & Volume
List of Figures:
Figure 1: Overview of Laser Capture Microdissection Market 2021-2026
Figure 2: Market Share Analysis for Laser Capture Microdissection Market 2018 (US$)
Figure 3: Product Comparison in Laser Capture Microdissection Market 2018-2019 (US$)
Figure 4: End User Profile for Laser Capture Microdissection Market 2018-2019 (US$)
Figure 5: Patent Application and Grant in Laser Capture Microdissection Market 2013-2018* (US$)
Figure 6: Top 5 Companies Financial Analysis in Laser Capture Microdissection Market 2018-2019 (US$)
Figure 7: Market Entry Strategy in Laser Capture Microdissection Market 2018-2019
Figure 8: Ecosystem Analysis in Laser Capture Microdissection Market 2018
Figure 9: Average Selling Price in Laser Capture Microdissection Market 2021-2026
Figure 10: Top Opportunites in Laser Capture Microdissection Market 2018-2019
Figure 11: Market Life Cycle Analysis in Laser Capture Microdissection Market
Figure 12: GlobalBy TypeLaser Capture Microdissection Market Revenue, 2021-2026 ($)
Figure 13: GlobalBy ProductLaser Capture Microdissection Market Revenue, 2021-2026 ($)
Figure 14: GlobalBy ApplicationLaser Capture Microdissection Market Revenue, 2021-2026 ($)
Figure 15: GlobalBy End-UserLaser Capture Microdissection Market Revenue, 2021-2026 ($)
Figure 16: Global Laser Capture Microdissection Market - By Geography
Figure 17: Global Laser Capture Microdissection Market Value & Volume, By Geography, 2021-2026 ($)
Figure 18: Global Laser Capture Microdissection Market CAGR, By Geography, 2021-2026 (%)
Figure 19: North America Laser Capture Microdissection Market Value & Volume, 2021-2026 ($)
Figure 20: US Laser Capture Microdissection Market Value & Volume, 2021-2026 ($)
Figure 21: US GDP and Population, 2018-2019 ($)
Figure 22: US GDP – Composition of 2018, By Sector of Origin
Figure 23: US Export and Import Value & Volume, 2018-2019 ($)
Figure 24: Canada Laser Capture Microdissection Market Value & Volume, 2021-2026 ($)
Figure 25: Canada GDP and Population, 2018-2019 ($)
Figure 26: Canada GDP – Composition of 2018, By Sector of Origin
Figure 27: Canada Export and Import Value & Volume, 2018-2019 ($)
Figure 28: Mexico Laser Capture Microdissection Market Value & Volume, 2021-2026 ($)
Figure 29: Mexico GDP and Population, 2018-2019 ($)
Figure 30: Mexico GDP – Composition of 2018, By Sector of Origin
Figure 31: Mexico Export and Import Value & Volume, 2018-2019 ($)
Figure 32: South America Laser Capture Microdissection Market South America 3D Printing Market Value & Volume, 2021-2026 ($)
Figure 33: Brazil Laser Capture Microdissection Market Value & Volume, 2021-2026 ($)
Figure 34: Brazil GDP and Population, 2018-2019 ($)
Figure 35: Brazil GDP – Composition of 2018, By Sector of Origin
Figure 36: Brazil Export and Import Value & Volume, 2018-2019 ($)
Figure 37: Venezuela Laser Capture Microdissection Market Value & Volume, 2021-2026 ($)
Figure 38: Venezuela GDP and Population, 2018-2019 ($)
Figure 39: Venezuela GDP – Composition of 2018, By Sector of Origin
Figure 40: Venezuela Export and Import Value & Volume, 2018-2019 ($)
Figure 41: Argentina Laser Capture Microdissection Market Value & Volume, 2021-2026 ($)
Figure 42: Argentina GDP and Population, 2018-2019 ($)
Figure 43: Argentina GDP – Composition of 2018, By Sector of Origin
Figure 44: Argentina Export and Import Value & Volume, 2018-2019 ($)
Figure 45: Ecuador Laser Capture Microdissection Market Value & Volume, 2021-2026 ($)
Figure 46: Ecuador GDP and Population, 2018-2019 ($)
Figure 47: Ecuador GDP – Composition of 2018, By Sector of Origin
Figure 48: Ecuador Export and Import Value & Volume, 2018-2019 ($)
Figure 49: Peru Laser Capture Microdissection Market Value & Volume, 2021-2026 ($)
Figure 50: Peru GDP and Population, 2018-2019 ($)
Figure 51: Peru GDP – Composition of 2018, By Sector of Origin
Figure 52: Peru Export and Import Value & Volume, 2018-2019 ($)
Figure 53: Colombia Laser Capture Microdissection Market Value & Volume, 2021-2026 ($)
Figure 54: Colombia GDP and Population, 2018-2019 ($)
Figure 55: Colombia GDP – Composition of 2018, By Sector of Origin
Figure 56: Colombia Export and Import Value & Volume, 2018-2019 ($)
Figure 57: Costa Rica Laser Capture Microdissection Market Costa Rica 3D Printing Market Value & Volume, 2021-2026 ($)
Figure 58: Costa Rica GDP and Population, 2018-2019 ($)
Figure 59: Costa Rica GDP – Composition of 2018, By Sector of Origin
Figure 60: Costa Rica Export and Import Value & Volume, 2018-2019 ($)
Figure 61: Europe Laser Capture Microdissection Market Value & Volume, 2021-2026 ($)
Figure 62: U.K Laser Capture Microdissection Market Value & Volume, 2021-2026 ($)
Figure 63: U.K GDP and Population, 2018-2019 ($)
Figure 64: U.K GDP – Composition of 2018, By Sector of Origin
Figure 65: U.K Export and Import Value & Volume, 2018-2019 ($)
Figure 66: Germany Laser Capture Microdissection Market Value & Volume, 2021-2026 ($)
Figure 67: Germany GDP and Population, 2018-2019 ($)
Figure 68: Germany GDP – Composition of 2018, By Sector of Origin
Figure 69: Germany Export and Import Value & Volume, 2018-2019 ($)
Figure 70: Italy Laser Capture Microdissection Market Value & Volume, 2021-2026 ($)
Figure 71: Italy GDP and Population, 2018-2019 ($)
Figure 72: Italy GDP – Composition of 2018, By Sector of Origin
Figure 73: Italy Export and Import Value & Volume, 2018-2019 ($)
Figure 74: France Laser Capture Microdissection Market Value & Volume, 2021-2026 ($)
Figure 75: France GDP and Population, 2018-2019 ($)
Figure 76: France GDP – Composition of 2018, By Sector of Origin
Figure 77: France Export and Import Value & Volume, 2018-2019 ($)
Figure 78: Netherlands Laser Capture Microdissection Market Value & Volume, 2021-2026 ($)
Figure 79: Netherlands GDP and Population, 2018-2019 ($)
Figure 80: Netherlands GDP – Composition of 2018, By Sector of Origin
Figure 81: Netherlands Export and Import Value & Volume, 2018-2019 ($)
Figure 82: Belgium Laser Capture Microdissection Market Value & Volume, 2021-2026 ($)
Figure 83: Belgium GDP and Population, 2018-2019 ($)
Figure 84: Belgium GDP – Composition of 2018, By Sector of Origin
Figure 85: Belgium Export and Import Value & Volume, 2018-2019 ($)
Figure 86: Spain Laser Capture Microdissection Market Value & Volume, 2021-2026 ($)
Figure 87: Spain GDP and Population, 2018-2019 ($)
Figure 88: Spain GDP – Composition of 2018, By Sector of Origin
Figure 89: Spain Export and Import Value & Volume, 2018-2019 ($)
Figure 90: Denmark Laser Capture Microdissection Market Value & Volume, 2021-2026 ($)
Figure 91: Denmark GDP and Population, 2018-2019 ($)
Figure 92: Denmark GDP – Composition of 2018, By Sector of Origin
Figure 93: Denmark Export and Import Value & Volume, 2018-2019 ($)
Figure 94: APAC Laser Capture Microdissection Market Value & Volume, 2021-2026 ($)
Figure 95: China Laser Capture Microdissection Market Value & Volume, 2021-2026
Figure 96: China GDP and Population, 2018-2019 ($)
Figure 97: China GDP – Composition of 2018, By Sector of Origin
Figure 98: China Export and Import Value & Volume, 2018-2019 ($)Laser Capture Microdissection Market China Export and Import Value & Volume, 2018-2019 ($)
Figure 99: Australia Laser Capture Microdissection Market Value & Volume, 2021-2026 ($)
Figure 100: Australia GDP and Population, 2018-2019 ($)
Figure 101: Australia GDP – Composition of 2018, By Sector of Origin
Figure 102: Australia Export and Import Value & Volume, 2018-2019 ($)
Figure 103: South Korea Laser Capture Microdissection Market Value & Volume, 2021-2026 ($)
Figure 104: South Korea GDP and Population, 2018-2019 ($)
Figure 105: South Korea GDP – Composition of 2018, By Sector of Origin
Figure 106: South Korea Export and Import Value & Volume, 2018-2019 ($)
Figure 107: India Laser Capture Microdissection Market Value & Volume, 2021-2026 ($)
Figure 108: India GDP and Population, 2018-2019 ($)
Figure 109: India GDP – Composition of 2018, By Sector of Origin
Figure 110: India Export and Import Value & Volume, 2018-2019 ($)
Figure 111: Taiwan Laser Capture Microdissection Market Taiwan 3D Printing Market Value & Volume, 2021-2026 ($)
Figure 112: Taiwan GDP and Population, 2018-2019 ($)
Figure 113: Taiwan GDP – Composition of 2018, By Sector of Origin
Figure 114: Taiwan Export and Import Value & Volume, 2018-2019 ($)
Figure 115: Malaysia Laser Capture Microdissection Market Malaysia 3D Printing Market Value & Volume, 2021-2026 ($)
Figure 116: Malaysia GDP and Population, 2018-2019 ($)
Figure 117: Malaysia GDP – Composition of 2018, By Sector of Origin
Figure 118: Malaysia Export and Import Value & Volume, 2018-2019 ($)
Figure 119: Hong Kong Laser Capture Microdissection Market Hong Kong 3D Printing Market Value & Volume, 2021-2026 ($)
Figure 120: Hong Kong GDP and Population, 2018-2019 ($)
Figure 121: Hong Kong GDP – Composition of 2018, By Sector of Origin
Figure 122: Hong Kong Export and Import Value & Volume, 2018-2019 ($)
Figure 123: Middle East & Africa Laser Capture Microdissection Market Middle East & Africa 3D Printing Market Value & Volume, 2021-2026 ($)
Figure 124: Russia Laser Capture Microdissection Market Russia 3D Printing Market Value & Volume, 2021-2026 ($)
Figure 125: Russia GDP and Population, 2018-2019 ($)
Figure 126: Russia GDP – Composition of 2018, By Sector of Origin
Figure 127: Russia Export and Import Value & Volume, 2018-2019 ($)
Figure 128: Israel Laser Capture Microdissection Market Value & Volume, 2021-2026 ($)
Figure 129: Israel GDP and Population, 2018-2019 ($)
Figure 130: Israel GDP – Composition of 2018, By Sector of Origin
Figure 131: Israel Export and Import Value & Volume, 2018-2019 ($)
Figure 132: Entropy Share, By Strategies, 2018-2019* (%)Laser Capture Microdissection Market
Figure 133: Developments, 2018-2019*Laser Capture Microdissection Market
Figure 134: Company 1 Laser Capture Microdissection Market Net Revenue, By Years, 2018-2019* ($)
Figure 135: Company 1 Laser Capture Microdissection Market Net Revenue Share, By Business segments, 2018 (%)
Figure 136: Company 1 Laser Capture Microdissection Market Net Sales Share, By Geography, 2018 (%)
Figure 137: Company 2 Laser Capture Microdissection Market Net Revenue, By Years, 2018-2019* ($)
Figure 138: Company 2 Laser Capture Microdissection Market Net Revenue Share, By Business segments, 2018 (%)
Figure 139: Company 2 Laser Capture Microdissection Market Net Sales Share, By Geography, 2018 (%)
Figure 140: Company 3Laser Capture Microdissection Market Net Revenue, By Years, 2018-2019* ($)
Figure 141: Company 3Laser Capture Microdissection Market Net Revenue Share, By Business segments, 2018 (%)
Figure 142: Company 3Laser Capture Microdissection Market Net Sales Share, By Geography, 2018 (%)
Figure 143: Company 4 Laser Capture Microdissection Market Net Revenue, By Years, 2018-2019* ($)
Figure 144: Company 4 Laser Capture Microdissection Market Net Revenue Share, By Business segments, 2018 (%)
Figure 145: Company 4 Laser Capture Microdissection Market Net Sales Share, By Geography, 2018 (%)
Figure 146: Company 5 Laser Capture Microdissection Market Net Revenue, By Years, 2018-2019* ($)
Figure 147: Company 5 Laser Capture Microdissection Market Net Revenue Share, By Business segments, 2018 (%)
Figure 148: Company 5 Laser Capture Microdissection Market Net Sales Share, By Geography, 2018 (%)
Figure 149: Company 6 Laser Capture Microdissection Market Net Revenue, By Years, 2018-2019* ($)
Figure 150: Company 6 Laser Capture Microdissection Market Net Revenue Share, By Business segments, 2018 (%)
Figure 151: Company 6 Laser Capture Microdissection Market Net Sales Share, By Geography, 2018 (%)
Figure 152: Company 7 Laser Capture Microdissection Market Net Revenue, By Years, 2018-2019* ($)
Figure 153: Company 7 Laser Capture Microdissection Market Net Revenue Share, By Business segments, 2018 (%)
Figure 154: Company 7 Laser Capture Microdissection Market Net Sales Share, By Geography, 2018 (%)
Figure 155: Company 8 Laser Capture Microdissection Market Net Revenue, By Years, 2018-2019* ($)
Figure 156: Company 8 Laser Capture Microdissection Market Net Revenue Share, By Business segments, 2018 (%)
Figure 157: Company 8 Laser Capture Microdissection Market Net Sales Share, By Geography, 2018 (%)
Figure 158: Company 9 Laser Capture Microdissection Market Net Revenue, By Years, 2018-2019* ($)
Figure 159: Company 9 Laser Capture Microdissection Market Net Revenue Share, By Business segments, 2018 (%)
Figure 160: Company 9 Laser Capture Microdissection Market Net Sales Share, By Geography, 2018 (%)
Figure 161: Company 10 Laser Capture Microdissection Market Net Revenue, By Years, 2018-2019* ($)
Figure 162: Company 10 Laser Capture Microdissection Market Net Revenue Share, By Business segments, 2018 (%)
Figure 163: Company 10 Laser Capture Microdissection Market Net Sales Share, By Geography, 2018 (%)
Figure 164: Company 11 Laser Capture Microdissection Market Net Revenue, By Years, 2018-2019* ($)
Figure 165: Company 11 Laser Capture Microdissection Market Net Revenue Share, By Business segments, 2018 (%)
Figure 166: Company 11 Laser Capture Microdissection Market Net Sales Share, By Geography, 2018 (%)
Figure 167: Company 12 Laser Capture Microdissection Market Net Revenue, By Years, 2018-2019* ($)
Figure 168: Company 12 Laser Capture Microdissection Market Net Revenue Share, By Business segments, 2018 (%)
Figure 169: Company 12 Laser Capture Microdissection Market Net Sales Share, By Geography, 2018 (%)
Figure 170: Company 13 Laser Capture Microdissection Market Net Revenue, By Years, 2018-2019* ($)
Figure 171: Company 13 Laser Capture Microdissection Market Net Revenue Share, By Business segments, 2018 (%)
Figure 172: Company 13 Laser Capture Microdissection Market Net Sales Share, By Geography, 2018 (%)
Figure 173: Company 14 Laser Capture Microdissection Market Net Revenue, By Years, 2018-2019* ($)
Figure 174: Company 14 Laser Capture Microdissection Market Net Revenue Share, By Business segments, 2018 (%)
Figure 175: Company 14 Laser Capture Microdissection Market Net Sales Share, By Geography, 2018 (%)
Figure 176: Company 15 Laser Capture Microdissection Market Net Revenue, By Years, 2018-2019* ($)
Figure 177: Company 15 Laser Capture Microdissection Market Net Revenue Share, By Business segments, 2018 (%)
Figure 178: Company 15 Laser Capture Microdissection Market Net Sales Share, By Geography, 2018 (%)