Hydrogen Sulfide Market - Forecast(2024 - 2030)

Report Code: CMR 0365 Report Format: PDF + Excel

Hydrogen Sulfide Market Overview

The Hydrogen Sulfide Market size is estimated to reach US$268.1 million by 2027, after growing at a CAGR of 3.7% during the forecast period 2022-2027. Hydrogen sulfide is a colorless chalcogen hydride gas, naturally found in crude oil, natural gas and hot springs. It is a good reducing agent and is formed due to microbial breakdown of organic matter. This sour gas reacts with the sulfur dioxide to form water and elemental sulfur, which is majorly used in fertilizers and pesticides in the agriculture sector. The growing demand for fertilizers and disinfectants for crop protection act as a driving factor in the hydrogen sulfide industry. In addition, major production in the chemical industry for organic synthesis, sulfur production and others is fueling its demand and propelling growth scope in the hydrogen sulfide market. The major disruption caused by the covid-19 outbreak impacted the growth of the hydrogen sulfide market due to disturbance in chemical manufacturing, rise in raw material price, supply chain disruption and other lockdown restrictions. However, significant recovery in the major end-use sector is boosting the demand for hydrogen sulfide for a wide range of applicability and utilization in medical & pharmaceutical, chemical manufacturing, agriculture and others.

Hydrogen Sulfide Market Report Coverage

The “Hydrogen Sulfide Market Report – Forecast (2022-2027)” by IndustryARC, covers an in-depth analysis of the following segments in the Hydrogen Sulfide Industry.

By Grade: Technical Grade and Purified Grade.
By Application: Pesticides, Dyes, Leather, Disinfectant, Sulfuric Acid Production and Others.
By End-use Industry: Medical & Pharmaceuticals, Chemicals, Oil & Gas (Onshore and Offshore), Metal & Metallurgy, Plastics, Agriculture and Others.
By Geography: North America (the USA, Canada and Mexico), Europe (UK, Germany, France, Italy, Netherlands, Spain, Belgium and the Rest of Europe), Asia-Pacific (China, Japan, India, South Korea, Australia and New Zealand, Indonesia, Taiwan, Malaysia and Rest of APAC), South America (Brazil, Argentina, Colombia, Chile and Rest of South America), Rest of the World [Middle-East (Saudi Arabia, UAE, Israel and Rest of the Middle-East) and Africa (South Africa, Nigeria and Rest of Africa)].

Key Takeaways

  • The Asia-Pacific dominates the Hydrogen Sulfide Market, owing to growth factors such as the flourished base for the chemical sector, initiatives towards agricultural and medical trends and urbanization, thereby boosting growth in this region.
  • The flourishing chemical sector across the world is propelling the demand for hydrogen sulfide for various applications such as manufacturing of sulfuric acid and sulfur and others, thereby influencing the growth in the hydrogen sulfide market size.
  • The demand for hydrogen sulfide in the agriculture sector is rising for applicability in pesticides, fertilizers, disinfectants and others, owing to flourishing agricultural production trends.
  • However, the hazardous impacts of hydrogen sulfide on human health act as a challenging factor in the hydrogen sulfide industry.

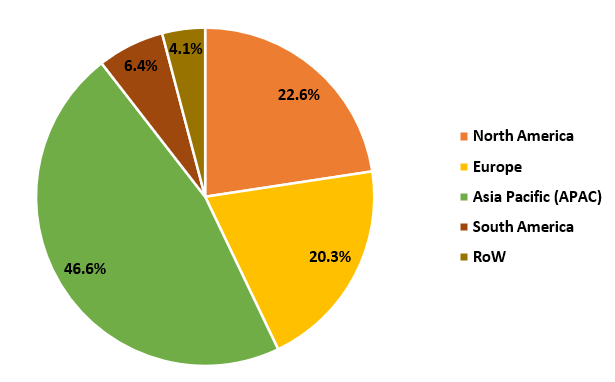
Figure: Hydrogen Sulfide Market Revenue Share, By Geography, 2021 (%)

Hydrogen Sulfide Market

For More Details On this report - Request For Sample

Hydrogen Sulfide Market Segment Analysis – by Grade

The echnical grade segment held a significant Hydrogen Sulfide Market share in 2021 and is forecasted to grow at a CAGR of 3.5% during the forecast period 2022-2027. The rising growth scope and demand for the technical grade over the purified grade is influenced by its high purity and wide range of applicability across various industrial verticals, which include chemical synthesis and components in balance gases. It is increasingly used in environmental monitoring uses and is utilized as a precursor for the growing zinc sulfide semiconductor. Thus, owing to its preference over purified grade and growing applications for the majority of industries, majorly the chemical sector, the technical grade segment is anticipated to grow rapidly in the hydrogen sulfide market during the forecast period.

Hydrogen Sulfide Market Segment Analysis – by End-use Industry

The chemicals segment held a significant Hydrogen Sulfide Market share in 2021 and is forecasted to grow at a CAGR of 3.9% during the forecast period 2022-2027. Hydrogen sulfide is a chalcogen hydride gas, which has a wide range of applications in the chemical sector involving the manufacturing of sulfuric acid and sulfur by reacting with sulfur dioxide, which is used in pesticides and dyes. The lucrative growth of the chemical sector is influenced by growth factors such as an established base for specialty chemical manufacturing units, demand for organic and inorganic chemicals and rapid industrialization. For instance, according to the American Chemistry Council (ACC), the chemical sector output in the U.S. is expected to grow by 4.1% in 2022 and expand to 2.4% growth in 2023. According to BASF Report 2021, chemical production in European Union expects a growth of 2.8% in 2022 and a 4.5% growth in chemical production in the United States. With the increase in growth scope and productivity in the chemical sector, the applicability of this sour gas for the production of sulfuric acid and other compounds is projected to rise, which, in turn, is expected to boost the growth of the chemical industry in the hydrogen sulfide market during the forecast period.

Hydrogen Sulfide Market Segment Analysis – by Geography

The Asia-Pacific held the largest Hydrogen Sulfide Market share in 2021 up to 47%. The lucrative growth scope for hydrogen sulfide in this region is influenced by the established base for the chemical sector, flourishing manufacturing base for agrochemicals, trade growth and rapid urbanization. The chemical industry is significantly growing in APAC owing to factors such as rising demand for specialty, petrochemicals, agrochemicals and others, along with an established production base and urbanization. For instance, according to The European Chemical Industry Council (CEFIC), chemical sales reached US$1,549 billion in 2020 in China, US$427 billion in the US and US$499.67 billion in the European Union nation. According to BASF annual report, chemical production in Japan accounted for a change of 1.7% increase in 2021-22 compared to the previous year. According to the India Brand Equity Foundation (IBEF), the chemical industry in India is expected to grow at 9.3% to reach US$304 billion by 2025. With the flourishing production of chemicals and related derivatives, the utilization of hydrogen sulfide for agricultural fertilizer chemicals, organic synthesis and others is growing, which, in turn, is projected to boost the growth prospects in the Asia-Pacific region during the forecast period.

Hydrogen Sulfide Market Drivers

Rapid Growth of the Medical & Pharmaceutical Industry:

Hydrogen Sulfide has major applications in the medical & pharmaceutical sector for the preparation of various therapeutical drugs and other medical treatment procedures. The medical & pharmaceutical industry is significantly growing due to growth factors such as high spending on drugs, growing healthcare infrastructure and a high rate of chronic health incidents. For instance, according to the India Brand Equity Foundation (IBEF), the Indian pharmaceuticals sector is expected to reach US$65 billion by 2024 and further expand to US$120 - US$130 billion by the year 2030. According to the European Federation of Pharmaceutical Industries and Associations (EFPIA), the total pharmaceutical market value for EU member nations at ex-factory prices increased from US$147,686 in 2019 to US$253,027 in 2020. According to the International Trade Administration, the worldwide pharmaceuticals market was estimated to grow from US$ 1 trillion in 2015 to US$1.3 trillion by 2020. With the rapid growth scope and production trend in the medical sector, the demand for this chalcogen hydride gas for therapeutics and general medication is rising, which, in turn, is boosting its applicability and driving the hydrogen sulfide industry.

Flourishing Growth of the Agriculture Industry:

Hydrogen Sulfide has significant applications in the agriculture industry for fertilizers, pesticides and other disinfectant chemicals. The hydrogen sulfide reacts with sulfur dioxide to produce elemental sulfur, which is utilized for manufacturing fertilizers. The agriculture sector experiences lucrative growth owing to growth factors such as rising production for grains, cereals and others, demand for fertilizer and pesticides and the government's initiative to promote agricultural development. For instance, according to the India Brand Equity Foundation (IBEF), the agriculture sector in India is expected to increase to US$24 billion by 2025. According to the Office for National Statistics, the volume of agricultural output increased by 2.6% in the United Kingdom with cereals output increased by 23% and 24% for the crop products in 2021. With the growing demand and increasing agricultural production, the applicability of hydrogen sulfide in pesticides and fertilizers is rising, which, in turn, is boosting its demand and driving the hydrogen sulfide industry.

Hydrogen Sulfide Market Challenge

Harmful Impacts of Hydrogen Sulfide on Human Health:

Hydrogen sulfide poses severe health risks due to its toxicity. The problems such as brain problems, heart issues, respiratory tract problems and others associated with hydrogen sulfide hinder its growth. In addition, a high concentration of this flammable and sour gas can lead to loss of consciousness, headache, shortness of breath, blue skin and memory loss. Moreover, the high flammability of hydrogen sulfide limits its applications due to handling issues. Thus, due to such hazardous impacts of hydrogen sulfide, various restrictions on its applicability and demand are regulated, which hinders the growth scope. Thus, the hydrogen sulfide industry anticipates a major challenge.

Hydrogen Sulfide Industry Outlook

Technology launches, acquisitions and R&D activities are key strategies adopted by players in the Hydrogen Sulfide Market. The top 10 companies in the Hydrogen Sulfide Market are:

  1. Air Liquide
  2. The Linde Group
  3. Praxair
  4. Air Products and Chemicals
  5. Evonik Industries
  6. Sobegi
  7. Messer Group
  8. Matheson Tri-Gas
  9. Dow Chemical
  10. Chengdu Taiyu Industrial Gases Co. Ltd.

Recent Development

  • In December 2021, researchers from IISc found the latest utilization of hydrogen sulfide for suppressing HIV as increased hydrogen sulfide gas reduces the multiplication rate of the virus, thereby finding growth in the medical sector.

Relevant Reports

Merchant Hydrogen Market - Industry Analysis, Market Size, Share, Trends, Application Analysis, Growth and Forecast Analysis

Report Code: CMR 1316

Elemental Sulfur Market - Industry Analysis, Market Size, Share, Trends, Application Analysis, Growth and Forecast Analysis

Report Code: CMR 53848

Hydrogen Gas Market - Industry Analysis, Market Size, Share, Trends, Application Analysis, Growth and Forecast Analysis

Report Code: CMR 38256

For more Chemicals and Materials Market reports, please click here

1. Hydrogen Sulfide Market - Market Overview
    1.1 Definitions and Scope
2. Hydrogen Sulfide Market - Executive Summary
    2.1 Key Trends by Grade
    2.2 Key Trends by Application
    2.3 Key Trends by End-use Industry
    2.4 Key Trends by Geography
3. Hydrogen Sulfide Market – Comparative analysis
    3.1 Market Share Analysis - Major Companies
    3.2 Product Benchmarking - Major Companies
    3.3 Top 5 Financials Analysis
    3.4 Patent Analysis - Major Companies
    3.5 Pricing Analysis (ASPs will be provided)
4. Hydrogen Sulfide Market - Startup companies Scenario Premium Premium
    4.1 Major startup company analysis:
        4.1.1 Investment
        4.1.2 Revenue
        4.1.3 Product portfolio
        4.1.4 Venture Capital and Funding Scenario
5. Hydrogen Sulfide Market – Industry Market Entry Scenario Premium Premium
    5.1 Regulatory Framework Overview
    5.2 New Business and Ease of Doing Business Index
    5.3 Successful Venture Profiles
    5.4 Customer Analysis – Major companies
6. Hydrogen Sulfide Market - Market Forces
    6.1 Market Drivers
    6.2 Market Constraints
    6.3 Porter's Five Force Model
        6.3.1 Bargaining Power of Suppliers
        6.3.2 Bargaining Powers of Buyers
        6.3.3 Threat of New Entrants
        6.3.4 Competitive Rivalry
        6.3.5 Threat of Substitutes
7. Hydrogen Sulfide Market – Strategic Analysis
    7.1 Value/Supply Chain Analysis
    7.2 Opportunity Analysis
    7.3 Product/Market Life Cycle
    7.4 Distributor Analysis – Major Companies
8. Hydrogen Sulfide Market – By Grade (Market size – US$ Million/Billion)
    8.1 Technical Grade
    8.2 Purified Grade
9. Hydrogen Sulfide Market – by Application (Market size – US$ Million/Billion)
    9.1 Pesticides
    9.2 Dyes
    9.3 Leather
    9.4 Disinfectant
    9.5 Sulfuric Acid Production
    9.6 Others
10. Hydrogen Sulfide Market - by End-use Industry (Market Size - US$ Million/Billion)
    10.1 Medical & Pharmaceuticals
    10.2 Chemicals
    10.3 Oil & Gas
        10.3.1 Onshore
        10.3.2 Offshore
    10.4 Metal & Metallurgy
    10.5 Plastics
    10.6 Agriculture
    10.7 Others
11. Hydrogen Sulfide Market - by Geography (Market Size - US$ Million/Billion)
    11.1 North America
        11.1.1 the USA
        11.1.2 Canada
        11.1.3 Mexico
    11.2 Europe
        11.2.1 the UK
        11.2.2 Germany
        11.2.3 France
        11.2.4 Italy
        11.2.5 the Netherlands
        11.2.6 Spain
        11.2.7 Belgium
        11.2.8 Rest of Europe
    11.3 Asia-Pacific
        11.3.1 China
        11.3.2 Japan
        11.3.3 India
        11.3.4 South Korea
        11.3.5 Australia and New Zeeland
        11.3.6 Indonesia
        11.3.7 Taiwan
        11.3.8 Malaysia
        11.3.9 Rest of APAC
    11.4 South America
        11.4.1 Brazil
        11.4.2 Argentina
        11.4.3 Colombia
        11.4.4 Chile
        11.4.5 Rest of South America
    11.5 Rest of the World
        11.5.1 Middle-East
            11.5.1.1 Saudi Arabia
            11.5.1.2 UAE
            11.5.1.3 Israel
            11.5.1.4 Rest of the Middle-East
        11.5.2 Africa
            11.5.2.1 South Africa
            11.5.2.2 Nigeria
            11.5.2.3 Rest of Africa
12. Hydrogen Sulfide Market – Entropy
    12.1 New Product Launches
    12.2 M&As, Collaborations, JVs and Partnerships
13. Hydrogen Sulfide Market – Industry/Competition Segment Analysis Premium
    13.1 Company Benchmarking Matrix – Major Companies
    13.2 Market Share at Global Level - Major companies
    13.3 Market Share by Key Region - Major companies
    13.4 Market Share by Key Country - Major companies
    13.5 Market Share by Key Application - Major companies
    13.6 Market Share by Key Product Type/Product category - Major companies
14. Hydrogen Sulfide Market – Key Company List by Country Premium Premium
15. Hydrogen Sulfide Market Company Analysis - Business Overview, Product Portfolio, Financials and Developments
    15.1 Company 1
    15.2 Company 2
    15.3 Company 3
    15.4 Company 4
    15.5 Company 5
    15.6 Company 6
    15.7 Company 7
    15.8 Company 8
    15.9 Company 9
    15.10 Company 10 and more
* "Financials would be provided to private companies on best-efforts basis."
Connect with our experts to get customized reports that best suit your requirements. Our reports include global-level data, niche markets and competitive landscape.
List of Tables:
Table 1: Hydrogen Sulphide Market Overview 2021-2026
Table 2: Hydrogen Sulphide Market Leader Analysis 2018-2019 (US$)
Table 3: Hydrogen Sulphide Market Product Analysis 2018-2019 (US$)
Table 4: Hydrogen Sulphide Market End User Analysis 2018-2019 (US$)
Table 5: Hydrogen Sulphide Market Patent Analysis 2013-2018* (US$)
Table 6: Hydrogen Sulphide Market Financial Analysis 2018-2019 (US$)
Table 7: Hydrogen Sulphide Market Driver Analysis 2018-2019 (US$)
Table 8: Hydrogen Sulphide Market Challenges Analysis 2018-2019 (US$)
Table 9: Hydrogen Sulphide Market Constraint Analysis 2018-2019 (US$)
Table 10: Hydrogen Sulphide Market Supplier Bargaining Power Analysis 2018-2019 (US$)
Table 11: Hydrogen Sulphide Market Buyer Bargaining Power Analysis 2018-2019 (US$)
Table 12: Hydrogen Sulphide Market Threat of Substitutes Analysis 2018-2019 (US$)
Table 13: Hydrogen Sulphide Market Threat of New Entrants Analysis 2018-2019 (US$)
Table 14: Hydrogen Sulphide Market Degree of Competition Analysis 2018-2019 (US$)
Table 15: Hydrogen Sulphide Market Value Chain Analysis 2018-2019 (US$)
Table 16: Hydrogen Sulphide Market Pricing Analysis 2021-2026 (US$)
Table 17: Hydrogen Sulphide Market Opportunities Analysis 2021-2026 (US$)
Table 18: Hydrogen Sulphide Market Product Life Cycle Analysis 2021-2026 (US$)
Table 19: Hydrogen Sulphide Market Supplier Analysis 2018-2019 (US$)
Table 20: Hydrogen Sulphide Market Distributor Analysis 2018-2019 (US$)
Table 21: Hydrogen Sulphide Market Trend Analysis 2018-2019 (US$)
Table 22: Hydrogen Sulphide Market Size 2018 (US$)
Table 23: Hydrogen Sulphide Market Forecast Analysis 2021-2026 (US$)
Table 24: Hydrogen Sulphide Market Sales Forecast Analysis 2021-2026 (Units)
Table 25: Hydrogen Sulphide Market, Revenue & Volume,By Production Process, 2021-2026 ($)
Table 26: Hydrogen Sulphide Market By Production Process, Revenue & Volume,By Natural, 2021-2026 ($)
Table 27: Hydrogen Sulphide Market By Production Process, Revenue & Volume,By Industrial, 2021-2026 ($)
Table 28: Hydrogen Sulphide Market, Revenue & Volume,By Grade, 2021-2026 ($)
Table 29: Hydrogen Sulphide Market By Grade, Revenue & Volume,By Technical, 2021-2026 ($)
Table 30: Hydrogen Sulphide Market By Grade, Revenue & Volume,By Purified, 2021-2026 ($)
Table 31: North America Hydrogen Sulphide Market, Revenue & Volume,By Production Process, 2021-2026 ($)
Table 32: North America Hydrogen Sulphide Market, Revenue & Volume,By Grade, 2021-2026 ($)
Table 33: South america Hydrogen Sulphide Market, Revenue & Volume,By Production Process, 2021-2026 ($)
Table 34: South america Hydrogen Sulphide Market, Revenue & Volume,By Grade, 2021-2026 ($)
Table 35: Europe Hydrogen Sulphide Market, Revenue & Volume,By Production Process, 2021-2026 ($)
Table 36: Europe Hydrogen Sulphide Market, Revenue & Volume,By Grade, 2021-2026 ($)
Table 37: APAC  Hydrogen Sulphide Market, Revenue & Volume,By Production Process, 2021-2026 ($)
Table 38: APAC  Hydrogen Sulphide Market, Revenue & Volume,By Grade, 2021-2026 ($)
Table 39: Middle East & Africa Hydrogen Sulphide Market, Revenue & Volume,By Production Process, 2021-2026 ($)
Table 40: Middle East & Africa Hydrogen Sulphide Market, Revenue & Volume,By Grade, 2021-2026 ($)
Table 41: Russia Hydrogen Sulphide Market, Revenue & Volume,By Production Process, 2021-2026 ($)
Table 42: Russia Hydrogen Sulphide Market, Revenue & Volume,By Grade, 2021-2026 ($)
Table 43: Israel Hydrogen Sulphide Market, Revenue & Volume,By Production Process, 2021-2026 ($)
Table 44: Israel Hydrogen Sulphide Market, Revenue & Volume,By Grade, 2021-2026 ($)
Table 45: Top Companies 2018 (US$)Hydrogen Sulphide Market, Revenue & Volume
Table 46: Product Launch 2018-2019Hydrogen Sulphide Market, Revenue & Volume
Table 47: Mergers & Acquistions 2018-2019 Hydrogen Sulphide Market, Revenue & Volume

List of Figures:
Figure 1: Overview of Hydrogen Sulphide Market 2021-2026
Figure 2: Market Share Analysis for Hydrogen Sulphide Market 2018 (US$)
Figure 3: Product Comparison in Hydrogen Sulphide Market 2018-2019 (US$)
Figure 4: End User Profile for Hydrogen Sulphide Market 2018-2019 (US$)
Figure 5: Patent Application and Grant in Hydrogen Sulphide Market 2013-2018* (US$)
Figure 6: Top 5 Companies Financial Analysis in Hydrogen Sulphide Market 2018-2019 (US$)
Figure 7: Market Entry Strategy in Hydrogen Sulphide Market 2018-2019
Figure 8: Ecosystem Analysis in Hydrogen Sulphide Market 2018
Figure 9: Average Selling Price in Hydrogen Sulphide Market 2021-2026
Figure 10: Top Opportunites in Hydrogen Sulphide Market 2018-2019
Figure 11: Market Life Cycle Analysis in Hydrogen Sulphide Market
Figure 12: Global By Production Process Hydrogen Sulphide Market Revenue, 2021-2026 ($)
Figure 13: Global By GradeHydrogen Sulphide Market Revenue, 2021-2026 ($)
Figure 14: Global Hydrogen Sulphide Market - By Geography
Figure 15: Global Hydrogen Sulphide Market Value & Volume, By Geography, 2021-2026 ($) 
Figure 16: Global Hydrogen Sulphide Market CAGR, By Geography, 2021-2026 (%)
Figure 17: North America Hydrogen Sulphide Market Value & Volume, 2021-2026 ($)
Figure 18: US Hydrogen Sulphide Market Value & Volume, 2021-2026 ($)
Figure 19: US GDP and Population, 2018-2019 ($)
Figure 20: US GDP – Composition of 2018, By Sector of Origin
Figure 21: US Export and Import Value & Volume, 2018-2019 ($)
Figure 22: Canada Hydrogen Sulphide Market Value & Volume, 2021-2026 ($)
Figure 23: Canada GDP and Population, 2018-2019 ($)
Figure 24: Canada GDP – Composition of 2018, By Sector of Origin
Figure 25: Canada Export and Import Value & Volume, 2018-2019 ($)
Figure 26: Mexico Hydrogen Sulphide Market Value & Volume, 2021-2026 ($)
Figure 27: Mexico GDP and Population, 2018-2019 ($)
Figure 28: Mexico GDP – Composition of 2018, By Sector of Origin
Figure 29: Mexico Export and Import Value & Volume, 2018-2019 ($)
Figure 30: South America Hydrogen Sulphide Market South America 3D Printing  Market Value & Volume, 2021-2026 ($)
Figure 31: Brazil Hydrogen Sulphide Market Value & Volume, 2021-2026 ($)
Figure 32: Brazil GDP and Population, 2018-2019 ($)
Figure 33: Brazil GDP – Composition of 2018, By Sector of Origin
Figure 34: Brazil Export and Import Value & Volume, 2018-2019 ($)
Figure 35: Venezuela Hydrogen Sulphide Market Value & Volume, 2021-2026 ($)
Figure 36: Venezuela GDP and Population, 2018-2019 ($)
Figure 37: Venezuela GDP – Composition of 2018, By Sector of Origin
Figure 38: Venezuela Export and Import Value & Volume, 2018-2019 ($)
Figure 39: Argentina Hydrogen Sulphide Market Value & Volume, 2021-2026 ($)
Figure 40: Argentina GDP and Population, 2018-2019 ($)
Figure 41: Argentina GDP – Composition of 2018, By Sector of Origin
Figure 42: Argentina Export and Import Value & Volume, 2018-2019 ($)
Figure 43: Ecuador Hydrogen Sulphide Market Value & Volume, 2021-2026 ($)
Figure 44: Ecuador GDP and Population, 2018-2019 ($)
Figure 45: Ecuador GDP – Composition of 2018, By Sector of Origin
Figure 46: Ecuador Export and Import Value & Volume, 2018-2019 ($)
Figure 47: Peru Hydrogen Sulphide Market Value & Volume, 2021-2026 ($)
Figure 48: Peru GDP and Population, 2018-2019 ($)
Figure 49: Peru GDP – Composition of 2018, By Sector of Origin
Figure 50: Peru Export and Import Value & Volume, 2018-2019 ($)
Figure 51: Colombia Hydrogen Sulphide Market Value & Volume, 2021-2026 ($)
Figure 52: Colombia GDP and Population, 2018-2019 ($)
Figure 53: Colombia GDP – Composition of 2018, By Sector of Origin
Figure 54: Colombia Export and Import Value & Volume, 2018-2019 ($)
Figure 55: Costa Rica Hydrogen Sulphide Market Costa Rica 3D Printing  Market Value & Volume, 2021-2026 ($)
Figure 56: Costa Rica GDP and Population, 2018-2019 ($)
Figure 57: Costa Rica GDP – Composition of 2018, By Sector of Origin
Figure 58: Costa Rica Export and Import Value & Volume, 2018-2019 ($)
Figure 59: Europe Hydrogen Sulphide Market Value & Volume, 2021-2026 ($)
Figure 60: U.K Hydrogen Sulphide Market Value & Volume, 2021-2026 ($)
Figure 61: U.K GDP and Population, 2018-2019 ($)
Figure 62: U.K GDP – Composition of 2018, By Sector of Origin
Figure 63: U.K Export and Import Value & Volume, 2018-2019 ($)
Figure 64: Germany Hydrogen Sulphide Market Value & Volume, 2021-2026 ($)
Figure 65: Germany GDP and Population, 2018-2019 ($)
Figure 66: Germany GDP – Composition of 2018, By Sector of Origin
Figure 67: Germany Export and Import Value & Volume, 2018-2019 ($)
Figure 68: Italy Hydrogen Sulphide Market Value & Volume, 2021-2026 ($)
Figure 69: Italy GDP and Population, 2018-2019 ($)
Figure 70: Italy GDP – Composition of 2018, By Sector of Origin
Figure 71: Italy Export and Import Value & Volume, 2018-2019 ($)
Figure 72: France Hydrogen Sulphide Market Value & Volume, 2021-2026 ($)
Figure 73: France GDP and Population, 2018-2019 ($)
Figure 74: France GDP – Composition of 2018, By Sector of Origin
Figure 75: France Export and Import Value & Volume, 2018-2019 ($)
Figure 76: Netherlands Hydrogen Sulphide Market Value & Volume, 2021-2026 ($)
Figure 77: Netherlands GDP and Population, 2018-2019 ($)
Figure 78: Netherlands GDP – Composition of 2018, By Sector of Origin
Figure 79: Netherlands Export and Import Value & Volume, 2018-2019 ($)
Figure 80: Belgium Hydrogen Sulphide Market Value & Volume, 2021-2026 ($)
Figure 81: Belgium GDP and Population, 2018-2019 ($)
Figure 82: Belgium GDP – Composition of 2018, By Sector of Origin
Figure 83: Belgium Export and Import Value & Volume, 2018-2019 ($)
Figure 84: Spain Hydrogen Sulphide Market Value & Volume, 2021-2026 ($)
Figure 85: Spain GDP and Population, 2018-2019 ($)
Figure 86: Spain GDP – Composition of 2018, By Sector of Origin
Figure 87: Spain Export and Import Value & Volume, 2018-2019 ($)
Figure 88: Denmark Hydrogen Sulphide Market Value & Volume, 2021-2026 ($)
Figure 89: Denmark GDP and Population, 2018-2019 ($)
Figure 90: Denmark GDP – Composition of 2018, By Sector of Origin
Figure 91: Denmark Export and Import Value & Volume, 2018-2019 ($)
Figure 92: APAC Hydrogen Sulphide Market Value & Volume, 2021-2026 ($)
Figure 93: China Hydrogen Sulphide Market Value & Volume, 2021-2026
Figure 94: China GDP and Population, 2018-2019 ($)
Figure 95: China GDP – Composition of 2018, By Sector of Origin
Figure 96: China Export and Import Value & Volume, 2018-2019 ($)Hydrogen Sulphide Market China Export and Import Value & Volume, 2018-2019 ($)
Figure 97: Australia Hydrogen Sulphide Market Value & Volume, 2021-2026 ($)
Figure 98: Australia GDP and Population, 2018-2019 ($)
Figure 99: Australia GDP – Composition of 2018, By Sector of Origin
Figure 100: Australia Export and Import Value & Volume, 2018-2019 ($)
Figure 101: South Korea Hydrogen Sulphide Market Value & Volume, 2021-2026 ($)
Figure 102: South Korea GDP and Population, 2018-2019 ($)
Figure 103: South Korea GDP – Composition of 2018, By Sector of Origin
Figure 104: South Korea Export and Import Value & Volume, 2018-2019 ($)
Figure 105: India Hydrogen Sulphide Market Value & Volume, 2021-2026 ($)
Figure 106: India GDP and Population, 2018-2019 ($)
Figure 107: India GDP – Composition of 2018, By Sector of Origin
Figure 108: India Export and Import Value & Volume, 2018-2019 ($)
Figure 109: Taiwan Hydrogen Sulphide Market Taiwan 3D Printing  Market Value & Volume, 2021-2026 ($)
Figure 110: Taiwan GDP and Population, 2018-2019 ($)
Figure 111: Taiwan GDP – Composition of 2018, By Sector of Origin
Figure 112: Taiwan Export and Import Value & Volume, 2018-2019 ($)
Figure 113: Malaysia Hydrogen Sulphide Market Malaysia 3D Printing  Market Value & Volume, 2021-2026 ($)
Figure 114: Malaysia GDP and Population, 2018-2019 ($)
Figure 115: Malaysia GDP – Composition of 2018, By Sector of Origin
Figure 116: Malaysia Export and Import Value & Volume, 2018-2019 ($)
Figure 117: Hong Kong Hydrogen Sulphide Market Hong Kong 3D Printing  Market Value & Volume, 2021-2026 ($)
Figure 118: Hong Kong GDP and Population, 2018-2019 ($)
Figure 119: Hong Kong GDP – Composition of 2018, By Sector of Origin
Figure 120: Hong Kong Export and Import Value & Volume, 2018-2019 ($)
Figure 121: Middle East & Africa Hydrogen Sulphide Market Middle East & Africa 3D Printing  Market Value & Volume, 2021-2026 ($)
Figure 122: Russia Hydrogen Sulphide Market Russia 3D Printing  Market Value & Volume, 2021-2026 ($)
Figure 123: Russia GDP and Population, 2018-2019 ($)
Figure 124: Russia GDP – Composition of 2018, By Sector of Origin
Figure 125: Russia Export and Import Value & Volume, 2018-2019 ($)
Figure 126: Israel Hydrogen Sulphide Market Value & Volume, 2021-2026 ($)
Figure 127: Israel GDP and Population, 2018-2019 ($)
Figure 128: Israel GDP – Composition of 2018, By Sector of Origin
Figure 129: Israel Export and Import Value & Volume, 2018-2019 ($)
Figure 130:  Entropy Share, By Strategies, 2018-2019* (%)Hydrogen Sulphide Market
Figure 131:  Developments, 2018-2019*Hydrogen Sulphide Market
Figure 132: Company 1 Hydrogen Sulphide Market Net Revenue, By Years, 2018-2019* ($)
Figure 133: Company 1 Hydrogen Sulphide Market Net Revenue Share, By Business segments, 2018 (%)
Figure 134: Company 1 Hydrogen Sulphide Market Net Sales Share, By Geography, 2018 (%)
Figure 135: Company 2 Hydrogen Sulphide Market Net Revenue, By Years, 2018-2019* ($)
Figure 136: Company 2 Hydrogen Sulphide Market Net Revenue Share, By Business segments, 2018 (%)
Figure 137: Company 2 Hydrogen Sulphide Market Net Sales Share, By Geography, 2018 (%)
Figure 138: Company 3Hydrogen Sulphide Market Net Revenue, By Years, 2018-2019* ($)
Figure 139: Company 3Hydrogen Sulphide Market Net Revenue Share, By Business segments, 2018 (%)
Figure 140: Company 3Hydrogen Sulphide Market Net Sales Share, By Geography, 2018 (%)
Figure 141: Company 4 Hydrogen Sulphide Market Net Revenue, By Years, 2018-2019* ($)
Figure 142: Company 4 Hydrogen Sulphide Market Net Revenue Share, By Business segments, 2018 (%)
Figure 143: Company 4 Hydrogen Sulphide Market Net Sales Share, By Geography, 2018 (%)
Figure 144: Company 5 Hydrogen Sulphide Market Net Revenue, By Years, 2018-2019* ($)
Figure 145: Company 5 Hydrogen Sulphide Market Net Revenue Share, By Business segments, 2018 (%)
Figure 146: Company 5 Hydrogen Sulphide Market Net Sales Share, By Geography, 2018 (%)
Figure 147: Company 6 Hydrogen Sulphide Market Net Revenue, By Years, 2018-2019* ($)
Figure 148: Company 6 Hydrogen Sulphide Market Net Revenue Share, By Business segments, 2018 (%)
Figure 149: Company 6 Hydrogen Sulphide Market Net Sales Share, By Geography, 2018 (%)
Figure 150: Company 7 Hydrogen Sulphide Market  Net Revenue, By Years, 2018-2019* ($)
Figure 151: Company 7 Hydrogen Sulphide Market  Net Revenue Share, By Business segments, 2018 (%)
Figure 152: Company 7 Hydrogen Sulphide Market  Net Sales Share, By Geography, 2018 (%)
Figure 153: Company 8 Hydrogen Sulphide Market  Net Revenue, By Years, 2018-2019* ($)
Figure 154: Company 8 Hydrogen Sulphide Market  Net Revenue Share, By Business segments, 2018 (%)
Figure 155: Company 8 Hydrogen Sulphide Market  Net Sales Share, By Geography, 2018 (%)
Figure 156: Company 9 Hydrogen Sulphide Market  Net Revenue, By Years, 2018-2019* ($)
Figure 157: Company 9 Hydrogen Sulphide Market  Net Revenue Share, By Business segments, 2018 (%)
Figure 158: Company 9 Hydrogen Sulphide Market  Net Sales Share, By Geography, 2018 (%)
Figure 159: Company 10 Hydrogen Sulphide Market  Net Revenue, By Years, 2018-2019* ($)
Figure 160: Company 10 Hydrogen Sulphide Market  Net Revenue Share, By Business segments, 2018 (%)
Figure 161: Company 10 Hydrogen Sulphide Market  Net Sales Share, By Geography, 2018 (%)
Figure 162: Company 11 Hydrogen Sulphide Market  Net Revenue, By Years, 2018-2019* ($)
Figure 163: Company 11 Hydrogen Sulphide Market  Net Revenue Share, By Business segments, 2018 (%)
Figure 164: Company 11 Hydrogen Sulphide Market  Net Sales Share, By Geography, 2018 (%)
Figure 165: Company 12 Hydrogen Sulphide Market  Net Revenue, By Years, 2018-2019* ($)
Figure 166: Company 12 Hydrogen Sulphide Market  Net Revenue Share, By Business segments, 2018 (%)
Figure 167: Company 12 Hydrogen Sulphide Market  Net Sales Share, By Geography, 2018 (%)
Figure 168: Company 13Hydrogen Sulphide Market  Net Revenue, By Years, 2018-2019* ($)
Figure 169: Company 13Hydrogen Sulphide Market Net Revenue Share, By Business segments, 2018 (%)
Figure 170: Company 13Hydrogen Sulphide Market  Net Sales Share, By Geography, 2018 (%)
Figure 171: Company 14 Hydrogen Sulphide Market  Net Revenue, By Years, 2018-2019* ($)
Figure 172: Company 14 Hydrogen Sulphide Market  Net Revenue Share, By Business segments, 2018 (%)
Figure 173: Company 14 Hydrogen Sulphide Market  Net Sales Share, By Geography, 2018 (%)
Figure 174: Company 15 Hydrogen Sulphide Market  Net Revenue, By Years, 2018-2019* ($)
Figure 175: Company 15 Hydrogen Sulphide Market  Net Revenue Share, By Business segments, 2018 (%)
Figure 176: Company 15 Hydrogen Sulphide Market  Net Sales Share, By Geography, 2018 (%)