 Email
Email Print
Print


LTE Packet Backhaul & Base Station Equipment Market - Forecast(2024 - 2030)
Long-Term Evolution (LTE) is a standard for high-speed wireless communication for mobile phones and data terminals, for increasing the capacity and speed, by using a different radio interface together with core network improvements. Globally, growing demand for public safety LTE infrastructure, rise in the demand for higher data rates, and increasing usage of internet and smarter mobile devices are the prime growth drivers of global LTE packet backhaul & base station equipment market. In addition, increase in traffic average throughput per user as compared to previous year, and emerging economies such as China, India and others will create new opportunities for global LTE packet backhaul & base station equipment market. However, higher cost of the research and development, and lack of availability of compatible devices are the key restraints for global LTE packet backhaul & base station equipment market.
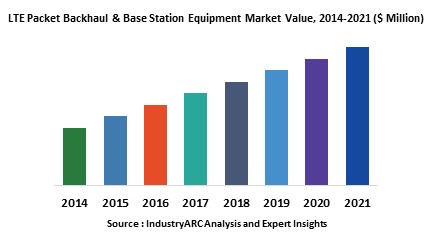
This report identifies the global LTE packet backhaul & base station equipment market size in for the year 2014-2016, and forecast of the same for year 2021. It also highlights the potential growth opportunities in the coming years, while also reviewing the market drivers, restraints, growth indicators, challenges, market dynamics, competitive landscape and other key aspects with respect to global LTE packet backhaul & base station equipment market.
Geographically North America dominated global LTE packet backhaul & base station equipment market, and Asia Pacific is projected to have fastest growth, owing to rapidly increasing data traffic and rising demand for faster networks with increase in smarter devices especially in developing countries such as China, and India in this region. In addition, operators in this region have taken up large scale build and trial of LTE networks, which will also indeed boost the market in this region.
This report segments global LTE packet backhaul & base station equipment market on the basis of network, infrastructure, and regional market as follows:
Sample Companies profiled in this Report are:
This report identifies the global LTE packet backhaul & base station equipment market size in for the year 2014-2016, and forecast of the same for year 2021. It also highlights the potential growth opportunities in the coming years, while also reviewing the market drivers, restraints, growth indicators, challenges, market dynamics, competitive landscape and other key aspects with respect to global LTE packet backhaul & base station equipment market.
Geographically North America dominated global LTE packet backhaul & base station equipment market, and Asia Pacific is projected to have fastest growth, owing to rapidly increasing data traffic and rising demand for faster networks with increase in smarter devices especially in developing countries such as China, and India in this region. In addition, operators in this region have taken up large scale build and trial of LTE networks, which will also indeed boost the market in this region.
This report segments global LTE packet backhaul & base station equipment market on the basis of network, infrastructure, and regional market as follows:
- LTE Packet Backhaul & Base Station Equipment Market, By Network: CDMA (Code Division Multiple Access), CDMA2000, CDMA2000 Evolution Path, GSM (Global System for Mobile Communications), W-CDMA (Wideband Code Division Multiple Access), & LTE (Long-Term Evolution)
- The report has focused study on LTE packet backhaul & base station equipment market by basis of infrastructure such as: E-UTRAN (Evolved UMTS Terrestrial Radio Access Network), E Node B, & EPC (Evolved Packet Core)
- This report has been further segmented into major regions, which includes detailed analysis of each region such as: North America, Europe, Asia-Pacific (APAC) and Rest of the World (RoW) covering all the major country level markets in each of the region
Sample Companies profiled in this Report are:
- Alcatel-Lucent S.A.
- Telefonaktiebolaget L. M. Ericsson
- Huawei Technologies Com. Ltd.
- Samsung Electronics Co., Ltd.
- NEC Corporation
- 10+.
1. LTE Packet Backhaul & Base station Equipment – Market Overview
2. Executive Summary
3. LTE Packet Backhaul & Base station Equipment Market Landscape
3.1. Market Share Analysis
3.2. Comparative Analysis
3.3. Product Benchmarking
3.4. End User Profiling
3.5. Top 5 Financials Analysis
4. LTE Packet Backhaul & Base station Equipment – Market Forces
4.1. Drivers
4.1.1. Growing demand for public safety LTE infrastructure
4.1.2. Rise in the demand for higher data rates
4.1.3. Increasing usage of internet and smarter mobile devices
4.2. Restraints
4.2.1. The research and development having higher cost
4.2.2. Lack of availability of compatible devices
4.3. Opportunities
4.3.1. Emerging economies
4.3.2. Increase in traffic average throughput per user as compared to previous year
4.4. Challenges
4.5. Porter’s Five Forces Analysis
4.5.1. Bargaining Power of Suppliers
4.5.2. Bargaining Power of Buyers
4.5.3. Threat of New Entrants
4.5.4. Threat of Substitutes
4.5.5. Degree of Competition
5. LTE Packet Backhaul & Base Station Equipment Market By Networks
5.1. CDMA (Code Division Multiple Access)
5.2. CDMA2000
5.3. CDMA2000 Evolution Path
5.4. GSM (Global System for Mobile Communications)
5.5. W-CDMA (Wideband Code Division Multiple Access)
5.6. LTE (Long-Term Evolution)
6. LTE Packet Backhaul & Base Station Equipment Market By Infrastructure
6.1. E-UTRAN (Evolved UMTS Terrestrial Radio Access Network)
6.2. E Node B
6.3. EPC (Evolved Packet Core)
7. Global LTE Packet Backhaul & Base Station Equipment Market By Geography
7.1. Europe
7.1.1. Germany
7.1.2. France
7.1.3. Italy
7.1.4. Spain
7.1.5. Russia
7.1.6. U.K.
7.1.7. Rest of Europe
7.2. Asia Pacific
7.2.1. China
7.2.2. India
7.2.3. Japan
7.2.4. South Korea
7.2.5. Rest of Asia-Pacific
7.3. North America
7.3.1. U.S.
7.3.2. Canada
7.3.3. Mexico
7.4. Rest of the World (RoW)
7.4.1. Brazil
7.4.2. Rest of RoW
8. LTE Packet Backhaul & Base Station Equipment – Market Entropy
8.1. Expansion
8.2. Technological Developments
8.3. Merger & Acquisitions and Joint Ventures
8.4. Supply- Contract
9. Company Profiles
9.1. Alcatel-Lucent S.A.
9.1.1. Introduction
9.1.2. Financials
9.1.3. Key Insights
9.1.4. Key Strategy
9.1.5. Product Portfolio
9.1.6. SWOT Analysis
9.2. Telefonaktiebolaget L. M. Ericsson
9.2.1. Introduction
9.2.2. Financials
9.2.3. Key Insights
9.2.4. Key Strategy
9.2.5. Product Portfolio
9.2.6. SWOT Analysis
9.3. Huawei Technologies Com. Ltd.
9.3.1. Introduction
9.3.2. Financials
9.3.3. Key Insights
9.3.4. Key Strategy
9.3.5. Product Portfolio
9.3.6. SWOT Analysis
9.4. Samsung Electronics Co., Ltd.
9.4.1. Introduction
9.4.2. Financials
9.4.3. Key Insights
9.4.4. Key Strategy
9.4.5. Product Portfolio
9.4.6. SWOT Analysis
9.5. NEC Corporation
9.5.1. Introduction
9.5.2. Financials
9.5.3. Key Insights
9.5.4. Key Strategy
9.5.5. Product Portfolio
9.5.6. SWOT Analysis
9.6. ZTE Corporation
9.6.1. Introduction
9.6.2. Financials
9.6.3. Key Insights
9.6.4. Key Strategy
9.6.5. Product Portfolio
9.6.6. SWOT Analysis
9.7. Cisco Systems, Inc.
9.7.1. Introduction
9.7.2. Financials
9.7.3. Key Insights
9.7.4. Key Strategy
9.7.5. Product Portfolio
9.7.6. SWOT Analysis
9.8. Fujitsu Ltd.
9.8.1. Introduction
9.8.2. Financials
9.8.3. Key Insights
9.8.4. Key Strategy
9.8.5. Product Portfolio
9.8.6. SWOT Analysis
9.9. Motorola Inc.
9.9.1. Introduction
9.9.2. Financials
9.9.3. Key Insights
9.9.4. Key Strategy
9.9.5. Product Portfolio
9.9.6. SWOT Analysis
9.10. LG Corporation
9.10.1. Introduction
9.10.2. Financials
9.10.3. Key Insights
9.10.4. Key Strategy
9.10.5. Product Portfolio
9.10.6. SWOT Analysis
*More than 10 Companies are profiled in this Research Report*
"*Financials would be provided on a best efforts basis for private companies"
10. Appendix
10.1. Abbreviations
10.2. Sources
10.3. Research Methodology
10.4. Expert Insights
List of Table s:
Table 1: LTE Packet Backhaul & Base Station Equipment Market Overview 2021-2026
Table 2: LTE Packet Backhaul & Base Station Equipment Market Leader Analysis 2018-2019 (US$)
Table 3: LTE Packet Backhaul & Base Station Equipment Market Product Analysis 2018-2019 (US$)
Table 4: LTE Packet Backhaul & Base Station Equipment Market End User Analysis 2018-2019 (US$)
Table 5: LTE Packet Backhaul & Base Station Equipment Market Patent Analysis 2013-2018* (US$)
Table 6: LTE Packet Backhaul & Base Station Equipment Market Financial Analysis 2018-2019 (US$)
Table 7: LTE Packet Backhaul & Base Station Equipment Market Driver Analysis 2018-2019 (US$)
Table 8: LTE Packet Backhaul & Base Station Equipment Market Challenges Analysis 2018-2019 (US$)
Table 9: LTE Packet Backhaul & Base Station Equipment Market Constraint Analysis 2018-2019 (US$)
Table 10: LTE Packet Backhaul & Base Station Equipment Market Supplier Bargaining Power Analysis 2018-2019 (US$)
Table 11: LTE Packet Backhaul & Base Station Equipment Market Buyer Bargaining Power Analysis 2018-2019 (US$)
Table 12: LTE Packet Backhaul & Base Station Equipment Market Threat of Substitutes Analysis 2018-2019 (US$)
Table 13: LTE Packet Backhaul & Base Station Equipment Market Threat of New Entrants Analysis 2018-2019 (US$)
Table 14: LTE Packet Backhaul & Base Station Equipment Market Degree of Competition Analysis 2018-2019 (US$)
Table 15: LTE Packet Backhaul & Base Station Equipment Market Value Chain Analysis 2018-2019 (US$)
Table 16: LTE Packet Backhaul & Base Station Equipment Market Pricing Analysis 2021-2026 (US$)
Table 17: LTE Packet Backhaul & Base Station Equipment Market Opportunities Analysis 2021-2026 (US$)
Table 18: LTE Packet Backhaul & Base Station Equipment Market Product Life Cycle Analysis 2021-2026 (US$)
Table 19: LTE Packet Backhaul & Base Station Equipment Market Supplier Analysis 2018-2019 (US$)
Table 20: LTE Packet Backhaul & Base Station Equipment Market Distributor Analysis 2018-2019 (US$)
Table 21: LTE Packet Backhaul & Base Station Equipment Market Trend Analysis 2018-2019 (US$)
Table 22: LTE Packet Backhaul & Base Station Equipment Market Size 2018 (US$)
Table 23: LTE Packet Backhaul & Base Station Equipment Market Forecast Analysis 2021-2026 (US$)
Table 24: LTE Packet Backhaul & Base Station Equipment Market Sales Forecast Analysis 2021-2026 (Units)
Table 25: LTE Packet Backhaul & Base Station Equipment Market, Revenue & Volume, By Networks, 2021-2026 ($)
Table 26: LTE Packet Backhaul & Base Station Equipment Market By Networks, Revenue & Volume, By CDMA (Code Division Multiple Access), 2021-2026 ($)
Table 27: LTE Packet Backhaul & Base Station Equipment Market By Networks, Revenue & Volume, By CDMA2000, 2021-2026 ($)
Table 28: LTE Packet Backhaul & Base Station Equipment Market By Networks, Revenue & Volume, By CDMA2000 Evolution Path, 2021-2026 ($)
Table 29: LTE Packet Backhaul & Base Station Equipment Market By Networks, Revenue & Volume, By GSM (Global System for Mobile Communications), 2021-2026 ($)
Table 30: LTE Packet Backhaul & Base Station Equipment Market By Networks, Revenue & Volume, By W-CDMA (Wideband Code Division Multiple Access), 2021-2026 ($)
Table 31: LTE Packet Backhaul & Base Station Equipment Market, Revenue & Volume, By Infrastructure, 2021-2026 ($)
Table 32: LTE Packet Backhaul & Base Station Equipment Market By Infrastructure, Revenue & Volume, By E-UTRAN (Evolved UMTS Terrestrial Radio Access Network), 2021-2026 ($)
Table 33: LTE Packet Backhaul & Base Station Equipment Market By Infrastructure, Revenue & Volume, By E Node B, 2021-2026 ($)
Table 34: LTE Packet Backhaul & Base Station Equipment Market By Infrastructure, Revenue & Volume, By EPC (Evolved Packet Core), 2021-2026 ($)
Table 35: North America LTE Packet Backhaul & Base Station Equipment Market, Revenue & Volume, By Networks, 2021-2026 ($)
Table 36: North America LTE Packet Backhaul & Base Station Equipment Market, Revenue & Volume, By Infrastructure, 2021-2026 ($)
Table 37: South america LTE Packet Backhaul & Base Station Equipment Market, Revenue & Volume, By Networks, 2021-2026 ($)
Table 38: South america LTE Packet Backhaul & Base Station Equipment Market, Revenue & Volume, By Infrastructure, 2021-2026 ($)
Table 39: Europe LTE Packet Backhaul & Base Station Equipment Market, Revenue & Volume, By Networks, 2021-2026 ($)
Table 40: Europe LTE Packet Backhaul & Base Station Equipment Market, Revenue & Volume, By Infrastructure, 2021-2026 ($)
Table 41: APAC LTE Packet Backhaul & Base Station Equipment Market, Revenue & Volume, By Networks, 2021-2026 ($)
Table 42: APAC LTE Packet Backhaul & Base Station Equipment Market, Revenue & Volume, By Infrastructure, 2021-2026 ($)
Table 43: Middle East & Africa LTE Packet Backhaul & Base Station Equipment Market, Revenue & Volume, By Networks, 2021-2026 ($)
Table 44: Middle East & Africa LTE Packet Backhaul & Base Station Equipment Market, Revenue & Volume, By Infrastructure, 2021-2026 ($)
Table 45: Russia LTE Packet Backhaul & Base Station Equipment Market, Revenue & Volume, By Networks, 2021-2026 ($)
Table 46: Russia LTE Packet Backhaul & Base Station Equipment Market, Revenue & Volume, By Infrastructure, 2021-2026 ($)
Table 47: Israel LTE Packet Backhaul & Base Station Equipment Market, Revenue & Volume, By Networks, 2021-2026 ($)
Table 48: Israel LTE Packet Backhaul & Base Station Equipment Market, Revenue & Volume, By Infrastructure, 2021-2026 ($)
Table 49: Top Companies 2018 (US$) LTE Packet Backhaul & Base Station Equipment Market, Revenue & Volume
Table 50: Product Launch 2018-2019 LTE Packet Backhaul & Base Station Equipment Market, Revenue & Volume
Table 51: Mergers & Acquistions 2018-2019 LTE Packet Backhaul & Base Station Equipment Market, Revenue & Volume
List of Figures:
Figure 1: Overview of LTE Packet Backhaul & Base Station Equipment Market 2021-2026
Figure 2: Market Share Analysis for LTE Packet Backhaul & Base Station Equipment Market 2018 (US$)
Figure 3: Product Comparison in LTE Packet Backhaul & Base Station Equipment Market 2018-2019 (US$)
Figure 4: End User Profile for LTE Packet Backhaul & Base Station Equipment Market 2018-2019 (US$)
Figure 5: Patent Application and Grant in LTE Packet Backhaul & Base Station Equipment Market 2013-2018* (US$)
Figure 6: Top 5 Companies Financial Analysis in LTE Packet Backhaul & Base Station Equipment Market 2018-2019 (US$)
Figure 7: Market Entry Strategy in LTE Packet Backhaul & Base Station Equipment Market 2018-2019
Figure 8: Ecosystem Analysis in LTE Packet Backhaul & Base Station Equipment Market 2018
Figure 9: Average Selling Price in LTE Packet Backhaul & Base Station Equipment Market 2021-2026
Figure 10: Top Opportunites in LTE Packet Backhaul & Base Station Equipment Market 2018-2019
Figure 11: Market Life Cycle Analysis in LTE Packet Backhaul & Base Station Equipment Market
Figure 12: GlobalBy Networks LTE Packet Backhaul & Base Station Equipment Market Revenue, 2021-2026 ($)
Figure 13: GlobalBy Infrastructure LTE Packet Backhaul & Base Station Equipment Market Revenue, 2021-2026 ($)
Figure 14: Global LTE Packet Backhaul & Base Station Equipment Market - By Geography
Figure 15: Global LTE Packet Backhaul & Base Station Equipment Market Value & Volume, By Geography, 2021-2026 ($)
Figure 16: Global LTE Packet Backhaul & Base Station Equipment Market CAGR, By Geography, 2021-2026 (%)
Figure 17: North America LTE Packet Backhaul & Base Station Equipment Market Value & Volume, 2021-2026 ($)
Figure 18: US LTE Packet Backhaul & Base Station Equipment Market Value & Volume, 2021-2026 ($)
Figure 19: US GDP and Population, 2018-2019 ($)
Figure 20: US GDP – Composition of 2018, By Sector of Origin
Figure 21: US Export and Import Value & Volume, 2018-2019 ($)
Figure 22: Canada LTE Packet Backhaul & Base Station Equipment Market Value & Volume, 2021-2026 ($)
Figure 23: Canada GDP and Population, 2018-2019 ($)
Figure 24: Canada GDP – Composition of 2018, By Sector of Origin
Figure 25: Canada Export and Import Value & Volume, 2018-2019 ($)
Figure 26: Mexico LTE Packet Backhaul & Base Station Equipment Market Value & Volume, 2021-2026 ($)
Figure 27: Mexico GDP and Population, 2018-2019 ($)
Figure 28: Mexico GDP – Composition of 2018, By Sector of Origin
Figure 29: Mexico Export and Import Value & Volume, 2018-2019 ($)
Figure 30: South America LTE Packet Backhaul & Base Station Equipment Market Value & Volume, 2021-2026 ($)
Figure 31: Brazil LTE Packet Backhaul & Base Station Equipment Market Value & Volume, 2021-2026 ($)
Figure 32: Brazil GDP and Population, 2018-2019 ($)
Figure 33: Brazil GDP – Composition of 2018, By Sector of Origin
Figure 34: Brazil Export and Import Value & Volume, 2018-2019 ($)
Figure 35: Venezuela LTE Packet Backhaul & Base Station Equipment Market Value & Volume, 2021-2026 ($)
Figure 36: Venezuela GDP and Population, 2018-2019 ($)
Figure 37: Venezuela GDP – Composition of 2018, By Sector of Origin
Figure 38: Venezuela Export and Import Value & Volume, 2018-2019 ($)
Figure 39: Argentina LTE Packet Backhaul & Base Station Equipment Market Value & Volume, 2021-2026 ($)
Figure 40: Argentina GDP and Population, 2018-2019 ($)
Figure 41: Argentina GDP – Composition of 2018, By Sector of Origin
Figure 42: Argentina Export and Import Value & Volume, 2018-2019 ($)
Figure 43: Ecuador LTE Packet Backhaul & Base Station Equipment Market Value & Volume, 2021-2026 ($)
Figure 44: Ecuador GDP and Population, 2018-2019 ($)
Figure 45: Ecuador GDP – Composition of 2018, By Sector of Origin
Figure 46: Ecuador Export and Import Value & Volume, 2018-2019 ($)
Figure 47: Peru LTE Packet Backhaul & Base Station Equipment Market Value & Volume, 2021-2026 ($)
Figure 48: Peru GDP and Population, 2018-2019 ($)
Figure 49: Peru GDP – Composition of 2018, By Sector of Origin
Figure 50: Peru Export and Import Value & Volume, 2018-2019 ($)
Figure 51: Colombia LTE Packet Backhaul & Base Station Equipment Market Value & Volume, 2021-2026 ($)
Figure 52: Colombia GDP and Population, 2018-2019 ($)
Figure 53: Colombia GDP – Composition of 2018, By Sector of Origin
Figure 54: Colombia Export and Import Value & Volume, 2018-2019 ($)
Figure 55: Costa Rica LTE Packet Backhaul & Base Station Equipment Market Value & Volume, 2021-2026 ($)
Figure 56: Costa Rica GDP and Population, 2018-2019 ($)
Figure 57: Costa Rica GDP – Composition of 2018, By Sector of Origin
Figure 58: Costa Rica Export and Import Value & Volume, 2018-2019 ($)
Figure 59: Europe LTE Packet Backhaul & Base Station Equipment Market Value & Volume, 2021-2026 ($)
Figure 60: U.K LTE Packet Backhaul & Base Station Equipment Market Value & Volume, 2021-2026 ($)
Figure 61: U.K GDP and Population, 2018-2019 ($)
Figure 62: U.K GDP – Composition of 2018, By Sector of Origin
Figure 63: U.K Export and Import Value & Volume, 2018-2019 ($)
Figure 64: Germany LTE Packet Backhaul & Base Station Equipment Market Value & Volume, 2021-2026 ($)
Figure 65: Germany GDP and Population, 2018-2019 ($)
Figure 66: Germany GDP – Composition of 2018, By Sector of Origin
Figure 67: Germany Export and Import Value & Volume, 2018-2019 ($)
Figure 68: Italy LTE Packet Backhaul & Base Station Equipment Market Value & Volume, 2021-2026 ($)
Figure 69: Italy GDP and Population, 2018-2019 ($)
Figure 70: Italy GDP – Composition of 2018, By Sector of Origin
Figure 71: Italy Export and Import Value & Volume, 2018-2019 ($)
Figure 72: France LTE Packet Backhaul & Base Station Equipment Market Value & Volume, 2021-2026 ($)
Figure 73: France GDP and Population, 2018-2019 ($)
Figure 74: France GDP – Composition of 2018, By Sector of Origin
Figure 75: France Export and Import Value & Volume, 2018-2019 ($)
Figure 76: Netherlands LTE Packet Backhaul & Base Station Equipment Market Value & Volume, 2021-2026 ($)
Figure 77: Netherlands GDP and Population, 2018-2019 ($)
Figure 78: Netherlands GDP – Composition of 2018, By Sector of Origin
Figure 79: Netherlands Export and Import Value & Volume, 2018-2019 ($)
Figure 80: Belgium LTE Packet Backhaul & Base Station Equipment Market Value & Volume, 2021-2026 ($)
Figure 81: Belgium GDP and Population, 2018-2019 ($)
Figure 82: Belgium GDP – Composition of 2018, By Sector of Origin
Figure 83: Belgium Export and Import Value & Volume, 2018-2019 ($)
Figure 84: Spain LTE Packet Backhaul & Base Station Equipment Market Value & Volume, 2021-2026 ($)
Figure 85: Spain GDP and Population, 2018-2019 ($)
Figure 86: Spain GDP – Composition of 2018, By Sector of Origin
Figure 87: Spain Export and Import Value & Volume, 2018-2019 ($)
Figure 88: Denmark LTE Packet Backhaul & Base Station Equipment Market Value & Volume, 2021-2026 ($)
Figure 89: Denmark GDP and Population, 2018-2019 ($)
Figure 90: Denmark GDP – Composition of 2018, By Sector of Origin
Figure 91: Denmark Export and Import Value & Volume, 2018-2019 ($)
Figure 92: APAC LTE Packet Backhaul & Base Station Equipment Market Value & Volume, 2021-2026 ($)
Figure 93: China LTE Packet Backhaul & Base Station Equipment Market Value & Volume, 2021-2026
Figure 94: China GDP and Population, 2018-2019 ($)
Figure 95: China GDP – Composition of 2018, By Sector of Origin
Figure 96: China Export and Import Value & Volume, 2018-2019 ($) LTE Packet Backhaul & Base Station Equipment Market China Export and Import Value & Volume, 2018-2019 ($)
Figure 97: Australia LTE Packet Backhaul & Base Station Equipment Market Value & Volume, 2021-2026 ($)
Figure 98: Australia GDP and Population, 2018-2019 ($)
Figure 99: Australia GDP – Composition of 2018, By Sector of Origin
Figure 100: Australia Export and Import Value & Volume, 2018-2019 ($)
Figure 101: South Korea LTE Packet Backhaul & Base Station Equipment Market Value & Volume, 2021-2026 ($)
Figure 102: South Korea GDP and Population, 2018-2019 ($)
Figure 103: South Korea GDP – Composition of 2018, By Sector of Origin
Figure 104: South Korea Export and Import Value & Volume, 2018-2019 ($)
Figure 105: India LTE Packet Backhaul & Base Station Equipment Market Value & Volume, 2021-2026 ($)
Figure 106: India GDP and Population, 2018-2019 ($)
Figure 107: India GDP – Composition of 2018, By Sector of Origin
Figure 108: India Export and Import Value & Volume, 2018-2019 ($)
Figure 109: Taiwan LTE Packet Backhaul & Base Station Equipment Market Value & Volume, 2021-2026 ($)
Figure 110: Taiwan GDP and Population, 2018-2019 ($)
Figure 111: Taiwan GDP – Composition of 2018, By Sector of Origin
Figure 112: Taiwan Export and Import Value & Volume, 2018-2019 ($)
Figure 113: Malaysia LTE Packet Backhaul & Base Station Equipment Market Value & Volume, 2021-2026 ($)
Figure 114: Malaysia GDP and Population, 2018-2019 ($)
Figure 115: Malaysia GDP – Composition of 2018, By Sector of Origin
Figure 116: Malaysia Export and Import Value & Volume, 2018-2019 ($)
Figure 117: Hong Kong LTE Packet Backhaul & Base Station Equipment Market Value & Volume, 2021-2026 ($)
Figure 118: Hong Kong GDP and Population, 2018-2019 ($)
Figure 119: Hong Kong GDP – Composition of 2018, By Sector of Origin
Figure 120: Hong Kong Export and Import Value & Volume, 2018-2019 ($)
Figure 121: Middle East & Africa LTE Packet Backhaul & Base Station Equipment Market Middle East & Africa 3D Printing Market Value & Volume, 2021-2026 ($)
Figure 122: Russia LTE Packet Backhaul & Base Station Equipment Market Value & Volume, 2021-2026 ($)
Figure 123: Russia GDP and Population, 2018-2019 ($)
Figure 124: Russia GDP – Composition of 2018, By Sector of Origin
Figure 125: Russia Export and Import Value & Volume, 2018-2019 ($)
Figure 126: Israel LTE Packet Backhaul & Base Station Equipment Market Value & Volume, 2021-2026 ($)
Figure 127: Israel GDP and Population, 2018-2019 ($)
Figure 128: Israel GDP – Composition of 2018, By Sector of Origin
Figure 129: Israel Export and Import Value & Volume, 2018-2019 ($)
Figure 130: Entropy Share, By Strategies, 2018-2019* (%) LTE Packet Backhaul & Base Station Equipment Market
Figure 131: Developments, 2018-2019* LTE Packet Backhaul & Base Station Equipment Market
Figure 132: Company 1 LTE Packet Backhaul & Base Station Equipment Market Net Revenue, By Years, 2018-2019* ($)
Figure 133: Company 1 LTE Packet Backhaul & Base Station Equipment Market Net Revenue Share, By Business segments, 2018 (%)
Figure 134: Company 1 LTE Packet Backhaul & Base Station Equipment Market Net Sales Share, By Geography, 2018 (%)
Figure 135: Company 2 LTE Packet Backhaul & Base Station Equipment Market Net Revenue, By Years, 2018-2019* ($)
Figure 136: Company 2 LTE Packet Backhaul & Base Station Equipment Market Net Revenue Share, By Business segments, 2018 (%)
Figure 137: Company 2 LTE Packet Backhaul & Base Station Equipment Market Net Sales Share, By Geography, 2018 (%)
Figure 138: Company 3 LTE Packet Backhaul & Base Station Equipment Market Net Revenue, By Years, 2018-2019* ($)
Figure 139: Company 3 LTE Packet Backhaul & Base Station Equipment Market Net Revenue Share, By Business segments, 2018 (%)
Figure 140: Company 3 LTE Packet Backhaul & Base Station Equipment Market Net Sales Share, By Geography, 2018 (%)
Figure 141: Company 4 LTE Packet Backhaul & Base Station Equipment Market Net Revenue, By Years, 2018-2019* ($)
Figure 142: Company 4 LTE Packet Backhaul & Base Station Equipment Market Net Revenue Share, By Business segments, 2018 (%)
Figure 143: Company 4 LTE Packet Backhaul & Base Station Equipment Market Net Sales Share, By Geography, 2018 (%)
Figure 144: Company 5 LTE Packet Backhaul & Base Station Equipment Market Net Revenue, By Years, 2018-2019* ($)
Figure 145: Company 5 LTE Packet Backhaul & Base Station Equipment Market Net Revenue Share, By Business segments, 2018 (%)
Figure 146: Company 5 LTE Packet Backhaul & Base Station Equipment Market Net Sales Share, By Geography, 2018 (%)
Figure 147: Company 6 LTE Packet Backhaul & Base Station Equipment Market Net Revenue, By Years, 2018-2019* ($)
Figure 148: Company 6 LTE Packet Backhaul & Base Station Equipment Market Net Revenue Share, By Business segments, 2018 (%)
Figure 149: Company 6 LTE Packet Backhaul & Base Station Equipment Market Net Sales Share, By Geography, 2018 (%)
Figure 150: Company 7 LTE Packet Backhaul & Base Station Equipment Market Net Revenue, By Years, 2018-2019* ($)
Figure 151: Company 7 LTE Packet Backhaul & Base Station Equipment Market Net Revenue Share, By Business segments, 2018 (%)
Figure 152: Company 7 LTE Packet Backhaul & Base Station Equipment Market Net Sales Share, By Geography, 2018 (%)
Figure 153: Company 8 LTE Packet Backhaul & Base Station Equipment Market Net Revenue, By Years, 2018-2019* ($)
Figure 154: Company 8 LTE Packet Backhaul & Base Station Equipment Market Net Revenue Share, By Business segments, 2018 (%)
Figure 155: Company 8 LTE Packet Backhaul & Base Station Equipment Market Net Sales Share, By Geography, 2018 (%)
Figure 156: Company 9 LTE Packet Backhaul & Base Station Equipment Market Net Revenue, By Years, 2018-2019* ($)
Figure 157: Company 9 LTE Packet Backhaul & Base Station Equipment Market Net Revenue Share, By Business segments, 2018 (%)
Figure 158: Company 9 LTE Packet Backhaul & Base Station Equipment Market Net Sales Share, By Geography, 2018 (%)
Figure 159: Company 10 LTE Packet Backhaul & Base Station Equipment Market Net Revenue, By Years, 2018-2019* ($)
Figure 160: Company 10 LTE Packet Backhaul & Base Station Equipment Market Net Revenue Share, By Business segments, 2018 (%)
Figure 161: Company 10 LTE Packet Backhaul & Base Station Equipment Market Net Sales Share, By Geography, 2018 (%)
Figure 162: Company 11 LTE Packet Backhaul & Base Station Equipment Market Net Revenue, By Years, 2018-2019* ($)
Figure 163: Company 11 LTE Packet Backhaul & Base Station Equipment Market Net Revenue Share, By Business segments, 2018 (%)
Figure 164: Company 11 LTE Packet Backhaul & Base Station Equipment Market Net Sales Share, By Geography, 2018 (%)
Figure 165: Company 12 LTE Packet Backhaul & Base Station Equipment Market Net Revenue, By Years, 2018-2019* ($)
Figure 166: Company 12 LTE Packet Backhaul & Base Station Equipment Market Net Revenue Share, By Business segments, 2018 (%)
Figure 167: Company 12 LTE Packet Backhaul & Base Station Equipment Market Net Sales Share, By Geography, 2018 (%)
Figure 168: Company 13 LTE Packet Backhaul & Base Station Equipment Market Net Revenue, By Years, 2018-2019* ($)
Figure 169: Company 13 LTE Packet Backhaul & Base Station Equipment Market Net Revenue Share, By Business segments, 2018 (%)
Figure 170: Company 13 LTE Packet Backhaul & Base Station Equipment Market Net Sales Share, By Geography, 2018 (%)
Figure 171: Company 14 LTE Packet Backhaul & Base Station Equipment Market Net Revenue, By Years, 2018-2019* ($)
Figure 172: Company 14 LTE Packet Backhaul & Base Station Equipment Market Net Revenue Share, By Business segments, 2018 (%)
Figure 173: Company 14 LTE Packet Backhaul & Base Station Equipment Market Net Sales Share, By Geography, 2018 (%)
Figure 174: Company 15 LTE Packet Backhaul & Base Station Equipment Market Net Revenue, By Years, 2018-2019* ($)
Figure 175: Company 15 LTE Packet Backhaul & Base Station Equipment Market Net Revenue Share, By Business segments, 2018 (%)
Figure 176: Company 15 LTE Packet Backhaul & Base Station Equipment Market Net Sales Share, By Geography, 2018 (%)