 Email
Email Print
Print


Liquid biopsy is an advanced cancer diagnostic test carried out using biofluids such as blood, CSF, plasma and urine for cancer detection. Liquid biopsy test can be used to detect cancer in early stages. Liquid biopsy is a non-invasive diagnostic test which uses circulating nucleic acids, circulating tumour cells (CTC) and exosomes as a biomarker for diagnosis of cancer. Aforementioned biomarkers are released into different body fluids by cancer cells into cancerous human body. Liquid biopsy test requires blood, urine and cerebral spinal fluid (CSF) samples for diagnosis of various cancers. Among all samples, blood sample is widely used for diagnosis of various cancers such as lung cancer, breast cancer and leukemia. Urine and CSF samples are used for diagnosis of prostate cancer and brain cancer respectively. Globally increasing cancer awareness and incidences is expected to drive the demand for liquid biopsy during the period of study.
Geographically North America dominated global liquid biopsy market, with approximately half of the world’s procedures being done in the U.S. because of high medical reimbursement facilities, and technological advancement. Asia Pacific is projected to have fastest growth, owing to rapidly increasing population, rise in consumer awareness, favourable government policies, modernization of healthcare infrastructure, and growing medical tourism industry in developing nations such as China, and India in this region. Among all the procedures, oncology procedures has the highest market share in global liquid biopsy market due to higher prevalence of cancer patients.
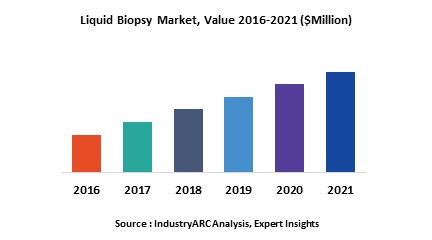
This report identifies the global liquid biopsy market size in for the year 2014-2016, and forecast of the same for year 2021. It also highlights the market drivers, restraints, growth indicators, challenges, and other key aspects with respect to global liquid biopsy market.
This report segments global liquid biopsy market on the basis of cancer type, Circulating Biomakers , end-user, and regional market as follows:
This report identifies all the major companies operating in the liquid biopsy market. Some of the major companies’ profiles in detail are as follows:
Geographically North America dominated global liquid biopsy market, with approximately half of the world’s procedures being done in the U.S. because of high medical reimbursement facilities, and technological advancement. Asia Pacific is projected to have fastest growth, owing to rapidly increasing population, rise in consumer awareness, favourable government policies, modernization of healthcare infrastructure, and growing medical tourism industry in developing nations such as China, and India in this region. Among all the procedures, oncology procedures has the highest market share in global liquid biopsy market due to higher prevalence of cancer patients.
This report identifies the global liquid biopsy market size in for the year 2014-2016, and forecast of the same for year 2021. It also highlights the market drivers, restraints, growth indicators, challenges, and other key aspects with respect to global liquid biopsy market.
This report segments global liquid biopsy market on the basis of cancer type, Circulating Biomakers , end-user, and regional market as follows:
- Liquid Biopsy Market, By cancer type: Lung, Breast, Colorectal, Prostate, Liver
- The report has focused study on liquid biopsy market on basis of Circulating biomarker such as: Tumor Cells, Circulating Tumor DNA and other,
- The report has focused study on liquid biopsy market on basis of End User such as: Reference Laboratory, Research Centers
- This report has been further segmented into major regions, which includes detailed analysis of each region such as: North America, Europe, Asia-Pacific (APAC), and Rest of the World (RoW) covering all the major country level markets in each of the region
This report identifies all the major companies operating in the liquid biopsy market. Some of the major companies’ profiles in detail are as follows:
- F. Hoffmann-La Roche AG
- Bio-Rad Laboratories Inc.
- Myriad Genetics
- Janssen Diagnostics, LLC.
- Tr0vagene Inc.
1. Liquid Biopsy Market – Market Overview
2. Executive Summary
3. Market Landscape
3.1. Market Share Analysis
3.2. Comparative Analysis
3.3. Product Benchmarking
3.4. End User Profiling
3.5. Top 5 Financials Analysis
4. Liquid Biopsy Market– Market Forces
4.1. Drivers
4.1.1. Increasing cases of new cancer patients
4.1.2. Benefits of Liquid Biopsy Over Surgical Biopsy
4.2. Restraints
4.2.1. Low Sensitivity and Specificity
4.3. Opportunities
4.4. Challenges
4.5. Porter’s Five Forces Analysis
4.5.1. Bargaining Power of Suppliers
4.5.2. Bargaining Power of Buyers
4.5.3. Threat of New Entrants
4.5.4. Threat of Substitutes
4.5.5. Degree of Competition
5. Liquid Biopsy Market– Strategic Analysis
5.1. Value Chain Analysis
5.2. Pricing Analysis
5.3. Opportunities Analysis
5.4. Product/Market Life Cycle Analysis
5.5. Suppliers and Distributors
6. Liquid Biopsy Market, By Cancer Type
6.1. Lung Cancer
6.2. Breast Cancer
6.3. Colorectal Cancer
6.4. Prostate Cancer
6.5. Liver Cancer
6.6. Other Cancers
7. Liquid Biopsy Market, By Circulating Biomarker
7.1. Circulating Tumor Cells
7.2. Extracellular Vesicles
7.3. Circulating Tumor DNA (CTDNA)
7.4. Other Biomarkers
8. Liquid Biopsy Market, By End-User
8.1. Reference Laboratory,
8.2. Research Centers
9. Liquid Biopsy Market, By Geography
9.1. Europe
9.1.1. Germany
9.1.2. France
9.1.3. Italy
9.1.4. Spain
9.1.5. Russia
9.1.6. U.K.
9.1.7. Rest of Europe
9.2. Asia Pacific
9.2.1. China
9.2.2. India
9.2.3. Japan
9.2.4. South Korea
9.2.5. Rest of Asia-Pacific
9.3. North America
9.3.1. U.S.
9.3.2. Canada
9.3.3. Mexico
9.4. Rest of the World (RoW)
9.4.1. Brazil
9.4.2. Rest of RoW
10. Liquid Biopsy – Market Entropy
10.1. Expansion
10.2. Technological Developments
10.3. Merger & Acquisitions, and Joint Ventures
10.4. Supply- Contract
11. Company Profiles (Overview, Financials, SWOT Analysis, Developments, Product Portfolio)
11.1. Biocept, Inc.
11.2. Qiagen
11.3. F. Hoffmann-La Roche AG
11.4. Bio-Rad Laboratories Inc.
11.5. Myriad Genetics
11.6. Janssen Diagnostics, LLC.
11.7. Tr0vagene Inc.
11.8. Guardant Health Inc.
11.9. Fraunhofer-Gesellschaft
11.10. MDX Health SA
*More than 40 Companies are profiled in this Research Report, Complete List available on Request*
"*Financials would be provided on a best efforts basis for private companies"
12. Appendix
12.1. Abbreviations
12.2. Sources
12.3. Research Methodology
12.4. Bibliography
12.5. Compilation of Expert Insights
12.6. Disclaimer
List of Tables:
Table 1: Liquid Biopsy Market Overview 2021-2026
Table 2: Liquid Biopsy Market Leader Analysis 2018-2019 (US$)
Table 3: Liquid Biopsy Market Product Analysis 2018-2019 (US$)
Table 4: Liquid Biopsy Market End User Analysis 2018-2019 (US$)
Table 5: Liquid Biopsy Market Patent Analysis 2013-2018* (US$)
Table 6: Liquid Biopsy Market Financial Analysis 2018-2019 (US$)
Table 7: Liquid Biopsy Market Driver Analysis 2018-2019 (US$)
Table 8: Liquid Biopsy Market Challenges Analysis 2018-2019 (US$)
Table 9: Liquid Biopsy Market Constraint Analysis 2018-2019 (US$)
Table 10: Liquid Biopsy Market Supplier Bargaining Power Analysis 2018-2019 (US$)
Table 11: Liquid Biopsy Market Buyer Bargaining Power Analysis 2018-2019 (US$)
Table 12: Liquid Biopsy Market Threat of Substitutes Analysis 2018-2019 (US$)
Table 13: Liquid Biopsy Market Threat of New Entrants Analysis 2018-2019 (US$)
Table 14: Liquid Biopsy Market Degree of Competition Analysis 2018-2019 (US$)
Table 15: Liquid Biopsy Market Value Chain Analysis 2018-2019 (US$)
Table 16: Liquid Biopsy Market Pricing Analysis 2021-2026 (US$)
Table 17: Liquid Biopsy Market Opportunities Analysis 2021-2026 (US$)
Table 18: Liquid Biopsy Market Product Life Cycle Analysis 2021-2026 (US$)
Table 19: Liquid Biopsy Market Supplier Analysis 2018-2019 (US$)
Table 20: Liquid Biopsy Market Distributor Analysis 2018-2019 (US$)
Table 21: Liquid Biopsy Market Trend Analysis 2018-2019 (US$)
Table 22: Liquid Biopsy Market Size 2018 (US$)
Table 23: Liquid Biopsy Market Forecast Analysis 2021-2026 (US$)
Table 24: Liquid Biopsy Market Sales Forecast Analysis 2021-2026 (Units)
Table 25: Liquid Biopsy Market, Revenue & Volume, By Cancer Type, 2021-2026 ($)
Table 26: Liquid Biopsy Market By Cancer Type, Revenue & Volume, By Lung Cancer, 2021-2026 ($)
Table 27: Liquid Biopsy Market By Cancer Type, Revenue & Volume, By Breast Cancer, 2021-2026 ($)
Table 28: Liquid Biopsy Market By Cancer Type, Revenue & Volume, By Colorectal Cancer, 2021-2026 ($)
Table 29: Liquid Biopsy Market By Cancer Type, Revenue & Volume, By Prostate Cancer, 2021-2026 ($)
Table 30: Liquid Biopsy Market By Cancer Type, Revenue & Volume, By Liver Cancer, 2021-2026 ($)
Table 31: Liquid Biopsy Market, Revenue & Volume, By Circulating Biomarker, 2021-2026 ($)
Table 32: Liquid Biopsy Market By Circulating Biomarker, Revenue & Volume, By Circulating Tumor Cells, 2021-2026 ($)
Table 33: Liquid Biopsy Market By Circulating Biomarker, Revenue & Volume, By Extracellular Vesicles, 2021-2026 ($)
Table 34: Liquid Biopsy Market By Circulating Biomarker, Revenue & Volume, By Circulating Tumor DNA (CTDNA), 2021-2026 ($)
Table 35: Liquid Biopsy Market, Revenue & Volume, By End User, 2021-2026 ($)
Table 36: Liquid Biopsy Market By End User, Revenue & Volume, By Reference Laboratory, 2021-2026 ($)
Table 37: Liquid Biopsy Market By End User, Revenue & Volume, By Research Centers, 2021-2026 ($)
Table 38: North America Liquid Biopsy Market, Revenue & Volume, By Cancer Type, 2021-2026 ($)
Table 39: North America Liquid Biopsy Market, Revenue & Volume, By Circulating Biomarker, 2021-2026 ($)
Table 40: North America Liquid Biopsy Market, Revenue & Volume, By End User, 2021-2026 ($)
Table 41: South america Liquid Biopsy Market, Revenue & Volume, By Cancer Type, 2021-2026 ($)
Table 42: South america Liquid Biopsy Market, Revenue & Volume, By Circulating Biomarker, 2021-2026 ($)
Table 43: South america Liquid Biopsy Market, Revenue & Volume, By End User, 2021-2026 ($)
Table 44: Europe Liquid Biopsy Market, Revenue & Volume, By Cancer Type, 2021-2026 ($)
Table 45: Europe Liquid Biopsy Market, Revenue & Volume, By Circulating Biomarker, 2021-2026 ($)
Table 46: Europe Liquid Biopsy Market, Revenue & Volume, By End User, 2021-2026 ($)
Table 47: APAC Liquid Biopsy Market, Revenue & Volume, By Cancer Type, 2021-2026 ($)
Table 48: APAC Liquid Biopsy Market, Revenue & Volume, By Circulating Biomarker, 2021-2026 ($)
Table 49: APAC Liquid Biopsy Market, Revenue & Volume, By End User, 2021-2026 ($)
Table 50: Middle East & Africa Liquid Biopsy Market, Revenue & Volume, By Cancer Type, 2021-2026 ($)
Table 51: Middle East & Africa Liquid Biopsy Market, Revenue & Volume, By Circulating Biomarker, 2021-2026 ($)
Table 52: Middle East & Africa Liquid Biopsy Market, Revenue & Volume, By End User, 2021-2026 ($)
Table 53: Russia Liquid Biopsy Market, Revenue & Volume, By Cancer Type, 2021-2026 ($)
Table 54: Russia Liquid Biopsy Market, Revenue & Volume, By Circulating Biomarker, 2021-2026 ($)
Table 55: Russia Liquid Biopsy Market, Revenue & Volume, By End User, 2021-2026 ($)
Table 56: Israel Liquid Biopsy Market, Revenue & Volume, By Cancer Type, 2021-2026 ($)
Table 57: Israel Liquid Biopsy Market, Revenue & Volume, By Circulating Biomarker, 2021-2026 ($)
Table 58: Israel Liquid Biopsy Market, Revenue & Volume, By End User, 2021-2026 ($)
Table 59: Top Companies 2018 (US$) Liquid Biopsy Market, Revenue & Volume
Table 60: Product Launch 2018-2019 Liquid Biopsy Market, Revenue & Volume
Table 61: Mergers & Acquistions 2018-2019 Liquid Biopsy Market, Revenue & Volume
List of Figures:
Figure 1: Overview of Liquid Biopsy Market 2021-2026
Figure 2: Market Share Analysis for Liquid Biopsy Market 2018 (US$)
Figure 3: Product Comparison in Liquid Biopsy Market 2018-2019 (US$)
Figure 4: End User Profile for Liquid Biopsy Market 2018-2019 (US$)
Figure 5: Patent Application and Grant in Liquid Biopsy Market 2013-2018* (US$)
Figure 6: Top 5 Companies Financial Analysis in Liquid Biopsy Market 2018-2019 (US$)
Figure 7: Market Entry Strategy in Liquid Biopsy Market 2018-2019
Figure 8: Ecosystem Analysis in Liquid Biopsy Market 2018
Figure 9: Average Selling Price in Liquid Biopsy Market 2021-2026
Figure 10: Top Opportunites in Liquid Biopsy Market 2018-2019
Figure 11: Market Life Cycle Analysis in Liquid Biopsy Market
Figure 12: GlobalBy Cancer Type Liquid Biopsy Market Revenue, 2021-2026 ($)
Figure 13: GlobalBy Circulating Biomarker Liquid Biopsy Market Revenue, 2021-2026 ($)
Figure 14: GlobalBy End User Liquid Biopsy Market Revenue, 2021-2026 ($)
Figure 15: Global Liquid Biopsy Market - By Geography
Figure 16: Global Liquid Biopsy Market Value & Volume, By Geography, 2021-2026 ($)
Figure 17: Global Liquid Biopsy Market CAGR, By Geography, 2021-2026 (%)
Figure 18: North America Liquid Biopsy Market Value & Volume, 2021-2026 ($)
Figure 19: US Liquid Biopsy Market Value & Volume, 2021-2026 ($)
Figure 20: US GDP and Population, 2018-2019 ($)
Figure 21: US GDP – Composition of 2018, By Sector of Origin
Figure 22: US Export and Import Value & Volume, 2018-2019 ($)
Figure 23: Canada Liquid Biopsy Market Value & Volume, 2021-2026 ($)
Figure 24: Canada GDP and Population, 2018-2019 ($)
Figure 25: Canada GDP – Composition of 2018, By Sector of Origin
Figure 26: Canada Export and Import Value & Volume, 2018-2019 ($)
Figure 27: Mexico Liquid Biopsy Market Value & Volume, 2021-2026 ($)
Figure 28: Mexico GDP and Population, 2018-2019 ($)
Figure 29: Mexico GDP – Composition of 2018, By Sector of Origin
Figure 30: Mexico Export and Import Value & Volume, 2018-2019 ($)
Figure 31: South America Liquid Biopsy Market Value & Volume, 2021-2026 ($)
Figure 32: Brazil Liquid Biopsy Market Value & Volume, 2021-2026 ($)
Figure 33: Brazil GDP and Population, 2018-2019 ($)
Figure 34: Brazil GDP – Composition of 2018, By Sector of Origin
Figure 35: Brazil Export and Import Value & Volume, 2018-2019 ($)
Figure 36: Venezuela Liquid Biopsy Market Value & Volume, 2021-2026 ($)
Figure 37: Venezuela GDP and Population, 2018-2019 ($)
Figure 38: Venezuela GDP – Composition of 2018, By Sector of Origin
Figure 39: Venezuela Export and Import Value & Volume, 2018-2019 ($)
Figure 40: Argentina Liquid Biopsy Market Value & Volume, 2021-2026 ($)
Figure 41: Argentina GDP and Population, 2018-2019 ($)
Figure 42: Argentina GDP – Composition of 2018, By Sector of Origin
Figure 43: Argentina Export and Import Value & Volume, 2018-2019 ($)
Figure 44: Ecuador Liquid Biopsy Market Value & Volume, 2021-2026 ($)
Figure 45: Ecuador GDP and Population, 2018-2019 ($)
Figure 46: Ecuador GDP – Composition of 2018, By Sector of Origin
Figure 47: Ecuador Export and Import Value & Volume, 2018-2019 ($)
Figure 48: Peru Liquid Biopsy Market Value & Volume, 2021-2026 ($)
Figure 49: Peru GDP and Population, 2018-2019 ($)
Figure 50: Peru GDP – Composition of 2018, By Sector of Origin
Figure 51: Peru Export and Import Value & Volume, 2018-2019 ($)
Figure 52: Colombia Liquid Biopsy Market Value & Volume, 2021-2026 ($)
Figure 53: Colombia GDP and Population, 2018-2019 ($)
Figure 54: Colombia GDP – Composition of 2018, By Sector of Origin
Figure 55: Colombia Export and Import Value & Volume, 2018-2019 ($)
Figure 56: Costa Rica Liquid Biopsy Market Value & Volume, 2021-2026 ($)
Figure 57: Costa Rica GDP and Population, 2018-2019 ($)
Figure 58: Costa Rica GDP – Composition of 2018, By Sector of Origin
Figure 59: Costa Rica Export and Import Value & Volume, 2018-2019 ($)
Figure 60: Europe Liquid Biopsy Market Value & Volume, 2021-2026 ($)
Figure 61: U.K Liquid Biopsy Market Value & Volume, 2021-2026 ($)
Figure 62: U.K GDP and Population, 2018-2019 ($)
Figure 63: U.K GDP – Composition of 2018, By Sector of Origin
Figure 64: U.K Export and Import Value & Volume, 2018-2019 ($)
Figure 65: Germany Liquid Biopsy Market Value & Volume, 2021-2026 ($)
Figure 66: Germany GDP and Population, 2018-2019 ($)
Figure 67: Germany GDP – Composition of 2018, By Sector of Origin
Figure 68: Germany Export and Import Value & Volume, 2018-2019 ($)
Figure 69: Italy Liquid Biopsy Market Value & Volume, 2021-2026 ($)
Figure 70: Italy GDP and Population, 2018-2019 ($)
Figure 71: Italy GDP – Composition of 2018, By Sector of Origin
Figure 72: Italy Export and Import Value & Volume, 2018-2019 ($)
Figure 73: France Liquid Biopsy Market Value & Volume, 2021-2026 ($)
Figure 74: France GDP and Population, 2018-2019 ($)
Figure 75: France GDP – Composition of 2018, By Sector of Origin
Figure 76: France Export and Import Value & Volume, 2018-2019 ($)
Figure 77: Netherlands Liquid Biopsy Market Value & Volume, 2021-2026 ($)
Figure 78: Netherlands GDP and Population, 2018-2019 ($)
Figure 79: Netherlands GDP – Composition of 2018, By Sector of Origin
Figure 80: Netherlands Export and Import Value & Volume, 2018-2019 ($)
Figure 81: Belgium Liquid Biopsy Market Value & Volume, 2021-2026 ($)
Figure 82: Belgium GDP and Population, 2018-2019 ($)
Figure 83: Belgium GDP – Composition of 2018, By Sector of Origin
Figure 84: Belgium Export and Import Value & Volume, 2018-2019 ($)
Figure 85: Spain Liquid Biopsy Market Value & Volume, 2021-2026 ($)
Figure 86: Spain GDP and Population, 2018-2019 ($)
Figure 87: Spain GDP – Composition of 2018, By Sector of Origin
Figure 88: Spain Export and Import Value & Volume, 2018-2019 ($)
Figure 89: Denmark Liquid Biopsy Market Value & Volume, 2021-2026 ($)
Figure 90: Denmark GDP and Population, 2018-2019 ($)
Figure 91: Denmark GDP – Composition of 2018, By Sector of Origin
Figure 92: Denmark Export and Import Value & Volume, 2018-2019 ($)
Figure 93: APAC Liquid Biopsy Market Value & Volume, 2021-2026 ($)
Figure 94: China Liquid Biopsy Market Value & Volume, 2021-2026
Figure 95: China GDP and Population, 2018-2019 ($)
Figure 96: China GDP – Composition of 2018, By Sector of Origin
Figure 97: China Export and Import Value & Volume, 2018-2019 ($) Liquid Biopsy Market China Export and Import Value & Volume, 2018-2019 ($)
Figure 98: Australia Liquid Biopsy Market Value & Volume, 2021-2026 ($)
Figure 99: Australia GDP and Population, 2018-2019 ($)
Figure 100: Australia GDP – Composition of 2018, By Sector of Origin
Figure 101: Australia Export and Import Value & Volume, 2018-2019 ($)
Figure 102: South Korea Liquid Biopsy Market Value & Volume, 2021-2026 ($)
Figure 103: South Korea GDP and Population, 2018-2019 ($)
Figure 104: South Korea GDP – Composition of 2018, By Sector of Origin
Figure 105: South Korea Export and Import Value & Volume, 2018-2019 ($)
Figure 106: India Liquid Biopsy Market Value & Volume, 2021-2026 ($)
Figure 107: India GDP and Population, 2018-2019 ($)
Figure 108: India GDP – Composition of 2018, By Sector of Origin
Figure 109: India Export and Import Value & Volume, 2018-2019 ($)
Figure 110: Taiwan Liquid Biopsy Market Value & Volume, 2021-2026 ($)
Figure 111: Taiwan GDP and Population, 2018-2019 ($)
Figure 112: Taiwan GDP – Composition of 2018, By Sector of Origin
Figure 113: Taiwan Export and Import Value & Volume, 2018-2019 ($)
Figure 114: Malaysia Liquid Biopsy Market Value & Volume, 2021-2026 ($)
Figure 115: Malaysia GDP and Population, 2018-2019 ($)
Figure 116: Malaysia GDP – Composition of 2018, By Sector of Origin
Figure 117: Malaysia Export and Import Value & Volume, 2018-2019 ($)
Figure 118: Hong Kong Liquid Biopsy Market Value & Volume, 2021-2026 ($)
Figure 119: Hong Kong GDP and Population, 2018-2019 ($)
Figure 120: Hong Kong GDP – Composition of 2018, By Sector of Origin
Figure 121: Hong Kong Export and Import Value & Volume, 2018-2019 ($)
Figure 122: Middle East & Africa Liquid Biopsy Market Middle East & Africa 3D Printing Market Value & Volume, 2021-2026 ($)
Figure 123: Russia Liquid Biopsy Market Value & Volume, 2021-2026 ($)
Figure 124: Russia GDP and Population, 2018-2019 ($)
Figure 125: Russia GDP – Composition of 2018, By Sector of Origin
Figure 126: Russia Export and Import Value & Volume, 2018-2019 ($)
Figure 127: Israel Liquid Biopsy Market Value & Volume, 2021-2026 ($)
Figure 128: Israel GDP and Population, 2018-2019 ($)
Figure 129: Israel GDP – Composition of 2018, By Sector of Origin
Figure 130: Israel Export and Import Value & Volume, 2018-2019 ($)
Figure 131: Entropy Share, By Strategies, 2018-2019* (%) Liquid Biopsy Market
Figure 132: Developments, 2018-2019* Liquid Biopsy Market
Figure 133: Company 1 Liquid Biopsy Market Net Revenue, By Years, 2018-2019* ($)
Figure 134: Company 1 Liquid Biopsy Market Net Revenue Share, By Business segments, 2018 (%)
Figure 135: Company 1 Liquid Biopsy Market Net Sales Share, By Geography, 2018 (%)
Figure 136: Company 2 Liquid Biopsy Market Net Revenue, By Years, 2018-2019* ($)
Figure 137: Company 2 Liquid Biopsy Market Net Revenue Share, By Business segments, 2018 (%)
Figure 138: Company 2 Liquid Biopsy Market Net Sales Share, By Geography, 2018 (%)
Figure 139: Company 3 Liquid Biopsy Market Net Revenue, By Years, 2018-2019* ($)
Figure 140: Company 3 Liquid Biopsy Market Net Revenue Share, By Business segments, 2018 (%)
Figure 141: Company 3 Liquid Biopsy Market Net Sales Share, By Geography, 2018 (%)
Figure 142: Company 4 Liquid Biopsy Market Net Revenue, By Years, 2018-2019* ($)
Figure 143: Company 4 Liquid Biopsy Market Net Revenue Share, By Business segments, 2018 (%)
Figure 144: Company 4 Liquid Biopsy Market Net Sales Share, By Geography, 2018 (%)
Figure 145: Company 5 Liquid Biopsy Market Net Revenue, By Years, 2018-2019* ($)
Figure 146: Company 5 Liquid Biopsy Market Net Revenue Share, By Business segments, 2018 (%)
Figure 147: Company 5 Liquid Biopsy Market Net Sales Share, By Geography, 2018 (%)
Figure 148: Company 6 Liquid Biopsy Market Net Revenue, By Years, 2018-2019* ($)
Figure 149: Company 6 Liquid Biopsy Market Net Revenue Share, By Business segments, 2018 (%)
Figure 150: Company 6 Liquid Biopsy Market Net Sales Share, By Geography, 2018 (%)
Figure 151: Company 7 Liquid Biopsy Market Net Revenue, By Years, 2018-2019* ($)
Figure 152: Company 7 Liquid Biopsy Market Net Revenue Share, By Business segments, 2018 (%)
Figure 153: Company 7 Liquid Biopsy Market Net Sales Share, By Geography, 2018 (%)
Figure 154: Company 8 Liquid Biopsy Market Net Revenue, By Years, 2018-2019* ($)
Figure 155: Company 8 Liquid Biopsy Market Net Revenue Share, By Business segments, 2018 (%)
Figure 156: Company 8 Liquid Biopsy Market Net Sales Share, By Geography, 2018 (%)
Figure 157: Company 9 Liquid Biopsy Market Net Revenue, By Years, 2018-2019* ($)
Figure 158: Company 9 Liquid Biopsy Market Net Revenue Share, By Business segments, 2018 (%)
Figure 159: Company 9 Liquid Biopsy Market Net Sales Share, By Geography, 2018 (%)
Figure 160: Company 10 Liquid Biopsy Market Net Revenue, By Years, 2018-2019* ($)
Figure 161: Company 10 Liquid Biopsy Market Net Revenue Share, By Business segments, 2018 (%)
Figure 162: Company 10 Liquid Biopsy Market Net Sales Share, By Geography, 2018 (%)
Figure 163: Company 11 Liquid Biopsy Market Net Revenue, By Years, 2018-2019* ($)
Figure 164: Company 11 Liquid Biopsy Market Net Revenue Share, By Business segments, 2018 (%)
Figure 165: Company 11 Liquid Biopsy Market Net Sales Share, By Geography, 2018 (%)
Figure 166: Company 12 Liquid Biopsy Market Net Revenue, By Years, 2018-2019* ($)
Figure 167: Company 12 Liquid Biopsy Market Net Revenue Share, By Business segments, 2018 (%)
Figure 168: Company 12 Liquid Biopsy Market Net Sales Share, By Geography, 2018 (%)
Figure 169: Company 13 Liquid Biopsy Market Net Revenue, By Years, 2018-2019* ($)
Figure 170: Company 13 Liquid Biopsy Market Net Revenue Share, By Business segments, 2018 (%)
Figure 171: Company 13 Liquid Biopsy Market Net Sales Share, By Geography, 2018 (%)
Figure 172: Company 14 Liquid Biopsy Market Net Revenue, By Years, 2018-2019* ($)
Figure 173: Company 14 Liquid Biopsy Market Net Revenue Share, By Business segments, 2018 (%)
Figure 174: Company 14 Liquid Biopsy Market Net Sales Share, By Geography, 2018 (%)
Figure 175: Company 15 Liquid Biopsy Market Net Revenue, By Years, 2018-2019* ($)
Figure 176: Company 15 Liquid Biopsy Market Net Revenue Share, By Business segments, 2018 (%)
Figure 177: Company 15 Liquid Biopsy Market Net Sales Share, By Geography, 2018 (%)