 Email
Email Print
Print


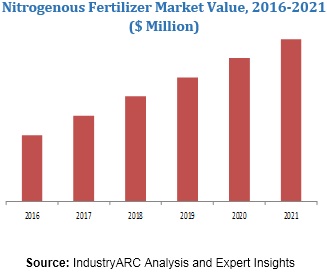
Nitrogenous Fertilizer Market - Forecast(2024 - 2030)
The nitrogenous fertilizer market can be bifurcated on the basis of its ingredients that include nitrate, ammonium, urea, amine and others. Urea-based nitrogenous fertilizers have been the most dominant product segment in terms of consumption. Globally, Technological Advancement, Rising demand for automobile industry the developing nations are the prime growth drivers of global Nitrogenous Fertilizer market. In addition, emerging economies such as China, India and others, will create new opportunities for global Nitrogenous Fertilizer market. However, higher cost of the research and development, and Due to environmental concerns along with heavy duties on the nitrogenous fertilizers are the key restraints for global nitrogenous fertilizer market.
Asia Pacific has been dominating the global nitrogenous fertilizer market and this trend is expected to continue in the near future. Rice production is expected to dominate the demand for nitrogenous fertilizers in Asia Pacific. North America is the second largest consumer of nitrogenous fertilizers. The U.S. dominates the nitrogenous fertilizer market in North America. In Europe, the demand for nitrogenous fertilizers is driven by the growing demand for ammonium nitrate. Demand for nitrogenous fertilizer in North America and Europe is anticipated to grow at a sluggish rate primarily owing to market saturation. RoW is expected to be the fastest growing region in the near future.
This report identifies the nitrogenous fertilizer market size in for the year 2016-2021, and forecast of the same for year 2021. It also highlights the potential growth opportunities in the coming years, while also reviewing the market drivers, restraints, growth indicators, challenges, market dynamics, competitive landscape, and other key aspects with respect to Nitrogenous Fertilizer market.
This report segments global nitrogenous fertilizer market on the basis of crops, applications, and regional market as follows:
- This report is segmented into major crops such as, Cereals and Grains, Oil Seeds, Fruits and Vegetables, and Others
- This is report has been further segmented into major regions, which includes detailed analysis of each region such as North America, Europe, Asia-Pacific (APAC) and Rest of the World (RoW) covering all the major country level markets for Nitrogenous Fertilizer in each of the region.
This report identifies all the major companies operating in the global Nitrogenous Fertilizer market. Some of the major companies’ profiles in detail are as follows:
- Yara International ASA
- Coromandel International Ltd
- CF Industries Holdings Inc
- Potash Corp. of Saskatchewan
- Eurochem Atomax Chemicals Co., Ltd
1. Nitrogenous Fertilizer Market - Overview
1.1. Definitions and Scope
2. Nitrogenous Fertilizer Market - Executive summary
2.1. Market Revenue, Market Size and Key Trends by Company
2.2. Key Trends by type of Application
2.3. Key Trends segmented by Geography
3. Nitrogenous Fertilizer Market
3.1. Comparative analysis
3.1.1. Product Benchmarking - Top 10 companies
3.1.2. Top 5 Financials Analysis
3.1.3. Market Value split by Top 10 companies
3.1.4. Patent Analysis - Top 10 companies
3.1.5. Pricing Analysis
4. Nitrogenous Fertilizer Market – Startup companies Scenario Premium
4.1. Top 10 startup company Analysis by
4.1.1. Investment
4.1.2. Revenue
4.1.3. Market Shares
4.1.4. Market Size and Application Analysis
4.1.5. Venture Capital and Funding Scenario
5. Nitrogenous Fertilizer Market – Industry Market Entry Scenario Premium
5.1. Regulatory Framework Overview
5.2. New Business and Ease of Doing business index
5.3. Case studies of successful ventures
5.4. Customer Analysis – Top 10 companies
6. Nitrogenous Fertilizer Market Forces
6.1. Drivers
6.2. Constraints
6.3. Challenges
6.4. Porters five force model
6.4.1. Bargaining power of suppliers
6.4.2. Bargaining powers of customers
6.4.3. Threat of new entrants
6.4.4. Rivalry among existing players
6.4.5. Threat of substitutes
7. Nitrogenous Fertilizer Market -Strategic analysis
7.1. Value chain analysis
7.2. Opportunities analysis
7.3. Product life cycle
7.4. Suppliers and distributors Market Share
8. Nitrogenous Fertilizer Market – By Source (Market Size -$Million / $Billion)
8.1. Market Size and Market Share Analysis
8.2. Application Revenue and Trend Research
8.3. Product Segment Analysis
8.3.1. Introduction
8.3.2. Animal Byproducts
8.3.2.1. Blood Meal
8.3.2.2. Composted Manure
8.3.2.3. Poultry Manure
8.3.2.4. Guano
8.3.2.5. Feather Meal
8.3.2.6. Fish Meal & Fish Emulsion
8.3.2.7. Others
8.3.3. Plant Based
8.3.3.1. Alfalfa Meal
8.3.3.2. Cotton-seed Meal
8.3.3.3. Corn Gluten
8.3.3.4. Soybean Mean
8.3.3.5. Others
8.3.4. Mineral Sources
9. Nitrogenous Fertilizer Market – By Additives / Stabilizers (Market Size -$Million / $Billion)
9.1. Introduction
9.2. Nitrification Inhibitors
9.3. Nitrapyrin
9.4. Urease Inhibitors
9.5. Agrotain
9.6. Others
10. Nitrogenous Fertilizer Market – By Fertilizer Type (Market Size -$Million / $Billion)
10.1. Introduction
10.2. Nitrate Fertilizers
10.2.1. Sodium Nitrate
10.2.2. Calcium Nitrate
10.2.3. Potassium Nitrate
10.3. Ammonical Fertilizers
10.3.1. Ammonium Suplphate
10.3.2. Ammonium Chloride
10.3.3. Mono-Ammonium Phosphate
10.3.4. Di-Ammonium Phosphate (DAP
10.3.5. Ammonium Solution
10.4. Ammonical-Nitrate Fertilizers
10.4.1. Ammonium Nitrate
10.4.2. Ammonium Sulphate Nitrate
10.4.3. Calcium Ammonium Nitrate
10.5. Amide Fertilizers
10.5.1. Urea
10.5.2. Calcium Cynamide
11. Nitrogenous Fertilizer Market – By Form (Market Size -$Million / $Billion)
11.1. Introduction
11.2. Solid
11.2.1. Powder
11.2.2. Crystals
11.2.3. Prills
11.2.4. Granules
11.2.5. Super granules
11.2.6. Briquettes
11.3. Liquid
11.3.1. Solutions
11.3.2. Suspensions
11.4. Others
12. Nitrogenous Fertilizer Market – By Method (Market Size -$Million / $Billion)
12.1. Introduction
12.2. Fertigation
12.3. Foliar
12.4. Others
13. Nitrogenous Fertilizer Market – By Application (Market Size -$Million / $Billion)
13.1. Introduction
13.2. Top Dressing
13.3. Soil Fertilization
13.4. Leaf Fertilization
13.5. Others
14. Nitrogenous Fertilizer Market – By Target Crop (Market Size -$Million / $Billion)
14.1. Introduction
14.2. Cereals & Grains
14.2.1. Rice
14.2.2. Red Gram
14.2.3. Black Gram
14.2.4. Bengal Gram
14.2.5. Pigeon Pea
14.2.6. Chick Pea
14.2.7. Others
14.3. Oilseeds
14.3.1. Cotton
14.3.2. Sunflower
14.3.3. Soybean
14.3.4. Ground nut
14.3.5. Others
14.4. Fruits
14.4.1. Mango
14.4.2. Apple
14.4.3. Grapes
14.4.4. Other
14.5. Vegetables
14.5.1. Brinjal
14.5.2. Cabbage
14.5.3. Tomato
14.5.4. Potato
14.5.5. Chilli
14.5.6. Others
14.6. Others
15. Nitrogenous Fertilizer - By Geography (Market Size -$Million / $Billion)
15.1. Nitrogenous Fertilizer Market - North America Segment Research
15.2. North America Market Research (Million / $Billion)
15.2.1. Segment type Size and Market Size Analysis
15.2.2. Revenue and Trends
15.2.3. Application Revenue and Trends by type of Application
15.2.4. Company Revenue and Product Analysis
15.2.5. North America Product type and Application Market Size
15.2.5.1. U.S.
15.2.5.2. Canada
15.2.5.3. Mexico
15.2.5.4. Rest of North America
15.3. Nitrogenous Fertilizer - South America Segment Research
15.4. South America Market Research (Market Size -$Million / $Billion)
15.4.1. Segment type Size and Market Size Analysis
15.4.2. Revenue and Trends
15.4.3. Application Revenue and Trends by type of Application
15.4.4. Company Revenue and Product Analysis
15.4.5. South America Product type and Application Market Size
15.4.5.1. Brazil
15.4.5.2. Venezuela
15.4.5.3. Argentina
15.4.5.4. Ecuador
15.4.5.5. Peru
15.4.5.6. Colombia
15.4.5.7. Costa Rica
15.4.5.8. Rest of South America
15.5. Nitrogenous Fertilizer - Europe Segment Research
15.6. Europe Market Research (Market Size -$Million / $Billion)
15.6.1. Segment type Size and Market Size Analysis
15.6.2. Revenue and Trends
15.6.3. Application Revenue and Trends by type of Application
15.6.4. Company Revenue and Product Analysis
15.6.5. Europe Segment Product type and Application Market Size
15.6.5.1. U.K
15.6.5.2. Germany
15.6.5.3. Italy
15.6.5.4. France
15.6.5.5. Netherlands
15.6.5.6. Belgium
15.6.5.7. Spain
15.6.5.8. Denmark
15.6.5.9. Rest of Europe
15.7. Nitrogenous Fertilizer – APAC Segment Research
15.8. APAC Market Research (Market Size -$Million / $Billion)
15.8.1. Segment type Size and Market Size Analysis
15.8.2. Revenue and Trends
15.8.3. Application Revenue and Trends by type of Application
15.8.4. Company Revenue and Product Analysis
15.8.5. APAC Segment – Product type and Application Market Size
15.8.5.1. China
15.8.5.2. Australia
15.8.5.3. Japan
15.8.5.4. South Korea
15.8.5.5. India
15.8.5.6. Taiwan
15.8.5.7. Malaysia
16. Nitrogenous Fertilizer Market - Entropy
16.1. New product launches
16.2. M&A's, collaborations, JVs and partnerships
17. Nitrogenous Fertilizer Market – Industry / Segment Competition landscape Premium
17.1. Market Share Analysis
17.1.1. Market Share by Country- Top companies
17.1.2. Market Share by Region- Top 10 companies
17.1.3. Market Share by type of Application – Top 10 companies
17.1.4. Market Share by type of Product / Product category- Top 10 companies
17.1.5. Market Share at global level- Top 10 companies
17.1.6. Best Practises for companies
18. Nitrogenous Fertilizer Market – Key Company List by Country Premium
19. Nitrogenous Fertilizer Market Company Analysis
19.1. Market Share, Company Revenue, Products, M&A, Developments
19.2. Yara International ASA
19.3. Coromandel International Ltd
19.4. CF Industries Holdings Inc
19.5. Potash Corp. of Saskatchewan
19.6. Eurochem Atomax Chemicals Co., Ltd
19.7. Company 6
19.8. Company 7
19.9. Company 8
19.10. Company 9
19.11. Company 10 and more
"*Financials would be provided on a best efforts basis for private companies"
20. Nitrogenous Fertilizer Market -Appendix
20.1. Abbreviations
20.2. Sources
21. Nitrogenous Fertilizer Market -Methodology Premium
21.1. Research Methodology
21.1.1. Company Expert Interviews
21.1.2. Industry Databases
21.1.3. Associations
21.1.4. Company News
21.1.5. Company Annual Reports
21.1.6. Application Trends
21.1.7. New Products and Product database
21.1.8. Company Transcripts
21.1.9. R&D Trends
21.1.10. Key Opinion Leaders Interviews
21.1.11. Supply and Demand Trends
List of Tables:
Table 1: Nitrogenous Fertilizer Market Overview 2021-2026
Table 2: Nitrogenous Fertilizer Market Leader Analysis 2018-2019 (US$)
Table 3: Nitrogenous Fertilizer Market Product Analysis 2018-2019 (US$)
Table 4: Nitrogenous Fertilizer Market End User Analysis 2018-2019 (US$)
Table 5: Nitrogenous Fertilizer Market Patent Analysis 2013-2018* (US$)
Table 6: Nitrogenous Fertilizer Market Financial Analysis 2018-2019 (US$)
Table 7: Nitrogenous Fertilizer Market Driver Analysis 2018-2019 (US$)
Table 8: Nitrogenous Fertilizer Market Challenges Analysis 2018-2019 (US$)
Table 9: Nitrogenous Fertilizer Market Constraint Analysis 2018-2019 (US$)
Table 10: Nitrogenous Fertilizer Market Supplier Bargaining Power Analysis 2018-2019 (US$)
Table 11: Nitrogenous Fertilizer Market Buyer Bargaining Power Analysis 2018-2019 (US$)
Table 12: Nitrogenous Fertilizer Market Threat of Substitutes Analysis 2018-2019 (US$)
Table 13: Nitrogenous Fertilizer Market Threat of New Entrants Analysis 2018-2019 (US$)
Table 14: Nitrogenous Fertilizer Market Degree of Competition Analysis 2018-2019 (US$)
Table 15: Nitrogenous Fertilizer Market Value Chain Analysis 2018-2019 (US$)
Table 16: Nitrogenous Fertilizer Market Pricing Analysis 2021-2026 (US$)
Table 17: Nitrogenous Fertilizer Market Opportunities Analysis 2021-2026 (US$)
Table 18: Nitrogenous Fertilizer Market Product Life Cycle Analysis 2021-2026 (US$)
Table 19: Nitrogenous Fertilizer Market Supplier Analysis 2018-2019 (US$)
Table 20: Nitrogenous Fertilizer Market Distributor Analysis 2018-2019 (US$)
Table 21: Nitrogenous Fertilizer Market Trend Analysis 2018-2019 (US$)
Table 22: Nitrogenous Fertilizer Market Size 2018 (US$)
Table 23: Nitrogenous Fertilizer Market Forecast Analysis 2021-2026 (US$)
Table 24: Nitrogenous Fertilizer Market Sales Forecast Analysis 2021-2026 (Units)
Table 25: Nitrogenous Fertilizer Market, Revenue & Volume, By Crops, 2021-2026 ($)
Table 26: Nitrogenous Fertilizer Market By Crops, Revenue & Volume, By Cereals and Grains, 2021-2026 ($)
Table 27: Nitrogenous Fertilizer Market By Crops, Revenue & Volume, By Oil Seeds, 2021-2026 ($)
Table 28: Nitrogenous Fertilizer Market By Crops, Revenue & Volume, By Fruits and Vegetables, 2021-2026 ($)
Table 29: North America Nitrogenous Fertilizer Market, Revenue & Volume, By Crops, 2021-2026 ($)
Table 30: South america Nitrogenous Fertilizer Market, Revenue & Volume, By Crops, 2021-2026 ($)
Table 31: Europe Nitrogenous Fertilizer Market, Revenue & Volume, By Crops, 2021-2026 ($)
Table 32: APAC Nitrogenous Fertilizer Market, Revenue & Volume, By Crops, 2021-2026 ($)
Table 33: Middle East & Africa Nitrogenous Fertilizer Market, Revenue & Volume, By Crops, 2021-2026 ($)
Table 34: Russia Nitrogenous Fertilizer Market, Revenue & Volume, By Crops, 2021-2026 ($)
Table 35: Israel Nitrogenous Fertilizer Market, Revenue & Volume, By Crops, 2021-2026 ($)
Table 36: Top Companies 2018 (US$)Nitrogenous Fertilizer Market, Revenue & Volume
Table 37: Product Launch 2018-2019Nitrogenous Fertilizer Market, Revenue & Volume
Table 38: Mergers & Acquistions 2018-2019Nitrogenous Fertilizer Market, Revenue & Volume
List of Figures:
Figure 1: Overview of Nitrogenous Fertilizer Market 2021-2026
Figure 2: Market Share Analysis for Nitrogenous Fertilizer Market 2018 (US$)
Figure 3: Product Comparison in Nitrogenous Fertilizer Market 2018-2019 (US$)
Figure 4: End User Profile for Nitrogenous Fertilizer Market 2018-2019 (US$)
Figure 5: Patent Application and Grant in Nitrogenous Fertilizer Market 2013-2018* (US$)
Figure 6: Top 5 Companies Financial Analysis in Nitrogenous Fertilizer Market 2018-2019 (US$)
Figure 7: Market Entry Strategy in Nitrogenous Fertilizer Market 2018-2019
Figure 8: Ecosystem Analysis in Nitrogenous Fertilizer Market 2018
Figure 9: Average Selling Price in Nitrogenous Fertilizer Market 2021-2026
Figure 10: Top Opportunites in Nitrogenous Fertilizer Market 2018-2019
Figure 11: Market Life Cycle Analysis in Nitrogenous Fertilizer Market
Figure 12: GlobalBy CropsNitrogenous Fertilizer Market Revenue, 2021-2026 ($)
Figure 13: Global Nitrogenous Fertilizer Market - By Geography
Figure 14: Global Nitrogenous Fertilizer Market Value & Volume, By Geography, 2021-2026 ($)
Figure 15: Global Nitrogenous Fertilizer Market CAGR, By Geography, 2021-2026 (%)
Figure 16: North America Nitrogenous Fertilizer Market Value & Volume, 2021-2026 ($)
Figure 17: US Nitrogenous Fertilizer Market Value & Volume, 2021-2026 ($)
Figure 18: US GDP and Population, 2018-2019 ($)
Figure 19: US GDP – Composition of 2018, By Sector of Origin
Figure 20: US Export and Import Value & Volume, 2018-2019 ($)
Figure 21: Canada Nitrogenous Fertilizer Market Value & Volume, 2021-2026 ($)
Figure 22: Canada GDP and Population, 2018-2019 ($)
Figure 23: Canada GDP – Composition of 2018, By Sector of Origin
Figure 24: Canada Export and Import Value & Volume, 2018-2019 ($)
Figure 25: Mexico Nitrogenous Fertilizer Market Value & Volume, 2021-2026 ($)
Figure 26: Mexico GDP and Population, 2018-2019 ($)
Figure 27: Mexico GDP – Composition of 2018, By Sector of Origin
Figure 28: Mexico Export and Import Value & Volume, 2018-2019 ($)
Figure 29: South America Nitrogenous Fertilizer Market Value & Volume, 2021-2026 ($)
Figure 30: Brazil Nitrogenous Fertilizer Market Value & Volume, 2021-2026 ($)
Figure 31: Brazil GDP and Population, 2018-2019 ($)
Figure 32: Brazil GDP – Composition of 2018, By Sector of Origin
Figure 33: Brazil Export and Import Value & Volume, 2018-2019 ($)
Figure 34: Venezuela Nitrogenous Fertilizer Market Value & Volume, 2021-2026 ($)
Figure 35: Venezuela GDP and Population, 2018-2019 ($)
Figure 36: Venezuela GDP – Composition of 2018, By Sector of Origin
Figure 37: Venezuela Export and Import Value & Volume, 2018-2019 ($)
Figure 38: Argentina Nitrogenous Fertilizer Market Value & Volume, 2021-2026 ($)
Figure 39: Argentina GDP and Population, 2018-2019 ($)
Figure 40: Argentina GDP – Composition of 2018, By Sector of Origin
Figure 41: Argentina Export and Import Value & Volume, 2018-2019 ($)
Figure 42: Ecuador Nitrogenous Fertilizer Market Value & Volume, 2021-2026 ($)
Figure 43: Ecuador GDP and Population, 2018-2019 ($)
Figure 44: Ecuador GDP – Composition of 2018, By Sector of Origin
Figure 45: Ecuador Export and Import Value & Volume, 2018-2019 ($)
Figure 46: Peru Nitrogenous Fertilizer Market Value & Volume, 2021-2026 ($)
Figure 47: Peru GDP and Population, 2018-2019 ($)
Figure 48: Peru GDP – Composition of 2018, By Sector of Origin
Figure 49: Peru Export and Import Value & Volume, 2018-2019 ($)
Figure 50: Colombia Nitrogenous Fertilizer Market Value & Volume, 2021-2026 ($)
Figure 51: Colombia GDP and Population, 2018-2019 ($)
Figure 52: Colombia GDP – Composition of 2018, By Sector of Origin
Figure 53: Colombia Export and Import Value & Volume, 2018-2019 ($)
Figure 54: Costa Rica Nitrogenous Fertilizer Market Value & Volume, 2021-2026 ($)
Figure 55: Costa Rica GDP and Population, 2018-2019 ($)
Figure 56: Costa Rica GDP – Composition of 2018, By Sector of Origin
Figure 57: Costa Rica Export and Import Value & Volume, 2018-2019 ($)
Figure 58: Europe Nitrogenous Fertilizer Market Value & Volume, 2021-2026 ($)
Figure 59: U.K Nitrogenous Fertilizer Market Value & Volume, 2021-2026 ($)
Figure 60: U.K GDP and Population, 2018-2019 ($)
Figure 61: U.K GDP – Composition of 2018, By Sector of Origin
Figure 62: U.K Export and Import Value & Volume, 2018-2019 ($)
Figure 63: Germany Nitrogenous Fertilizer Market Value & Volume, 2021-2026 ($)
Figure 64: Germany GDP and Population, 2018-2019 ($)
Figure 65: Germany GDP – Composition of 2018, By Sector of Origin
Figure 66: Germany Export and Import Value & Volume, 2018-2019 ($)
Figure 67: Italy Nitrogenous Fertilizer Market Value & Volume, 2021-2026 ($)
Figure 68: Italy GDP and Population, 2018-2019 ($)
Figure 69: Italy GDP – Composition of 2018, By Sector of Origin
Figure 70: Italy Export and Import Value & Volume, 2018-2019 ($)
Figure 71: France Nitrogenous Fertilizer Market Value & Volume, 2021-2026 ($)
Figure 72: France GDP and Population, 2018-2019 ($)
Figure 73: France GDP – Composition of 2018, By Sector of Origin
Figure 74: France Export and Import Value & Volume, 2018-2019 ($)
Figure 75: Netherlands Nitrogenous Fertilizer Market Value & Volume, 2021-2026 ($)
Figure 76: Netherlands GDP and Population, 2018-2019 ($)
Figure 77: Netherlands GDP – Composition of 2018, By Sector of Origin
Figure 78: Netherlands Export and Import Value & Volume, 2018-2019 ($)
Figure 79: Belgium Nitrogenous Fertilizer Market Value & Volume, 2021-2026 ($)
Figure 80: Belgium GDP and Population, 2018-2019 ($)
Figure 81: Belgium GDP – Composition of 2018, By Sector of Origin
Figure 82: Belgium Export and Import Value & Volume, 2018-2019 ($)
Figure 83: Spain Nitrogenous Fertilizer Market Value & Volume, 2021-2026 ($)
Figure 84: Spain GDP and Population, 2018-2019 ($)
Figure 85: Spain GDP – Composition of 2018, By Sector of Origin
Figure 86: Spain Export and Import Value & Volume, 2018-2019 ($)
Figure 87: Denmark Nitrogenous Fertilizer Market Value & Volume, 2021-2026 ($)
Figure 88: Denmark GDP and Population, 2018-2019 ($)
Figure 89: Denmark GDP – Composition of 2018, By Sector of Origin
Figure 90: Denmark Export and Import Value & Volume, 2018-2019 ($)
Figure 91: APAC Nitrogenous Fertilizer Market Value & Volume, 2021-2026 ($)
Figure 92: China Nitrogenous Fertilizer Market Value & Volume, 2021-2026
Figure 93: China GDP and Population, 2018-2019 ($)
Figure 94: China GDP – Composition of 2018, By Sector of Origin
Figure 95: China Export and Import Value & Volume, 2018-2019 ($)Nitrogenous Fertilizer Market China Export and Import Value & Volume, 2018-2019 ($)
Figure 96: Australia Nitrogenous Fertilizer Market Value & Volume, 2021-2026 ($)
Figure 97: Australia GDP and Population, 2018-2019 ($)
Figure 98: Australia GDP – Composition of 2018, By Sector of Origin
Figure 99: Australia Export and Import Value & Volume, 2018-2019 ($)
Figure 100: South Korea Nitrogenous Fertilizer Market Value & Volume, 2021-2026 ($)
Figure 101: South Korea GDP and Population, 2018-2019 ($)
Figure 102: South Korea GDP – Composition of 2018, By Sector of Origin
Figure 103: South Korea Export and Import Value & Volume, 2018-2019 ($)
Figure 104: India Nitrogenous Fertilizer Market Value & Volume, 2021-2026 ($)
Figure 105: India GDP and Population, 2018-2019 ($)
Figure 106: India GDP – Composition of 2018, By Sector of Origin
Figure 107: India Export and Import Value & Volume, 2018-2019 ($)
Figure 108: Taiwan Nitrogenous Fertilizer Market Value & Volume, 2021-2026 ($)
Figure 109: Taiwan GDP and Population, 2018-2019 ($)
Figure 110: Taiwan GDP – Composition of 2018, By Sector of Origin
Figure 111: Taiwan Export and Import Value & Volume, 2018-2019 ($)
Figure 112: Malaysia Nitrogenous Fertilizer Market Value & Volume, 2021-2026 ($)
Figure 113: Malaysia GDP and Population, 2018-2019 ($)
Figure 114: Malaysia GDP – Composition of 2018, By Sector of Origin
Figure 115: Malaysia Export and Import Value & Volume, 2018-2019 ($)
Figure 116: Hong Kong Nitrogenous Fertilizer Market Value & Volume, 2021-2026 ($)
Figure 117: Hong Kong GDP and Population, 2018-2019 ($)
Figure 118: Hong Kong GDP – Composition of 2018, By Sector of Origin
Figure 119: Hong Kong Export and Import Value & Volume, 2018-2019 ($)
Figure 120: Middle East & Africa Nitrogenous Fertilizer Market Middle East & Africa 3D Printing Market Value & Volume, 2021-2026 ($)
Figure 121: Russia Nitrogenous Fertilizer Market Value & Volume, 2021-2026 ($)
Figure 122: Russia GDP and Population, 2018-2019 ($)
Figure 123: Russia GDP – Composition of 2018, By Sector of Origin
Figure 124: Russia Export and Import Value & Volume, 2018-2019 ($)
Figure 125: Israel Nitrogenous Fertilizer Market Value & Volume, 2021-2026 ($)
Figure 126: Israel GDP and Population, 2018-2019 ($)
Figure 127: Israel GDP – Composition of 2018, By Sector of Origin
Figure 128: Israel Export and Import Value & Volume, 2018-2019 ($)
Figure 129: Entropy Share, By Strategies, 2018-2019* (%)Nitrogenous Fertilizer Market
Figure 130: Developments, 2018-2019*Nitrogenous Fertilizer Market
Figure 131: Company 1 Nitrogenous Fertilizer Market Net Revenue, By Years, 2018-2019* ($)
Figure 132: Company 1 Nitrogenous Fertilizer Market Net Revenue Share, By Business segments, 2018 (%)
Figure 133: Company 1 Nitrogenous Fertilizer Market Net Sales Share, By Geography, 2018 (%)
Figure 134: Company 2 Nitrogenous Fertilizer Market Net Revenue, By Years, 2018-2019* ($)
Figure 135: Company 2 Nitrogenous Fertilizer Market Net Revenue Share, By Business segments, 2018 (%)
Figure 136: Company 2 Nitrogenous Fertilizer Market Net Sales Share, By Geography, 2018 (%)
Figure 137: Company 3 Nitrogenous Fertilizer Market Net Revenue, By Years, 2018-2019* ($)
Figure 138: Company 3 Nitrogenous Fertilizer Market Net Revenue Share, By Business segments, 2018 (%)
Figure 139: Company 3 Nitrogenous Fertilizer Market Net Sales Share, By Geography, 2018 (%)
Figure 140: Company 4 Nitrogenous Fertilizer Market Net Revenue, By Years, 2018-2019* ($)
Figure 141: Company 4 Nitrogenous Fertilizer Market Net Revenue Share, By Business segments, 2018 (%)
Figure 142: Company 4 Nitrogenous Fertilizer Market Net Sales Share, By Geography, 2018 (%)
Figure 143: Company 5 Nitrogenous Fertilizer Market Net Revenue, By Years, 2018-2019* ($)
Figure 144: Company 5 Nitrogenous Fertilizer Market Net Revenue Share, By Business segments, 2018 (%)
Figure 145: Company 5 Nitrogenous Fertilizer Market Net Sales Share, By Geography, 2018 (%)
Figure 146: Company 6 Nitrogenous Fertilizer Market Net Revenue, By Years, 2018-2019* ($)
Figure 147: Company 6 Nitrogenous Fertilizer Market Net Revenue Share, By Business segments, 2018 (%)
Figure 148: Company 6 Nitrogenous Fertilizer Market Net Sales Share, By Geography, 2018 (%)
Figure 149: Company 7 Nitrogenous Fertilizer Market Net Revenue, By Years, 2018-2019* ($)
Figure 150: Company 7 Nitrogenous Fertilizer Market Net Revenue Share, By Business segments, 2018 (%)
Figure 151: Company 7 Nitrogenous Fertilizer Market Net Sales Share, By Geography, 2018 (%)
Figure 152: Company 8 Nitrogenous Fertilizer Market Net Revenue, By Years, 2018-2019* ($)
Figure 153: Company 8 Nitrogenous Fertilizer Market Net Revenue Share, By Business segments, 2018 (%)
Figure 154: Company 8 Nitrogenous Fertilizer Market Net Sales Share, By Geography, 2018 (%)
Figure 155: Company 9 Nitrogenous Fertilizer Market Net Revenue, By Years, 2018-2019* ($)
Figure 156: Company 9 Nitrogenous Fertilizer Market Net Revenue Share, By Business segments, 2018 (%)
Figure 157: Company 9 Nitrogenous Fertilizer Market Net Sales Share, By Geography, 2018 (%)
Figure 158: Company 10 Nitrogenous Fertilizer Market Net Revenue, By Years, 2018-2019* ($)
Figure 159: Company 10 Nitrogenous Fertilizer Market Net Revenue Share, By Business segments, 2018 (%)
Figure 160: Company 10 Nitrogenous Fertilizer Market Net Sales Share, By Geography, 2018 (%)
Figure 161: Company 11 Nitrogenous Fertilizer Market Net Revenue, By Years, 2018-2019* ($)
Figure 162: Company 11 Nitrogenous Fertilizer Market Net Revenue Share, By Business segments, 2018 (%)
Figure 163: Company 11 Nitrogenous Fertilizer Market Net Sales Share, By Geography, 2018 (%)
Figure 164: Company 12 Nitrogenous Fertilizer Market Net Revenue, By Years, 2018-2019* ($)
Figure 165: Company 12 Nitrogenous Fertilizer Market Net Revenue Share, By Business segments, 2018 (%)
Figure 166: Company 12 Nitrogenous Fertilizer Market Net Sales Share, By Geography, 2018 (%)
Figure 167: Company 13 Nitrogenous Fertilizer Market Net Revenue, By Years, 2018-2019* ($)
Figure 168: Company 13 Nitrogenous Fertilizer Market Net Revenue Share, By Business segments, 2018 (%)
Figure 169: Company 13 Nitrogenous Fertilizer Market Net Sales Share, By Geography, 2018 (%)
Figure 170: Company 14 Nitrogenous Fertilizer Market Net Revenue, By Years, 2018-2019* ($)
Figure 171: Company 14 Nitrogenous Fertilizer Market Net Revenue Share, By Business segments, 2018 (%)
Figure 172: Company 14 Nitrogenous Fertilizer Market Net Sales Share, By Geography, 2018 (%)
Figure 173: Company 15 Nitrogenous Fertilizer Market Net Revenue, By Years, 2018-2019* ($)
Figure 174: Company 15 Nitrogenous Fertilizer Market Net Revenue Share, By Business segments, 2018 (%)
Figure 175: Company 15 Nitrogenous Fertilizer Market Net Sales Share, By Geography, 2018 (%)