 Email
Email Print
Print


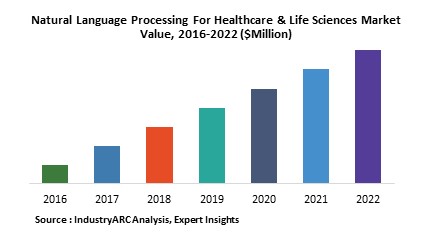
Natural Language Processing For Healthcare & Life Sciences Market - Forecast(2024 - 2030)
The emergence of Internet of Things (IoT) and the need to maintain the large amount of unstructured clinical data which is available in the form of Electronic Health Records (EHR). The technologies used in NLP for healthcare and life science market is segmented based on speech, text and image patterns
What is Natural Language Processing
NPL is the ability of a computer program that understands the human language as it is spoken. Natural Language Processing (NLP) is a sub segment of Artificial Intelligence (AI). NLP basically works as a bridge between machines and human. NLP is being developed to create readable text and also to translate it into different human languages
What are the uses of Natural Language Processing ?
NLP basically works as a bridge between machines and human. The NLP technologies can effectively analyze large amount of clinical data. NLP helps in keeping away unwanted spams from your Emails. In healthcare the use NLP will help in segregating the unstructured data
Market Research and Market Trends of Natural Language Processing For Healthcare & Life Science Market:
- Suki is an AI enabled healthcare startup. The company has raised a funding of $15 million and the funding was supported by Venrock. It also included other investors such as First Round Capital, Social Capital. The company will use this funds to grow its virtual assistant that will help doctors in logging events and record EHR data using natural language processing.
- The use of Artificial Intelligence in NLP will help healthcare in retrieving relevant information from reputable sources in real time. The NLP capabilities can be used to create a virtual healthcare assistant. This virtual assistant will under conversations using natural language understanding models that are enabled with medical vocabulary.
Who are the Major Players in Adaptive Security Software Market?
The companies referred in the market research report are Suki, Linguamatics, NarrativeDX and others
What is our report scope?
The report incorporates in-depth assessment of the competitive landscape, product market sizing, product benchmarking, market trends, product developments, financial analysis, strategic analysis and so on to gauge the impact forces and potential opportunities of the market. Apart from this the report also includes a study of major developments in the market such as product launches, agreements, acquisitions, collaborations, mergers and so on to comprehend the prevailing market dynamics at present and its impact during the forecast period 2018-2023.
All our reports are customizable to your company needs to a certain extent, we do provide 20 free consulting hours along with purchase of each report, and this will allow you to request any additional data to customize the report to your needs.
Key Takeaways from this Report
- Evaluate market potential through analyzing growth rates (CAGR %), Volume (Units) and Value ($M) data given at country level – for product types, end use applications and by different industry verticals.
- Understand the different dynamics influencing the market – key driving factors, challenges and hidden opportunities.
- Get in-depth insights on your competitor performance – market shares, strategies, financial benchmarking, product benchmarking, SWOT and more.
- Analyze the sales and distribution channels across key geographies to improve top-line revenues.
- Understand the industry supply chain with a deep-dive on the value augmentation at each step, in order to optimize value and bring efficiencies in your processes.
- Get a quick outlook on the market entropy – M&A’s, deals, partnerships, product launches of all key players for the past 4 years.
- Evaluate the supply-demand gaps, import-export statistics and regulatory landscape for more than top 20 countries globally for the market.
1. Natural Language Processing For Healthcare & Life Sciences Market - Overview
1.1. Definitions and Scope
2. Natural Language Processing For Healthcare & Life Sciences Market - Executive summary
2.1. Market Revenue, Market Size and Key Trends by Company
2.2. Key Trends by type of Application
2.3. Key Trends segmented by Geography
3. Natural Language Processing For Healthcare & Life Sciences Market
3.1. Comparative analysis
3.1.1. Product Benchmarking - Top 10 companies
3.1.2. Top 5 Financials Analysis
3.1.3. Market Value split by Top 10 companies
3.1.4. Patent Analysis - Top 10 companies
3.1.5. Pricing Analysis
4. Natural Language Processing For Healthcare & Life Sciences Market – Startup companies Scenario Premium
4.1. Top 10 startup company Analysis by
4.1.1. Investment
4.1.2. Revenue
4.1.3. Market Shares
4.1.4. Market Size and Application Analysis
4.1.5. Venture Capital and Funding Scenario
5. Natural Language Processing For Healthcare & Life Sciences Market – Industry Market Entry Scenario Premium
5.1. Regulatory Framework Overview
5.2. New Business and Ease of Doing business index
5.3. Case studies of successful ventures
5.4. Customer Analysis – Top 10 companies
6. Natural Language Processing For Healthcare & Life Sciences Market Forces
6.1. Drivers
6.2. Constraints
6.3. Challenges
6.4. Porters five force model
6.4.1. Bargaining power of suppliers
6.4.2. Bargaining powers of customers
6.4.3. Threat of new entrants
6.4.4. Rivalry among existing players
6.4.5. Threat of substitutes
7. Natural Language Processing For Healthcare & Life Sciences Market -Strategic analysis
7.1. Value chain analysis
7.2. Opportunities analysis
7.3. Product life cycle
7.4. Suppliers and distributors Market Share
8. Natural Language Processing For Healthcare & Life Sciences Market – By Types (Market Size -$Million / $Billion)
8.1. Market Size and Market Share Analysis
8.2. Application Revenue and Trend Research
8.3. Product Segment Analysis
8.3.1. Rule-based
8.3.2. Statistical
8.3.3. Hybrids
8.3.4. Learned
9. Natural Language Processing For Healthcare & Life Sciences Market – By Deployment (Market Size -$Million / $Billion)
9.1. On-premises
9.2. Cloud
10. Natural Language Processing For Healthcare & Life Sciences Market – By Service type (Market Size -$Million / $Billion)
10.1. Managed Services
10.2. Professional Service
11. Natural Language Processing For Healthcare & Life Sciences Market – By Technology (Market Size -$Million / $Billion)
11.1. Speech Recognition
11.2. Cognitive Analytics
11.3. Text Mining
11.4. Advanced Text Analytics
11.5. Imaging Analytics
11.6. Others
12. Natural Language Processing For Healthcare & Life Sciences Market – By Solutions (Market Size -$Million / $Billion)
12.1. Clinical Variation Management
12.2. Denials
12.3. Population Health Management
12.4. Counter Fraud Management
12.5. Risk Adjustment
12.6. Others
13. Natural Language Processing For Healthcare & Life Sciences - By Geography (Market Size -$Million / $Billion)
13.1. Natural Language Processing For Healthcare & Life Sciences Market - North America Segment Research
13.2. North America Market Research (Million / $Billion)
13.2.1. Segment type Size and Market Size Analysis
13.2.2. Revenue and Trends
13.2.3. Application Revenue and Trends by type of Application
13.2.4. Company Revenue and Product Analysis
13.2.5. North America Product type and Application Market Size
13.2.5.1. U.S.
13.2.5.2. Canada
13.2.5.3. Mexico
13.2.5.4. Rest of North America
13.3. Natural Language Processing For Healthcare & Life Sciences - South America Segment Research
13.4. South America Market Research (Market Size -$Million / $Billion)
13.4.1. Segment type Size and Market Size Analysis
13.4.2. Revenue and Trends
13.4.3. Application Revenue and Trends by type of Application
13.4.4. Company Revenue and Product Analysis
13.4.5. South America Product type and Application Market Size
13.4.5.1. Brazil
13.4.5.2. Venezuela
13.4.5.3. Argentina
13.4.5.4. Ecuador
13.4.5.5. Peru
13.4.5.6. Colombia
13.4.5.7. Costa Rica
13.4.5.8. Rest of South America
13.5. Natural Language Processing For Healthcare & Life Sciences - Europe Segment Research
13.6. Europe Market Research (Market Size -$Million / $Billion)
13.6.1. Segment type Size and Market Size Analysis
13.6.2. Revenue and Trends
13.6.3. Application Revenue and Trends by type of Application
13.6.4. Company Revenue and Product Analysis
13.6.5. Europe Segment Product type and Application Market Size
13.6.5.1. U.K
13.6.5.2. Germany
13.6.5.3. Italy
13.6.5.4. France
13.6.5.5. Netherlands
13.6.5.6. Belgium
13.6.5.7. Spain
13.6.5.8. Denmark
13.6.5.9. Rest of Europe
13.7. Natural Language Processing For Healthcare & Life Sciences – APAC Segment Research
13.8. APAC Market Research (Market Size -$Million / $Billion)
13.8.1. Segment type Size and Market Size Analysis
13.8.2. Revenue and Trends
13.8.3. Application Revenue and Trends by type of Application
13.8.4. Company Revenue and Product Analysis
13.8.5. APAC Segment – Product type and Application Market Size
13.8.5.1. China
13.8.5.2. Australia
13.8.5.3. Japan
13.8.5.4. South Korea
13.8.5.5. India
13.8.5.6. Taiwan
13.8.5.7. Malaysia
14. Natural Language Processing For Healthcare & Life Sciences Market - Entropy
14.1. New product launches
14.2. M&A's, collaborations, JVs and partnerships
15. Natural Language Processing For Healthcare & Life Sciences Market – Industry / Segment Competition landscape Premium
15.1. Market Share Analysis
15.1.1. Market Share by Country- Top companies
15.1.2. Market Share by Region- Top 10 companies
15.1.3. Market Share by type of Application – Top 10 companies
15.1.4. Market Share by type of Product / Product category- Top 10 companies
15.1.5. Market Share at global level- Top 10 companies
15.1.6. Best Practises for companies
16. Natural Language Processing For Healthcare & Life Sciences Market – Key Company List by Country Premium
17. Natural Language Processing For Healthcare & Life Sciences Market Company Analysis
17.1. Market Share, Company Revenue, Products, M&A, Developments
17.2. Suki
17.3. Linguamatics
17.4. NarrativeDX
17.5. Company 4
17.6. Company 5
17.7. Company 6
17.8. Company 7
17.9. Company 8
17.10. Company 9
17.11. Company 10 and more
"*Financials would be provided on a best efforts basis for private companies"
18. Natural Language Processing For Healthcare & Life Sciences Market -Appendix
18.1. Abbreviations
18.2. Sources
19. Natural Language Processing For Healthcare & Life Sciences Market -Methodology Premium
19.1. Research Methodology
19.1.1. Company Expert Interviews
19.1.2. Industry Databases
19.1.3. Associations
19.1.4. Company News
19.1.5. Company Annual Reports
19.1.6. Application Trends
19.1.7. New Products and Product database
19.1.8. Company Transcripts
19.1.9. R&D Trends
19.1.10. Key Opinion Leaders Interviews
19.1.11. Supply and Demand Trends
List of Tables:
Table 1: Natural Language Processing For Healthcare & Life Sciences Market Overview 2021-2026
Table 2: Natural Language Processing For Healthcare & Life Sciences Market Leader Analysis 2018-2019 (US$)
Table 3: Natural Language Processing For Healthcare & Life Sciences Market Product Analysis 2018-2019 (US$)
Table 4: Natural Language Processing For Healthcare & Life Sciences Market End User Analysis 2018-2019 (US$)
Table 5: Natural Language Processing For Healthcare & Life Sciences Market Patent Analysis 2013-2018* (US$)
Table 6: Natural Language Processing For Healthcare & Life Sciences Market Financial Analysis 2018-2019 (US$)
Table 7: Natural Language Processing For Healthcare & Life Sciences Market Driver Analysis 2018-2019 (US$)
Table 8: Natural Language Processing For Healthcare & Life Sciences Market Challenges Analysis 2018-2019 (US$)
Table 9: Natural Language Processing For Healthcare & Life Sciences Market Constraint Analysis 2018-2019 (US$)
Table 10: Natural Language Processing For Healthcare & Life Sciences Market Supplier Bargaining Power Analysis 2018-2019 (US$)
Table 11: Natural Language Processing For Healthcare & Life Sciences Market Buyer Bargaining Power Analysis 2018-2019 (US$)
Table 12: Natural Language Processing For Healthcare & Life Sciences Market Threat of Substitutes Analysis 2018-2019 (US$)
Table 13: Natural Language Processing For Healthcare & Life Sciences Market Threat of New Entrants Analysis 2018-2019 (US$)
Table 14: Natural Language Processing For Healthcare & Life Sciences Market Degree of Competition Analysis 2018-2019 (US$)
Table 15: Natural Language Processing For Healthcare & Life Sciences Market Value Chain Analysis 2018-2019 (US$)
Table 16: Natural Language Processing For Healthcare & Life Sciences Market Pricing Analysis 2021-2026 (US$)
Table 17: Natural Language Processing For Healthcare & Life Sciences Market Opportunities Analysis 2021-2026 (US$)
Table 18: Natural Language Processing For Healthcare & Life Sciences Market Product Life Cycle Analysis 2021-2026 (US$)
Table 19: Natural Language Processing For Healthcare & Life Sciences Market Supplier Analysis 2018-2019 (US$)
Table 20: Natural Language Processing For Healthcare & Life Sciences Market Distributor Analysis 2018-2019 (US$)
Table 21: Natural Language Processing For Healthcare & Life Sciences Market Trend Analysis 2018-2019 (US$)
Table 22: Natural Language Processing For Healthcare & Life Sciences Market Size 2018 (US$)
Table 23: Natural Language Processing For Healthcare & Life Sciences Market Forecast Analysis 2021-2026 (US$)
Table 24: Natural Language Processing For Healthcare & Life Sciences Market Sales Forecast Analysis 2021-2026 (Units)
Table 25: Natural Language Processing For Healthcare & Life Sciences Market, Revenue & Volume, By Type, 2021-2026 ($)
Table 26: Natural Language Processing For Healthcare & Life Sciences Market By Type, Revenue & Volume, By Rule-Based, 2021-2026 ($)
Table 27: Natural Language Processing For Healthcare & Life Sciences Market By Type, Revenue & Volume, By Statistical, 2021-2026 ($)
Table 28: Natural Language Processing For Healthcare & Life Sciences Market By Type, Revenue & Volume, By Hybrid, 2021-2026 ($)
Table 29: Natural Language Processing For Healthcare & Life Sciences Market, Revenue & Volume, By Deployment, 2021-2026 ($)
Table 30: Natural Language Processing For Healthcare & Life Sciences Market By Deployment, Revenue & Volume, By On Premise, 2021-2026 ($)
Table 31: Natural Language Processing For Healthcare & Life Sciences Market By Deployment, Revenue & Volume, By On Demand, 2021-2026 ($)
Table 32: Natural Language Processing For Healthcare & Life Sciences Market, Revenue & Volume, By Technology, 2021-2026 ($)
Table 33: Natural Language Processing For Healthcare & Life Sciences Market By Technology, Revenue & Volume, By IVR, 2021-2026 ($)
Table 34: Natural Language Processing For Healthcare & Life Sciences Market By Technology, Revenue & Volume, By OCR, 2021-2026 ($)
Table 35: Natural Language Processing For Healthcare & Life Sciences Market By Technology, Revenue & Volume, By Speech Recognition, 2021-2026 ($)
Table 36: Natural Language Processing For Healthcare & Life Sciences Market By Technology, Revenue & Volume, By Text Processing, 2021-2026 ($)
Table 37: Natural Language Processing For Healthcare & Life Sciences Market By Technology, Revenue & Volume, By Pattern & Image Recognition, 2021-2026 ($)
Table 38: Natural Language Processing For Healthcare & Life Sciences Market, Revenue & Volume, By Application, 2021-2026 ($)
Table 39: Natural Language Processing For Healthcare & Life Sciences Market By Application, Revenue & Volume, By Predictive Risk Analytics, 2021-2026 ($)
Table 40: Natural Language Processing For Healthcare & Life Sciences Market By Application, Revenue & Volume, By Machine Translation, 2021-2026 ($)
Table 41: Natural Language Processing For Healthcare & Life Sciences Market By Application, Revenue & Volume, By Information Extraction, 2021-2026 ($)
Table 42: Natural Language Processing For Healthcare & Life Sciences Market By Application, Revenue & Volume, By Report Generation, 2021-2026 ($)
Table 43: North America Natural Language Processing For Healthcare & Life Sciences Market, Revenue & Volume, By Type, 2021-2026 ($)
Table 44: North America Natural Language Processing For Healthcare & Life Sciences Market, Revenue & Volume, By Deployment, 2021-2026 ($)
Table 45: North America Natural Language Processing For Healthcare & Life Sciences Market, Revenue & Volume, By Technology, 2021-2026 ($)
Table 46: North America Natural Language Processing For Healthcare & Life Sciences Market, Revenue & Volume, By Application, 2021-2026 ($)
Table 47: South america Natural Language Processing For Healthcare & Life Sciences Market, Revenue & Volume, By Type, 2021-2026 ($)
Table 48: South america Natural Language Processing For Healthcare & Life Sciences Market, Revenue & Volume, By Deployment, 2021-2026 ($)
Table 49: South america Natural Language Processing For Healthcare & Life Sciences Market, Revenue & Volume, By Technology, 2021-2026 ($)
Table 50: South america Natural Language Processing For Healthcare & Life Sciences Market, Revenue & Volume, By Application, 2021-2026 ($)
Table 51: Europe Natural Language Processing For Healthcare & Life Sciences Market, Revenue & Volume, By Type, 2021-2026 ($)
Table 52: Europe Natural Language Processing For Healthcare & Life Sciences Market, Revenue & Volume, By Deployment, 2021-2026 ($)
Table 53: Europe Natural Language Processing For Healthcare & Life Sciences Market, Revenue & Volume, By Technology, 2021-2026 ($)
Table 54: Europe Natural Language Processing For Healthcare & Life Sciences Market, Revenue & Volume, By Application, 2021-2026 ($)
Table 55: APAC Natural Language Processing For Healthcare & Life Sciences Market, Revenue & Volume, By Type, 2021-2026 ($)
Table 56: APAC Natural Language Processing For Healthcare & Life Sciences Market, Revenue & Volume, By Deployment, 2021-2026 ($)
Table 57: APAC Natural Language Processing For Healthcare & Life Sciences Market, Revenue & Volume, By Technology, 2021-2026 ($)
Table 58: APAC Natural Language Processing For Healthcare & Life Sciences Market, Revenue & Volume, By Application, 2021-2026 ($)
Table 59: Middle East & Africa Natural Language Processing For Healthcare & Life Sciences Market, Revenue & Volume, By Type, 2021-2026 ($)
Table 60: Middle East & Africa Natural Language Processing For Healthcare & Life Sciences Market, Revenue & Volume, By Deployment, 2021-2026 ($)
Table 61: Middle East & Africa Natural Language Processing For Healthcare & Life Sciences Market, Revenue & Volume, By Technology, 2021-2026 ($)
Table 62: Middle East & Africa Natural Language Processing For Healthcare & Life Sciences Market, Revenue & Volume, By Application, 2021-2026 ($)
Table 63: Russia Natural Language Processing For Healthcare & Life Sciences Market, Revenue & Volume, By Type, 2021-2026 ($)
Table 64: Russia Natural Language Processing For Healthcare & Life Sciences Market, Revenue & Volume, By Deployment, 2021-2026 ($)
Table 65: Russia Natural Language Processing For Healthcare & Life Sciences Market, Revenue & Volume, By Technology, 2021-2026 ($)
Table 66: Russia Natural Language Processing For Healthcare & Life Sciences Market, Revenue & Volume, By Application, 2021-2026 ($)
Table 67: Israel Natural Language Processing For Healthcare & Life Sciences Market, Revenue & Volume, By Type, 2021-2026 ($)
Table 68: Israel Natural Language Processing For Healthcare & Life Sciences Market, Revenue & Volume, By Deployment, 2021-2026 ($)
Table 69: Israel Natural Language Processing For Healthcare & Life Sciences Market, Revenue & Volume, By Technology, 2021-2026 ($)
Table 70: Israel Natural Language Processing For Healthcare & Life Sciences Market, Revenue & Volume, By Application, 2021-2026 ($)
Table 71: Top Companies 2018 (US$) Natural Language Processing For Healthcare & Life Sciences Market, Revenue & Volume
Table 72: Product Launch 2018-2019 Natural Language Processing For Healthcare & Life Sciences Market, Revenue & Volume
Table 73: Mergers & Acquistions 2018-2019 Natural Language Processing For Healthcare & Life Sciences Market, Revenue & Volume
List of Figures:
Figure 1: Overview of Natural Language Processing For Healthcare & Life Sciences Market 2021-2026
Figure 2: Market Share Analysis for Natural Language Processing For Healthcare & Life Sciences Market 2018 (US$)
Figure 3: Product Comparison in Natural Language Processing For Healthcare & Life Sciences Market 2018-2019 (US$)
Figure 4: End User Profile for Natural Language Processing For Healthcare & Life Sciences Market 2018-2019 (US$)
Figure 5: Patent Application and Grant in Natural Language Processing For Healthcare & Life Sciences Market 2013-2018* (US$)
Figure 6: Top 5 Companies Financial Analysis in Natural Language Processing For Healthcare & Life Sciences Market 2018-2019 (US$)
Figure 7: Market Entry Strategy in Natural Language Processing For Healthcare & Life Sciences Market 2018-2019
Figure 8: Ecosystem Analysis in Natural Language Processing For Healthcare & Life Sciences Market 2018
Figure 9: Average Selling Price in Natural Language Processing For Healthcare & Life Sciences Market 2021-2026
Figure 10: Top Opportunites in Natural Language Processing For Healthcare & Life Sciences Market 2018-2019
Figure 11: Market Life Cycle Analysis in Natural Language Processing For Healthcare & Life Sciences Market
Figure 12: GlobalBy Type Natural Language Processing For Healthcare & Life Sciences Market Revenue, 2021-2026 ($)
Figure 13: GlobalBy Deployment Natural Language Processing For Healthcare & Life Sciences Market Revenue, 2021-2026 ($)
Figure 14: GlobalBy Technology Natural Language Processing For Healthcare & Life Sciences Market Revenue, 2021-2026 ($)
Figure 15: GlobalBy Application Natural Language Processing For Healthcare & Life Sciences Market Revenue, 2021-2026 ($)
Figure 16: Global Natural Language Processing For Healthcare & Life Sciences Market - By Geography
Figure 17: Global Natural Language Processing For Healthcare & Life Sciences Market Value & Volume, By Geography, 2021-2026 ($)
Figure 18: Global Natural Language Processing For Healthcare & Life Sciences Market CAGR, By Geography, 2021-2026 (%)
Figure 19: North America Natural Language Processing For Healthcare & Life Sciences Market Value & Volume, 2021-2026 ($)
Figure 20: US Natural Language Processing For Healthcare & Life Sciences Market Value & Volume, 2021-2026 ($)
Figure 21: US GDP and Population, 2018-2019 ($)
Figure 22: US GDP – Composition of 2018, By Sector of Origin
Figure 23: US Export and Import Value & Volume, 2018-2019 ($)
Figure 24: Canada Natural Language Processing For Healthcare & Life Sciences Market Value & Volume, 2021-2026 ($)
Figure 25: Canada GDP and Population, 2018-2019 ($)
Figure 26: Canada GDP – Composition of 2018, By Sector of Origin
Figure 27: Canada Export and Import Value & Volume, 2018-2019 ($)
Figure 28: Mexico Natural Language Processing For Healthcare & Life Sciences Market Value & Volume, 2021-2026 ($)
Figure 29: Mexico GDP and Population, 2018-2019 ($)
Figure 30: Mexico GDP – Composition of 2018, By Sector of Origin
Figure 31: Mexico Export and Import Value & Volume, 2018-2019 ($)
Figure 32: South America Natural Language Processing For Healthcare & Life Sciences Market Value & Volume, 2021-2026 ($)
Figure 33: Brazil Natural Language Processing For Healthcare & Life Sciences Market Value & Volume, 2021-2026 ($)
Figure 34: Brazil GDP and Population, 2018-2019 ($)
Figure 35: Brazil GDP – Composition of 2018, By Sector of Origin
Figure 36: Brazil Export and Import Value & Volume, 2018-2019 ($)
Figure 37: Venezuela Natural Language Processing For Healthcare & Life Sciences Market Value & Volume, 2021-2026 ($)
Figure 38: Venezuela GDP and Population, 2018-2019 ($)
Figure 39: Venezuela GDP – Composition of 2018, By Sector of Origin
Figure 40: Venezuela Export and Import Value & Volume, 2018-2019 ($)
Figure 41: Argentina Natural Language Processing For Healthcare & Life Sciences Market Value & Volume, 2021-2026 ($)
Figure 42: Argentina GDP and Population, 2018-2019 ($)
Figure 43: Argentina GDP – Composition of 2018, By Sector of Origin
Figure 44: Argentina Export and Import Value & Volume, 2018-2019 ($)
Figure 45: Ecuador Natural Language Processing For Healthcare & Life Sciences Market Value & Volume, 2021-2026 ($)
Figure 46: Ecuador GDP and Population, 2018-2019 ($)
Figure 47: Ecuador GDP – Composition of 2018, By Sector of Origin
Figure 48: Ecuador Export and Import Value & Volume, 2018-2019 ($)
Figure 49: Peru Natural Language Processing For Healthcare & Life Sciences Market Value & Volume, 2021-2026 ($)
Figure 50: Peru GDP and Population, 2018-2019 ($)
Figure 51: Peru GDP – Composition of 2018, By Sector of Origin
Figure 52: Peru Export and Import Value & Volume, 2018-2019 ($)
Figure 53: Colombia Natural Language Processing For Healthcare & Life Sciences Market Value & Volume, 2021-2026 ($)
Figure 54: Colombia GDP and Population, 2018-2019 ($)
Figure 55: Colombia GDP – Composition of 2018, By Sector of Origin
Figure 56: Colombia Export and Import Value & Volume, 2018-2019 ($)
Figure 57: Costa Rica Natural Language Processing For Healthcare & Life Sciences Market Value & Volume, 2021-2026 ($)
Figure 58: Costa Rica GDP and Population, 2018-2019 ($)
Figure 59: Costa Rica GDP – Composition of 2018, By Sector of Origin
Figure 60: Costa Rica Export and Import Value & Volume, 2018-2019 ($)
Figure 61: Europe Natural Language Processing For Healthcare & Life Sciences Market Value & Volume, 2021-2026 ($)
Figure 62: U.K Natural Language Processing For Healthcare & Life Sciences Market Value & Volume, 2021-2026 ($)
Figure 63: U.K GDP and Population, 2018-2019 ($)
Figure 64: U.K GDP – Composition of 2018, By Sector of Origin
Figure 65: U.K Export and Import Value & Volume, 2018-2019 ($)
Figure 66: Germany Natural Language Processing For Healthcare & Life Sciences Market Value & Volume, 2021-2026 ($)
Figure 67: Germany GDP and Population, 2018-2019 ($)
Figure 68: Germany GDP – Composition of 2018, By Sector of Origin
Figure 69: Germany Export and Import Value & Volume, 2018-2019 ($)
Figure 70: Italy Natural Language Processing For Healthcare & Life Sciences Market Value & Volume, 2021-2026 ($)
Figure 71: Italy GDP and Population, 2018-2019 ($)
Figure 72: Italy GDP – Composition of 2018, By Sector of Origin
Figure 73: Italy Export and Import Value & Volume, 2018-2019 ($)
Figure 74: France Natural Language Processing For Healthcare & Life Sciences Market Value & Volume, 2021-2026 ($)
Figure 75: France GDP and Population, 2018-2019 ($)
Figure 76: France GDP – Composition of 2018, By Sector of Origin
Figure 77: France Export and Import Value & Volume, 2018-2019 ($)
Figure 78: Netherlands Natural Language Processing For Healthcare & Life Sciences Market Value & Volume, 2021-2026 ($)
Figure 79: Netherlands GDP and Population, 2018-2019 ($)
Figure 80: Netherlands GDP – Composition of 2018, By Sector of Origin
Figure 81: Netherlands Export and Import Value & Volume, 2018-2019 ($)
Figure 82: Belgium Natural Language Processing For Healthcare & Life Sciences Market Value & Volume, 2021-2026 ($)
Figure 83: Belgium GDP and Population, 2018-2019 ($)
Figure 84: Belgium GDP – Composition of 2018, By Sector of Origin
Figure 85: Belgium Export and Import Value & Volume, 2018-2019 ($)
Figure 86: Spain Natural Language Processing For Healthcare & Life Sciences Market Value & Volume, 2021-2026 ($)
Figure 87: Spain GDP and Population, 2018-2019 ($)
Figure 88: Spain GDP – Composition of 2018, By Sector of Origin
Figure 89: Spain Export and Import Value & Volume, 2018-2019 ($)
Figure 90: Denmark Natural Language Processing For Healthcare & Life Sciences Market Value & Volume, 2021-2026 ($)
Figure 91: Denmark GDP and Population, 2018-2019 ($)
Figure 92: Denmark GDP – Composition of 2018, By Sector of Origin
Figure 93: Denmark Export and Import Value & Volume, 2018-2019 ($)
Figure 94: APAC Natural Language Processing For Healthcare & Life Sciences Market Value & Volume, 2021-2026 ($)
Figure 95: China Natural Language Processing For Healthcare & Life Sciences Market Value & Volume, 2021-2026
Figure 96: China GDP and Population, 2018-2019 ($)
Figure 97: China GDP – Composition of 2018, By Sector of Origin
Figure 98: China Export and Import Value & Volume, 2018-2019 ($) Natural Language Processing For Healthcare & Life Sciences Market China Export and Import Value & Volume, 2018-2019 ($)
Figure 99: Australia Natural Language Processing For Healthcare & Life Sciences Market Value & Volume, 2021-2026 ($)
Figure 100: Australia GDP and Population, 2018-2019 ($)
Figure 101: Australia GDP – Composition of 2018, By Sector of Origin
Figure 102: Australia Export and Import Value & Volume, 2018-2019 ($)
Figure 103: South Korea Natural Language Processing For Healthcare & Life Sciences Market Value & Volume, 2021-2026 ($)
Figure 104: South Korea GDP and Population, 2018-2019 ($)
Figure 105: South Korea GDP – Composition of 2018, By Sector of Origin
Figure 106: South Korea Export and Import Value & Volume, 2018-2019 ($)
Figure 107: India Natural Language Processing For Healthcare & Life Sciences Market Value & Volume, 2021-2026 ($)
Figure 108: India GDP and Population, 2018-2019 ($)
Figure 109: India GDP – Composition of 2018, By Sector of Origin
Figure 110: India Export and Import Value & Volume, 2018-2019 ($)
Figure 111: Taiwan Natural Language Processing For Healthcare & Life Sciences Market Value & Volume, 2021-2026 ($)
Figure 112: Taiwan GDP and Population, 2018-2019 ($)
Figure 113: Taiwan GDP – Composition of 2018, By Sector of Origin
Figure 114: Taiwan Export and Import Value & Volume, 2018-2019 ($)
Figure 115: Malaysia Natural Language Processing For Healthcare & Life Sciences Market Value & Volume, 2021-2026 ($)
Figure 116: Malaysia GDP and Population, 2018-2019 ($)
Figure 117: Malaysia GDP – Composition of 2018, By Sector of Origin
Figure 118: Malaysia Export and Import Value & Volume, 2018-2019 ($)
Figure 119: Hong Kong Natural Language Processing For Healthcare & Life Sciences Market Value & Volume, 2021-2026 ($)
Figure 120: Hong Kong GDP and Population, 2018-2019 ($)
Figure 121: Hong Kong GDP – Composition of 2018, By Sector of Origin
Figure 122: Hong Kong Export and Import Value & Volume, 2018-2019 ($)
Figure 123: Middle East & Africa Natural Language Processing For Healthcare & Life Sciences Market Middle East & Africa 3D Printing Market Value & Volume, 2021-2026 ($)
Figure 124: Russia Natural Language Processing For Healthcare & Life Sciences Market Value & Volume, 2021-2026 ($)
Figure 125: Russia GDP and Population, 2018-2019 ($)
Figure 126: Russia GDP – Composition of 2018, By Sector of Origin
Figure 127: Russia Export and Import Value & Volume, 2018-2019 ($)
Figure 128: Israel Natural Language Processing For Healthcare & Life Sciences Market Value & Volume, 2021-2026 ($)
Figure 129: Israel GDP and Population, 2018-2019 ($)
Figure 130: Israel GDP – Composition of 2018, By Sector of Origin
Figure 131: Israel Export and Import Value & Volume, 2018-2019 ($)
Figure 132: Entropy Share, By Strategies, 2018-2019* (%) Natural Language Processing For Healthcare & Life Sciences Market
Figure 133: Developments, 2018-2019* Natural Language Processing For Healthcare & Life Sciences Market
Figure 134: Company 1 Natural Language Processing For Healthcare & Life Sciences Market Net Revenue, By Years, 2018-2019* ($)
Figure 135: Company 1 Natural Language Processing For Healthcare & Life Sciences Market Net Revenue Share, By Business segments, 2018 (%)
Figure 136: Company 1 Natural Language Processing For Healthcare & Life Sciences Market Net Sales Share, By Geography, 2018 (%)
Figure 137: Company 2 Natural Language Processing For Healthcare & Life Sciences Market Net Revenue, By Years, 2018-2019* ($)
Figure 138: Company 2 Natural Language Processing For Healthcare & Life Sciences Market Net Revenue Share, By Business segments, 2018 (%)
Figure 139: Company 2 Natural Language Processing For Healthcare & Life Sciences Market Net Sales Share, By Geography, 2018 (%)
Figure 140: Company 3 Natural Language Processing For Healthcare & Life Sciences Market Net Revenue, By Years, 2018-2019* ($)
Figure 141: Company 3 Natural Language Processing For Healthcare & Life Sciences Market Net Revenue Share, By Business segments, 2018 (%)
Figure 142: Company 3 Natural Language Processing For Healthcare & Life Sciences Market Net Sales Share, By Geography, 2018 (%)
Figure 143: Company 4 Natural Language Processing For Healthcare & Life Sciences Market Net Revenue, By Years, 2018-2019* ($)
Figure 144: Company 4 Natural Language Processing For Healthcare & Life Sciences Market Net Revenue Share, By Business segments, 2018 (%)
Figure 145: Company 4 Natural Language Processing For Healthcare & Life Sciences Market Net Sales Share, By Geography, 2018 (%)
Figure 146: Company 5 Natural Language Processing For Healthcare & Life Sciences Market Net Revenue, By Years, 2018-2019* ($)
Figure 147: Company 5 Natural Language Processing For Healthcare & Life Sciences Market Net Revenue Share, By Business segments, 2018 (%)
Figure 148: Company 5 Natural Language Processing For Healthcare & Life Sciences Market Net Sales Share, By Geography, 2018 (%)
Figure 149: Company 6 Natural Language Processing For Healthcare & Life Sciences Market Net Revenue, By Years, 2018-2019* ($)
Figure 150: Company 6 Natural Language Processing For Healthcare & Life Sciences Market Net Revenue Share, By Business segments, 2018 (%)
Figure 151: Company 6 Natural Language Processing For Healthcare & Life Sciences Market Net Sales Share, By Geography, 2018 (%)
Figure 152: Company 7 Natural Language Processing For Healthcare & Life Sciences Market Net Revenue, By Years, 2018-2019* ($)
Figure 153: Company 7 Natural Language Processing For Healthcare & Life Sciences Market Net Revenue Share, By Business segments, 2018 (%)
Figure 154: Company 7 Natural Language Processing For Healthcare & Life Sciences Market Net Sales Share, By Geography, 2018 (%)
Figure 155: Company 8 Natural Language Processing For Healthcare & Life Sciences Market Net Revenue, By Years, 2018-2019* ($)
Figure 156: Company 8 Natural Language Processing For Healthcare & Life Sciences Market Net Revenue Share, By Business segments, 2018 (%)
Figure 157: Company 8 Natural Language Processing For Healthcare & Life Sciences Market Net Sales Share, By Geography, 2018 (%)
Figure 158: Company 9 Natural Language Processing For Healthcare & Life Sciences Market Net Revenue, By Years, 2018-2019* ($)
Figure 159: Company 9 Natural Language Processing For Healthcare & Life Sciences Market Net Revenue Share, By Business segments, 2018 (%)
Figure 160: Company 9 Natural Language Processing For Healthcare & Life Sciences Market Net Sales Share, By Geography, 2018 (%)
Figure 161: Company 10 Natural Language Processing For Healthcare & Life Sciences Market Net Revenue, By Years, 2018-2019* ($)
Figure 162: Company 10 Natural Language Processing For Healthcare & Life Sciences Market Net Revenue Share, By Business segments, 2018 (%)
Figure 163: Company 10 Natural Language Processing For Healthcare & Life Sciences Market Net Sales Share, By Geography, 2018 (%)
Figure 164: Company 11 Natural Language Processing For Healthcare & Life Sciences Market Net Revenue, By Years, 2018-2019* ($)
Figure 165: Company 11 Natural Language Processing For Healthcare & Life Sciences Market Net Revenue Share, By Business segments, 2018 (%)
Figure 166: Company 11 Natural Language Processing For Healthcare & Life Sciences Market Net Sales Share, By Geography, 2018 (%)
Figure 167: Company 12 Natural Language Processing For Healthcare & Life Sciences Market Net Revenue, By Years, 2018-2019* ($)
Figure 168: Company 12 Natural Language Processing For Healthcare & Life Sciences Market Net Revenue Share, By Business segments, 2018 (%)
Figure 169: Company 12 Natural Language Processing For Healthcare & Life Sciences Market Net Sales Share, By Geography, 2018 (%)
Figure 170: Company 13 Natural Language Processing For Healthcare & Life Sciences Market Net Revenue, By Years, 2018-2019* ($)
Figure 171: Company 13 Natural Language Processing For Healthcare & Life Sciences Market Net Revenue Share, By Business segments, 2018 (%)
Figure 172: Company 13 Natural Language Processing For Healthcare & Life Sciences Market Net Sales Share, By Geography, 2018 (%)
Figure 173: Company 14 Natural Language Processing For Healthcare & Life Sciences Market Net Revenue, By Years, 2018-2019* ($)
Figure 174: Company 14 Natural Language Processing For Healthcare & Life Sciences Market Net Revenue Share, By Business segments, 2018 (%)
Figure 175: Company 14 Natural Language Processing For Healthcare & Life Sciences Market Net Sales Share, By Geography, 2018 (%)
Figure 176: Company 15 Natural Language Processing For Healthcare & Life Sciences Market Net Revenue, By Years, 2018-2019* ($)
Figure 177: Company 15 Natural Language Processing For Healthcare & Life Sciences Market Net Revenue Share, By Business segments, 2018 (%)
Figure 178: Company 15 Natural Language Processing For Healthcare & Life Sciences Market Net Sales Share, By Geography, 2018 (%)