 Email
Email Print
Print


Contraceptives Market Overview:
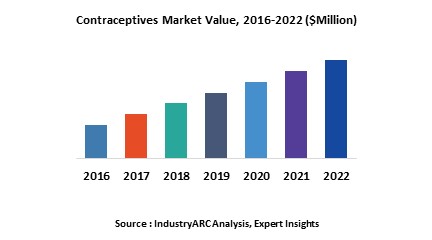
According to the Guttmacher Institute Organization, an estimated 44% of pregnancies globally were unintended and 56% of unwanted pregnancies ended in abortion at the initial phase of this decade.[1] Such peculiar cases amalgamated with increasing instances of sexually transmitted diseases (STIs) are significantly boosting the contraceptives market. As per the WHO, more than 1 million STIs are acquired every day globally, and 988,000 pregnant women were infected with syphilis (a form of STI) in 2016, resulting in over 200,000 stillbirths and newborn deaths.[2] All these factors coupled with rapidly increasing global population and governmental measures to counter population tumor are propelling contraceptives market growth. The global contraceptives market is estimated to be around $20 billion-$21 billion as of 2018. Increasing awareness among women in developed as well as rural areas of developing countries such as India and Africa regarding HIV, STIs, fertility control and birth-control is propelling this arcade to be progressing at a CAGR of 6%-7% during the forecast period of 2019-2025.
Contraceptives Market Outlook:
Contraception can be defined as the deliberate inhibition of pregnancy by interfering with the biological process of ovulation, fertilization and implantation through the use of barriers, drugs, medical devices or surgical techniques and the devices used for contraception are called as contraceptives. Contraceptives drugs or devices not only inhibit pregnancy but also sexually transmitted diseases (STDs).
In the products segment of the contraceptive market, Intrauterine Devices (IUD) secures the dominant spot and is progressing with an application CAGR of 30% - 35% going through 2025. Its supremacy above several other wide ranges of devices such as contraceptive sponges, vaginal rings, contraceptive diaphragms, subdermal implants, male condoms and female condoms can be attributed to its efficacy in prevention of unwanted pregnancies. According to the findings of the American Pregnancy Association, the intrauterine system has a failure rate of less than 1%.[3]
After an acute region-wise analysis of the global contraceptive market, North America is detected to be the dominant region. This region is responsible for nearly 28% - 30% of the global contraceptives market demand. With more than 50% of the population dominated by women, the United States is the most lucrative marketplace for contraceptives in North America. Also, United States median age is recorded to be around 37 years[4], thus indicating half of the population to be young and sexually active (below 37 years) and major consumers of contraceptives drugs and devices.
Contraceptives Market Growth Drivers and Trends:
A huge chunk of the female population in developing countries are diverting towards ideology such as women empowerment and feminism to establish educational and professional opportunities for women. An increasing number of women are delaying motherhood with the help of contraceptive devices and drugs as they prioritize their careers. Women comprised 47 percent of the total U.S. labor force at the initial phase of this decade. This is a major trend disrupting the global contraceptives market. Such assertions can meet confirmation with facts from the United States Department of Labor stating that 57% of women participate in the labor force and 26% of professionals employed computer and mathematical occupations are women.[5] Women are projected to account for 51 percent of the increase in total labor force growth between 2008 and 2018.[6]
Severe government regulations to control alarming population growth in some densely populated economies are serving as a major trend for the contraceptives market. An example can be derived from APAC, China. The family planning policy in China by the government allows only two children per couple since 2016. Enforcement requires women to have a contraceptive intrauterine device (IUD) surgically installed after having a first child, and to be sterilized by tubal ligation after having a second child. Thus nearly 667 million women in China are inevitably potential customers for the contraceptives market.
Contraceptives Market Challenges:
Lack of awareness and acceptance of contraceptives are the major factors hindering the market growth coupled with continuous and expensive necessary cycles for effective birth control. Hormonal contraceptives contain hormones such as estrogen and progestin, with side effects such as weight gain, headaches, sore breasts, irregular periods, mood changes, acne, and nausea.
Contraceptives Market Players Perspective:
Some of the major players controlling majority of the global market share are Cooper Surgical, Inc. (U.S.), Pfizer, Inc. (U.S.), Actavis, Inc. (U.S.), Teva Pharmaceutical Industries Limited (Israel), Bayer AG (Germany), The Female Health Company (U.S.), Merck & Co., Inc. (U.S.), Mayer Laboratories, Inc. (U.S.), Church & Dwight, Co., Inc. (U.S.), and Medisafe Distribution Inc. (Canada).
Teva Pharmaceutical Industries Limited is one of the leading manufacturing establishment pertaining to contraceptives. It acquired Theramex and related companies from Merck Serono. As Theramex offers a wide variety of women's health products sold in 50 countries worldwide, this merger will open up more avenues for profits and revenue.
Contraceptives Market Research Scope:
The base year of the study is 2018, with forecast done up to 2025. The study presents a thorough analysis of the competitive landscape, taking into account the market shares of the leading companies. It also provides information on unit shipments. These provide the key market participants with the necessary business intelligence and help them understand the future of the Contraceptives Market. The assessment includes the forecast, an overview of the competitive structure, the market shares of the competitors, as well as the market trends, market demands, market drivers, market challenges, and product analysis. The market drivers and restraints have been assessed to fathom their impact over the forecast period. This report further identifies the key opportunities for growth while also detailing the key challenges and possible threats. The key areas of focus include the various drugs and devices in Contraceptives Market and their specific biological uses.
Contraceptives Market Report: Industry Coverage
By Product: Drug, Devices
By End-User: Hospital, Clinic, Home Care, Ambulatory Surgical Centre
The Contraceptives Market report also analyzes the major geographic regions for the market as well as the major countries for the market in these regions. The regions and countries covered in the study include:
- North America: The U.S., Canada, Mexico
- South America: Brazil, Venezuela, Argentina, Ecuador, Peru, Colombia, Costa Rica
- Europe: The U.K., Germany, Italy, France, The Netherlands, Belgium, Spain, Denmark
- APAC: China, Japan, Australia, South Korea, India, Taiwan, Malaysia, Hong Kong
- Middle East and Africa: Israel, South Africa, Saudi Arabia
Key Questions Addressed in the Contraceptives Market Report
1. Is the market for the contraceptives growing? How long will it continue to grow and at what rate?
2. Which type of systems presents the major growth opportunities?
3. Is there a possibility for change in the market structure over time?
4. Are additional developments needed for the existing product or services offerings or do the existing products meet the customer demands?
5. Do the key vendors look for partnerships to expand their businesses with respect to geography or product?
6. What are the short-term, long-term, and medium-term growth drivers for the market?
7. What are the short-term, medium-term, and long-term challenges for the market?
8. What are the short-term, medium-term, and long-term opportunities for the market
9. Who are the top players/companies of the market?
10. What are the recent innovations in the market?
11. How many patents have been filed by the leading players?
12. What are the types of patents filed by the leading players?
13. What is our Vision 2030 for Contraceptives Market?
A few focus points of this Research are given below:
- Give a deep-dive analysis of the key operational strategies with a focus on the corporate structure, R&D strategies, localization strategies, production capabilities, and sales performance of various companies
- Provide an overview of the product portfolio, including product planning, development, and positioning
- Discuss the role of technology companies in partnerships
- Explore the regional sales activities
- Analyze the market size and giving the forecast for current and future Contraceptives Market during the forecast 2019–2025
- Analyze the competitive factors, competitors’ market shares, product capabilities, and supply chain structures.
Reference:
[1]https://www.guttmacher.org/news-release/2018/unintended-pregnancy-rates-declined-globally-1990-2014
[2]https://www.who.int/news-room/fact-sheets/detail/sexually-transmitted-infections-(stis)
[3]https://americanpregnancy.org/preventing-pregnancy/intrauterine-devices/
[4]https://countrymeters.info/en/United_States_of_America_(USA)#population_2018
[5]https://www.dol.gov/wb/stats/stats_data.htm#latest
[6]https://www.dol.gov/wb/factsheets/qf-laborforce-10.htm
1. Contraceptives Market - Overview
1.1. Definitions and Scope
2. Contraceptives Market - Executive summary
2.1. Market Revenue, Market Size and Key Trends by Company
2.2. Key Trends by type of Application
2.3. Key Trends segmented by Geography
3. Contraceptives Market
3.1. Comparative analysis
3.1.1. Product Benchmarking - Top 10 companies
3.1.2. Top 5 Financials Analysis
3.1.3. Market Value split by Top 10 companies
3.1.4. Patent Analysis - Top 10 companies
3.1.5. Pricing Analysis
4. Contraceptives Market – Startup companies Scenario Premium
4.1. Top 10 startup company Analysis by
4.1.1. Investment
4.1.2. Revenue
4.1.3. Market Shares
4.1.4. Market Size and Application Analysis
4.1.5. Venture Capital and Funding Scenario
5. Contraceptives Market – Industry Market Entry Scenario Premium
5.1. Regulatory Framework Overview
5.2. New Business and Ease of Doing business index
5.3. Case studies of successful ventures
5.4. Customer Analysis – Top 10 companies
6. Contraceptives Market Forces
6.1. Drivers
6.2. Constraints
6.3. Challenges
6.4. Porters five force model
6.4.1. Bargaining power of suppliers
6.4.2. Bargaining powers of customers
6.4.3. Threat of new entrants
6.4.4. Rivalry among existing players
6.4.5. Threat of substitutes
7. Contraceptives Market -Strategic analysis
7.1. Value chain analysis
7.2. Opportunities analysis
7.3. Product life cycle
7.4. Suppliers and distributors Market Share
8. Contraceptives Market – By Product (Market Size -$Million / $Billion)
8.1. Market Size and Market Share Analysis
8.2. Application Revenue and Trend Research
8.3. Product Segment Analysis
8.3.1. Drug
8.3.1.1. Oral Contraceptive
8.3.1.2. Injectible
8.3.1.3. Topical
8.3.2. Devices
8.3.2.1. Condom
8.3.2.2. Diaphragms
8.3.2.3. Sponges
8.3.2.4. Vaginal Ring
8.3.2.5. Subdermal Implants
8.3.2.6. Intrauterine Devices
8.3.2.6.1. Male
8.3.2.6.2. Female
9. Contraceptives – By End-User(Market Size -$Million / $Billion)
9.1. Segment type Size and Market Share Analysis
9.2. Application Revenue and Trends by type of Application
9.3. Application Segment Analysis by Type
9.3.1. Hospital
9.3.2. Clinic
9.3.3. Home Care
9.3.4. Ambulatory Surgical Centre
9.3.5. Others
10. Contraceptives - By Geography (Market Size -$Million / $Billion)
10.1. Contraceptives Market - North America Segment Research
10.2. North America Market Research (Million / $Billion)
10.2.1. Segment type Size and Market Size Analysis
10.2.2. Revenue and Trends
10.2.3. Application Revenue and Trends by type of Application
10.2.4. Company Revenue and Product Analysis
10.2.5. North America Product type and Application Market Size
10.2.5.1. U.S.
10.2.5.2. Canada
10.2.5.3. Mexico
10.2.5.4. Rest of North America
10.3. Contraceptives - South America Segment Research
10.4. South America Market Research (Market Size -$Million / $Billion)
10.4.1. Segment type Size and Market Size Analysis
10.4.2. Revenue and Trends
10.4.3. Application Revenue and Trends by type of Application
10.4.4. Company Revenue and Product Analysis
10.4.5. South America Product type and Application Market Size
10.4.5.1. Brazil
10.4.5.2. Venezuela
10.4.5.3. Argentina
10.4.5.4. Ecuador
10.4.5.5. Peru
10.4.5.6. Colombia
10.4.5.7. Costa Rica
10.4.5.8. Rest of South America
10.5. Contraceptives - Europe Segment Research
10.6. Europe Market Research (Market Size -$Million / $Billion)
10.6.1. Segment type Size and Market Size Analysis
10.6.2. Revenue and Trends
10.6.3. Application Revenue and Trends by type of Application
10.6.4. Company Revenue and Product Analysis
10.6.5. Europe Segment Product type and Application Market Size
10.6.5.1. U.K
10.6.5.2. Germany
10.6.5.3. Italy
10.6.5.4. France
10.6.5.5. Netherlands
10.6.5.6. Belgium
10.6.5.7. Spain
10.6.5.8. Denmark
10.6.5.9. Rest of Europe
10.7. Contraceptives – APAC Segment Research
10.8. APAC Market Research (Market Size -$Million / $Billion)
10.8.1. Segment type Size and Market Size Analysis
10.8.2. Revenue and Trends
10.8.3. Application Revenue and Trends by type of Application
10.8.4. Company Revenue and Product Analysis
10.8.5. APAC Segment – Product type and Application Market Size
10.8.5.1. China
10.8.5.2. Australia
10.8.5.3. Japan
10.8.5.4. South Korea
10.8.5.5. India
10.8.5.6. Taiwan
10.8.5.7. Malaysia
11. Contraceptives Market - Entropy
11.1. New product launches
11.2. M&A's, collaborations, JVs and partnerships
12. Contraceptives Market – Industry / Segment Competition landscape Premium
12.1. Market Share Analysis
12.1.1. Market Share by Country- Top companies
12.1.2. Market Share by Region- Top 10 companies
12.1.3. Market Share by type of Application – Top 10 companies
12.1.4. Market Share by type of Product / Product category- Top 10 companies
12.1.5. Market Share at global level- Top 10 companies
12.1.6. Best Practises for companies
13. Contraceptives Market – Key Company List by Country Premium
14. Contraceptives Market Company Analysis
14.1. Market Share, Company Revenue, Products, M&A, Developments
14.2. Cooper Surgical, Inc.
14.3. Bayer AG
14.4. Actavis, Inc.
14.5. The Female Health Company
14.6. Merck & Co., Inc.
14.7. Mayer Laboratories, Inc
14.8. Pfizer, Inc.
14.9. Church & Dwight, Co., Inc.
14.10. Medisafe Distribution Inc
14.11. Teva Pharmaceutical Industries Limited
14.12. Company 11
14.13. Company 12
14.14. Company 13 and more
"*Financials would be provided on a best efforts basis for private companies"
15. Contraceptives Market - Appendix
15.1. Abbreviations
15.2. Sources
16. Contraceptives Market - Methodology
16.1. Research Methodology
16.1.1. Company Expert Interviews
16.1.2. Industry Databases
16.1.3. Associations
16.1.4. Company News
16.1.5. Company Annual Reports
16.1.6. Application Trends
16.1.7. New Products and Product database
16.1.8. Company Transcripts
16.1.9. R&D Trends
16.1.10. Key Opinion Leaders Interviews
16.1.11. Supply and Demand Trends
List of Tables:
Table 1: Contraceptives Market Overview 2021-2026
Table 2: Contraceptives Market Leader Analysis 2018-2019 (US$)
Table 3: Contraceptives Market Product Analysis 2018-2019 (US$)
Table 4: Contraceptives Market End User Analysis 2018-2019 (US$)
Table 5: Contraceptives Market Patent Analysis 2013-2018* (US$)
Table 6: Contraceptives Market Financial Analysis 2018-2019 (US$)
Table 7: Contraceptives Market Driver Analysis 2018-2019 (US$)
Table 8: Contraceptives Market Challenges Analysis 2018-2019 (US$)
Table 9: Contraceptives Market Constraint Analysis 2018-2019 (US$)
Table 10: Contraceptives Market Supplier Bargaining Power Analysis 2018-2019 (US$)
Table 11: Contraceptives Market Buyer Bargaining Power Analysis 2018-2019 (US$)
Table 12: Contraceptives Market Threat of Substitutes Analysis 2018-2019 (US$)
Table 13: Contraceptives Market Threat of New Entrants Analysis 2018-2019 (US$)
Table 14: Contraceptives Market Degree of Competition Analysis 2018-2019 (US$)
Table 15: Contraceptives Market Value Chain Analysis 2018-2019 (US$)
Table 16: Contraceptives Market Pricing Analysis 2021-2026 (US$)
Table 17: Contraceptives Market Opportunities Analysis 2021-2026 (US$)
Table 18: Contraceptives Market Product Life Cycle Analysis 2021-2026 (US$)
Table 19: Contraceptives Market Supplier Analysis 2018-2019 (US$)
Table 20: Contraceptives Market Distributor Analysis 2018-2019 (US$)
Table 21: Contraceptives Market Trend Analysis 2018-2019 (US$)
Table 22: Contraceptives Market Size 2018 (US$)
Table 23: Contraceptives Market Forecast Analysis 2021-2026 (US$)
Table 24: Contraceptives Market Sales Forecast Analysis 2021-2026 (Units)
Table 25: Contraceptives Market, Revenue & Volume, By Product, 2021-2026 ($)
Table 26: Contraceptives Market By Product, Revenue & Volume, By Drug, 2021-2026 ($)
Table 27: Contraceptives Market By Product, Revenue & Volume, By Devices, 2021-2026 ($)
Table 28: Contraceptives Market, Revenue & Volume, By End User, 2021-2026 ($)
Table 29: Contraceptives Market By End User, Revenue & Volume, By Hospital, 2021-2026 ($)
Table 30: Contraceptives Market By End User, Revenue & Volume, By Clinic, 2021-2026 ($)
Table 31: Contraceptives Market By End User, Revenue & Volume, By Home Care, 2021-2026 ($)
Table 32: Contraceptives Market By End User, Revenue & Volume, By Ambulatory Surgical Centre, 2021-2026 ($)
Table 33: North America Contraceptives Market, Revenue & Volume, By Product, 2021-2026 ($)
Table 34: North America Contraceptives Market, Revenue & Volume, By End User, 2021-2026 ($)
Table 35: South america Contraceptives Market, Revenue & Volume, By Product, 2021-2026 ($)
Table 36: South america Contraceptives Market, Revenue & Volume, By End User, 2021-2026 ($)
Table 37: Europe Contraceptives Market, Revenue & Volume, By Product, 2021-2026 ($)
Table 38: Europe Contraceptives Market, Revenue & Volume, By End User, 2021-2026 ($)
Table 39: APAC Contraceptives Market, Revenue & Volume, By Product, 2021-2026 ($)
Table 40: APAC Contraceptives Market, Revenue & Volume, By End User, 2021-2026 ($)
Table 41: Middle East & Africa Contraceptives Market, Revenue & Volume, By Product, 2021-2026 ($)
Table 42: Middle East & Africa Contraceptives Market, Revenue & Volume, By End User, 2021-2026 ($)
Table 43: Russia Contraceptives Market, Revenue & Volume, By Product, 2021-2026 ($)
Table 44: Russia Contraceptives Market, Revenue & Volume, By End User, 2021-2026 ($)
Table 45: Israel Contraceptives Market, Revenue & Volume, By Product, 2021-2026 ($)
Table 46: Israel Contraceptives Market, Revenue & Volume, By End User, 2021-2026 ($)
Table 47: Top Companies 2018 (US$) Contraceptives Market, Revenue & Volume
Table 48: Product Launch 2018-2019 Contraceptives Market, Revenue & Volume
Table 49: Mergers & Acquistions 2018-2019 Contraceptives Market, Revenue & Volume
List of Figures:
Figure 1: Overview of Contraceptives Market 2021-2026
Figure 2: Market Share Analysis for Contraceptives Market 2018 (US$)
Figure 3: Product Comparison in Contraceptives Market 2018-2019 (US$)
Figure 4: End User Profile for Contraceptives Market 2018-2019 (US$)
Figure 5: Patent Application and Grant in Contraceptives Market 2013-2018* (US$)
Figure 6: Top 5 Companies Financial Analysis in Contraceptives Market 2018-2019 (US$)
Figure 7: Market Entry Strategy in Contraceptives Market 2018-2019
Figure 8: Ecosystem Analysis in Contraceptives Market 2018
Figure 9: Average Selling Price in Contraceptives Market 2021-2026
Figure 10: Top Opportunites in Contraceptives Market 2018-2019
Figure 11: Market Life Cycle Analysis in Contraceptives Market
Figure 12: GlobalBy Product Contraceptives Market Revenue, 2021-2026 ($)
Figure 13: GlobalBy End User Contraceptives Market Revenue, 2021-2026 ($)
Figure 14: Global Contraceptives Market - By Geography
Figure 15: Global Contraceptives Market Value & Volume, By Geography, 2021-2026 ($)
Figure 16: Global Contraceptives Market CAGR, By Geography, 2021-2026 (%)
Figure 17: North America Contraceptives Market Value & Volume, 2021-2026 ($)
Figure 18: US Contraceptives Market Value & Volume, 2021-2026 ($)
Figure 19: US GDP and Population, 2018-2019 ($)
Figure 20: US GDP – Composition of 2018, By Sector of Origin
Figure 21: US Export and Import Value & Volume, 2018-2019 ($)
Figure 22: Canada Contraceptives Market Value & Volume, 2021-2026 ($)
Figure 23: Canada GDP and Population, 2018-2019 ($)
Figure 24: Canada GDP – Composition of 2018, By Sector of Origin
Figure 25: Canada Export and Import Value & Volume, 2018-2019 ($)
Figure 26: Mexico Contraceptives Market Value & Volume, 2021-2026 ($)
Figure 27: Mexico GDP and Population, 2018-2019 ($)
Figure 28: Mexico GDP – Composition of 2018, By Sector of Origin
Figure 29: Mexico Export and Import Value & Volume, 2018-2019 ($)
Figure 30: South America Contraceptives Market Value & Volume, 2021-2026 ($)
Figure 31: Brazil Contraceptives Market Value & Volume, 2021-2026 ($)
Figure 32: Brazil GDP and Population, 2018-2019 ($)
Figure 33: Brazil GDP – Composition of 2018, By Sector of Origin
Figure 34: Brazil Export and Import Value & Volume, 2018-2019 ($)
Figure 35: Venezuela Contraceptives Market Value & Volume, 2021-2026 ($)
Figure 36: Venezuela GDP and Population, 2018-2019 ($)
Figure 37: Venezuela GDP – Composition of 2018, By Sector of Origin
Figure 38: Venezuela Export and Import Value & Volume, 2018-2019 ($)
Figure 39: Argentina Contraceptives Market Value & Volume, 2021-2026 ($)
Figure 40: Argentina GDP and Population, 2018-2019 ($)
Figure 41: Argentina GDP – Composition of 2018, By Sector of Origin
Figure 42: Argentina Export and Import Value & Volume, 2018-2019 ($)
Figure 43: Ecuador Contraceptives Market Value & Volume, 2021-2026 ($)
Figure 44: Ecuador GDP and Population, 2018-2019 ($)
Figure 45: Ecuador GDP – Composition of 2018, By Sector of Origin
Figure 46: Ecuador Export and Import Value & Volume, 2018-2019 ($)
Figure 47: Peru Contraceptives Market Value & Volume, 2021-2026 ($)
Figure 48: Peru GDP and Population, 2018-2019 ($)
Figure 49: Peru GDP – Composition of 2018, By Sector of Origin
Figure 50: Peru Export and Import Value & Volume, 2018-2019 ($)
Figure 51: Colombia Contraceptives Market Value & Volume, 2021-2026 ($)
Figure 52: Colombia GDP and Population, 2018-2019 ($)
Figure 53: Colombia GDP – Composition of 2018, By Sector of Origin
Figure 54: Colombia Export and Import Value & Volume, 2018-2019 ($)
Figure 55: Costa Rica Contraceptives Market Value & Volume, 2021-2026 ($)
Figure 56: Costa Rica GDP and Population, 2018-2019 ($)
Figure 57: Costa Rica GDP – Composition of 2018, By Sector of Origin
Figure 58: Costa Rica Export and Import Value & Volume, 2018-2019 ($)
Figure 59: Europe Contraceptives Market Value & Volume, 2021-2026 ($)
Figure 60: U.K Contraceptives Market Value & Volume, 2021-2026 ($)
Figure 61: U.K GDP and Population, 2018-2019 ($)
Figure 62: U.K GDP – Composition of 2018, By Sector of Origin
Figure 63: U.K Export and Import Value & Volume, 2018-2019 ($)
Figure 64: Germany Contraceptives Market Value & Volume, 2021-2026 ($)
Figure 65: Germany GDP and Population, 2018-2019 ($)
Figure 66: Germany GDP – Composition of 2018, By Sector of Origin
Figure 67: Germany Export and Import Value & Volume, 2018-2019 ($)
Figure 68: Italy Contraceptives Market Value & Volume, 2021-2026 ($)
Figure 69: Italy GDP and Population, 2018-2019 ($)
Figure 70: Italy GDP – Composition of 2018, By Sector of Origin
Figure 71: Italy Export and Import Value & Volume, 2018-2019 ($)
Figure 72: France Contraceptives Market Value & Volume, 2021-2026 ($)
Figure 73: France GDP and Population, 2018-2019 ($)
Figure 74: France GDP – Composition of 2018, By Sector of Origin
Figure 75: France Export and Import Value & Volume, 2018-2019 ($)
Figure 76: Netherlands Contraceptives Market Value & Volume, 2021-2026 ($)
Figure 77: Netherlands GDP and Population, 2018-2019 ($)
Figure 78: Netherlands GDP – Composition of 2018, By Sector of Origin
Figure 79: Netherlands Export and Import Value & Volume, 2018-2019 ($)
Figure 80: Belgium Contraceptives Market Value & Volume, 2021-2026 ($)
Figure 81: Belgium GDP and Population, 2018-2019 ($)
Figure 82: Belgium GDP – Composition of 2018, By Sector of Origin
Figure 83: Belgium Export and Import Value & Volume, 2018-2019 ($)
Figure 84: Spain Contraceptives Market Value & Volume, 2021-2026 ($)
Figure 85: Spain GDP and Population, 2018-2019 ($)
Figure 86: Spain GDP – Composition of 2018, By Sector of Origin
Figure 87: Spain Export and Import Value & Volume, 2018-2019 ($)
Figure 88: Denmark Contraceptives Market Value & Volume, 2021-2026 ($)
Figure 89: Denmark GDP and Population, 2018-2019 ($)
Figure 90: Denmark GDP – Composition of 2018, By Sector of Origin
Figure 91: Denmark Export and Import Value & Volume, 2018-2019 ($)
Figure 92: APAC Contraceptives Market Value & Volume, 2021-2026 ($)
Figure 93: China Contraceptives Market Value & Volume, 2021-2026
Figure 94: China GDP and Population, 2018-2019 ($)
Figure 95: China GDP – Composition of 2018, By Sector of Origin
Figure 96: China Export and Import Value & Volume, 2018-2019 ($) Contraceptives Market China Export and Import Value & Volume, 2018-2019 ($)
Figure 97: Australia Contraceptives Market Value & Volume, 2021-2026 ($)
Figure 98: Australia GDP and Population, 2018-2019 ($)
Figure 99: Australia GDP – Composition of 2018, By Sector of Origin
Figure 100: Australia Export and Import Value & Volume, 2018-2019 ($)
Figure 101: South Korea Contraceptives Market Value & Volume, 2021-2026 ($)
Figure 102: South Korea GDP and Population, 2018-2019 ($)
Figure 103: South Korea GDP – Composition of 2018, By Sector of Origin
Figure 104: South Korea Export and Import Value & Volume, 2018-2019 ($)
Figure 105: India Contraceptives Market Value & Volume, 2021-2026 ($)
Figure 106: India GDP and Population, 2018-2019 ($)
Figure 107: India GDP – Composition of 2018, By Sector of Origin
Figure 108: India Export and Import Value & Volume, 2018-2019 ($)
Figure 109: Taiwan Contraceptives Market Value & Volume, 2021-2026 ($)
Figure 110: Taiwan GDP and Population, 2018-2019 ($)
Figure 111: Taiwan GDP – Composition of 2018, By Sector of Origin
Figure 112: Taiwan Export and Import Value & Volume, 2018-2019 ($)
Figure 113: Malaysia Contraceptives Market Value & Volume, 2021-2026 ($)
Figure 114: Malaysia GDP and Population, 2018-2019 ($)
Figure 115: Malaysia GDP – Composition of 2018, By Sector of Origin
Figure 116: Malaysia Export and Import Value & Volume, 2018-2019 ($)
Figure 117: Hong Kong Contraceptives Market Value & Volume, 2021-2026 ($)
Figure 118: Hong Kong GDP and Population, 2018-2019 ($)
Figure 119: Hong Kong GDP – Composition of 2018, By Sector of Origin
Figure 120: Hong Kong Export and Import Value & Volume, 2018-2019 ($)
Figure 121: Middle East & Africa Contraceptives Market Middle East & Africa 3D Printing Market Value & Volume, 2021-2026 ($)
Figure 122: Russia Contraceptives Market Value & Volume, 2021-2026 ($)
Figure 123: Russia GDP and Population, 2018-2019 ($)
Figure 124: Russia GDP – Composition of 2018, By Sector of Origin
Figure 125: Russia Export and Import Value & Volume, 2018-2019 ($)
Figure 126: Israel Contraceptives Market Value & Volume, 2021-2026 ($)
Figure 127: Israel GDP and Population, 2018-2019 ($)
Figure 128: Israel GDP – Composition of 2018, By Sector of Origin
Figure 129: Israel Export and Import Value & Volume, 2018-2019 ($)
Figure 130: Entropy Share, By Strategies, 2018-2019* (%) Contraceptives Market
Figure 131: Developments, 2018-2019* Contraceptives Market
Figure 132: Company 1 Contraceptives Market Net Revenue, By Years, 2018-2019* ($)
Figure 133: Company 1 Contraceptives Market Net Revenue Share, By Business segments, 2018 (%)
Figure 134: Company 1 Contraceptives Market Net Sales Share, By Geography, 2018 (%)
Figure 135: Company 2 Contraceptives Market Net Revenue, By Years, 2018-2019* ($)
Figure 136: Company 2 Contraceptives Market Net Revenue Share, By Business segments, 2018 (%)
Figure 137: Company 2 Contraceptives Market Net Sales Share, By Geography, 2018 (%)
Figure 138: Company 3 Contraceptives Market Net Revenue, By Years, 2018-2019* ($)
Figure 139: Company 3 Contraceptives Market Net Revenue Share, By Business segments, 2018 (%)
Figure 140: Company 3 Contraceptives Market Net Sales Share, By Geography, 2018 (%)
Figure 141: Company 4 Contraceptives Market Net Revenue, By Years, 2018-2019* ($)
Figure 142: Company 4 Contraceptives Market Net Revenue Share, By Business segments, 2018 (%)
Figure 143: Company 4 Contraceptives Market Net Sales Share, By Geography, 2018 (%)
Figure 144: Company 5 Contraceptives Market Net Revenue, By Years, 2018-2019* ($)
Figure 145: Company 5 Contraceptives Market Net Revenue Share, By Business segments, 2018 (%)
Figure 146: Company 5 Contraceptives Market Net Sales Share, By Geography, 2018 (%)
Figure 147: Company 6 Contraceptives Market Net Revenue, By Years, 2018-2019* ($)
Figure 148: Company 6 Contraceptives Market Net Revenue Share, By Business segments, 2018 (%)
Figure 149: Company 6 Contraceptives Market Net Sales Share, By Geography, 2018 (%)
Figure 150: Company 7 Contraceptives Market Net Revenue, By Years, 2018-2019* ($)
Figure 151: Company 7 Contraceptives Market Net Revenue Share, By Business segments, 2018 (%)
Figure 152: Company 7 Contraceptives Market Net Sales Share, By Geography, 2018 (%)
Figure 153: Company 8 Contraceptives Market Net Revenue, By Years, 2018-2019* ($)
Figure 154: Company 8 Contraceptives Market Net Revenue Share, By Business segments, 2018 (%)
Figure 155: Company 8 Contraceptives Market Net Sales Share, By Geography, 2018 (%)
Figure 156: Company 9 Contraceptives Market Net Revenue, By Years, 2018-2019* ($)
Figure 157: Company 9 Contraceptives Market Net Revenue Share, By Business segments, 2018 (%)
Figure 158: Company 9 Contraceptives Market Net Sales Share, By Geography, 2018 (%)
Figure 159: Company 10 Contraceptives Market Net Revenue, By Years, 2018-2019* ($)
Figure 160: Company 10 Contraceptives Market Net Revenue Share, By Business segments, 2018 (%)
Figure 161: Company 10 Contraceptives Market Net Sales Share, By Geography, 2018 (%)
Figure 162: Company 11 Contraceptives Market Net Revenue, By Years, 2018-2019* ($)
Figure 163: Company 11 Contraceptives Market Net Revenue Share, By Business segments, 2018 (%)
Figure 164: Company 11 Contraceptives Market Net Sales Share, By Geography, 2018 (%)
Figure 165: Company 12 Contraceptives Market Net Revenue, By Years, 2018-2019* ($)
Figure 166: Company 12 Contraceptives Market Net Revenue Share, By Business segments, 2018 (%)
Figure 167: Company 12 Contraceptives Market Net Sales Share, By Geography, 2018 (%)
Figure 168: Company 13 Contraceptives Market Net Revenue, By Years, 2018-2019* ($)
Figure 169: Company 13 Contraceptives Market Net Revenue Share, By Business segments, 2018 (%)
Figure 170: Company 13 Contraceptives Market Net Sales Share, By Geography, 2018 (%)
Figure 171: Company 14 Contraceptives Market Net Revenue, By Years, 2018-2019* ($)
Figure 172: Company 14 Contraceptives Market Net Revenue Share, By Business segments, 2018 (%)
Figure 173: Company 14 Contraceptives Market Net Sales Share, By Geography, 2018 (%)
Figure 174: Company 15 Contraceptives Market Net Revenue, By Years, 2018-2019* ($)
Figure 175: Company 15 Contraceptives Market Net Revenue Share, By Business segments, 2018 (%)
Figure 176: Company 15 Contraceptives Market Net Sales Share, By Geography, 2018 (%)