 Email
Email Print
Print


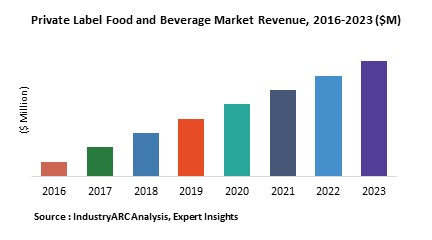
Private Label Food and Beverage Market - Forecast(2024 - 2030)
"Private Label Products" are produced by a company and are proposed in the market under brand name of another company. These products are produced by third parties or companies which are specialized in the product but they don't own a brand of their own for selling it in the market. Private label products are popular among broad range of the products in cosmetics, food and beverages, textiles and many more industries. The advanced trend gaining momentum in the market is the growing digitization of private label. Now the main ideal platform to advertise and sell these products is internet. Therefore, private label business is widening to cater the needs of online consumers. The net market for private label food and beverage market is estimated to be $XX billion in 2016 and is forecast to cross $XX billion by 2023 with a CAGR of $XX% between 2017 and 2023.
Growing innovation and rising demand of affordable priced private label products are the key factors driving the private label products market. Private label products market is segmented into product category, distribution channel and geography. The market for private label products in various regions through its distribution channels such as super markets & hyper markets, convenience stores others have been covered in the report.
The market is also segmented into regions of North America, Europe, Asia-Pacific, Rest of the World. Key market players are profiled with attributes of company overview, business strategies and product portfolio in the report.
Sample Companies Profiled in this Report are:
- ALDI,
- Costco Wholesale Corporation,
- Trader Joe's,
- 10+.
1. Private Label Food and Beverage Market - Overview
1.1. Definitions and Scope
2. Private Label Food and Beverage Market - Executive summary
2.1. Market Revenue, Market Size and Key Trends by Company
2.2. Key Trends by type of Application
2.3. Key Trends segmented by Geography
3. Private Label Food and Beverage Market
3.1. Comparative analysis
3.1.1. Product Benchmarking - Top 10 companies
3.1.2. Top 5 Financials Analysis
3.1.3. Market Value split by Top 10 companies
3.1.4. Patent Analysis - Top 10 companies
3.1.5. Pricing Analysis
4. Private Label Food and Beverage Market – Startup companies Scenario Premium
4.1. Top 10 startup company Analysis by
4.1.1. Investment
4.1.2. Revenue
4.1.3. Market Shares
4.1.4. Market Size and Application Analysis
4.1.5. Venture Capital and Funding Scenario
5. Private Label Food and Beverage Market – Industry Market Entry Scenario Premium
5.1. Regulatory Framework Overview
5.2. New Business and Ease of Doing business index
5.3. Case studies of successful ventures
5.4. Customer Analysis – Top 10 companies
6. Private Label Food and Beverage Market Forces
6.1. Drivers
6.2. Constraints
6.3. Challenges
6.4. Porters five force model
6.4.1. Bargaining power of suppliers
6.4.2. Bargaining powers of customers
6.4.3. Threat of new entrants
6.4.4. Rivalry among existing players
6.4.5. Threat of substitutes
7. Private Label Food and Beverage Market -Strategic analysis
7.1. Value chain analysis
7.2. Opportunities analysis
7.3. Product life cycle
7.4. Suppliers and distributors Market Share
8. Private Label Food and Beverage Market – By Product Category (Market Size -$Million / $Billion)
8.1. Market Size and Market Share Analysis
8.2. Application Revenue and Trend Research
8.3. Product Segment Analysis
8.3.1. Private label food
8.3.1.1. Bakery Products
8.3.1.1.1. Bakery
8.3.1.1.2. Cereal
8.3.1.2. Dairy Food
8.3.1.2.1. Yogurt
8.3.1.2.2. Ice -cream
8.3.1.2.3. Baby Food
8.3.1.3. Meat, Egg & Seafood
8.3.1.3.1. Poultry
8.3.1.3.2. Egg
8.3.1.3.3. Fish
8.3.1.4. Condiments & Sauces
8.3.1.4.1. Deli dressings and salads and prepared foods
8.3.1.4.2. Condiments Gravies and Sauces
8.3.1.5. General Food
8.3.1.5.1. Savory Snacks
8.3.1.5.2. Confectionary
8.3.1.5.3. Soup
8.3.1.5.4. Processed food
8.3.1.5.5. Coffee and Tea
8.3.2. Private label beverage
8.3.2.1. Bottled Water
8.3.2.2. Juices
8.3.2.3. Carbonated Beverages
8.3.2.4. Sports, Energy & Functional Drinks
8.3.2.5. Alcoholic drinks
8.3.2.6. Others
9. Private Label Food and Beverage Market – By Distribution Channel (Market Size -$Million / $Billion)
9.1. Retail format
9.1.1. Supermarkets and hypermarkets
9.1.2. Convenience Stores
9.1.3. Cash & Carries & Warehouse Clubs
9.1.4. Dollar Stores", Variety Stores & General Merchandise Retailers
9.1.5. Food and Drink Specialists
9.1.6. Department Stores
9.1.7. eRetailers
9.1.8. Others
10. Private Label Food and Beverage - By Geography (Market Size -$Million / $Billion)
10.1. Private Label Food and Beverage Market - North America Segment Research
10.2. North America Market Research (Million / $Billion)
10.2.1. Segment type Size and Market Size Analysis
10.2.2. Revenue and Trends
10.2.3. Application Revenue and Trends by type of Application
10.2.4. Company Revenue and Product Analysis
10.2.5. North America Product type and Application Market Size
10.2.5.1. U.S.
10.2.5.2. Canada
10.2.5.3. Mexico
10.2.5.4. Rest of North America
10.3. Private Label Food and Beverage - South America Segment Research
10.4. South America Market Research (Market Size -$Million / $Billion)
10.4.1. Segment type Size and Market Size Analysis
10.4.2. Revenue and Trends
10.4.3. Application Revenue and Trends by type of Application
10.4.4. Company Revenue and Product Analysis
10.4.5. South America Product type and Application Market Size
10.4.5.1. Brazil
10.4.5.2. Venezuela
10.4.5.3. Argentina
10.4.5.4. Ecuador
10.4.5.5. Peru
10.4.5.6. Colombia
10.4.5.7. Costa Rica
10.4.5.8. Rest of South America
10.5. Private Label Food and Beverage - Europe Segment Research
10.6. Europe Market Research (Market Size -$Million / $Billion)
10.6.1. Segment type Size and Market Size Analysis
10.6.2. Revenue and Trends
10.6.3. Application Revenue and Trends by type of Application
10.6.4. Company Revenue and Product Analysis
10.6.5. Europe Segment Product type and Application Market Size
10.6.5.1. U.K
10.6.5.2. Germany
10.6.5.3. Italy
10.6.5.4. France
10.6.5.5. Netherlands
10.6.5.6. Belgium
10.6.5.7. Spain
10.6.5.8. Denmark
10.6.5.9. Rest of Europe
10.7. Private Label Food and Beverage – APAC Segment Research
10.8. APAC Market Research (Market Size -$Million / $Billion)
10.8.1. Segment type Size and Market Size Analysis
10.8.2. Revenue and Trends
10.8.3. Application Revenue and Trends by type of Application
10.8.4. Company Revenue and Product Analysis
10.8.5. APAC Segment – Product type and Application Market Size
10.8.5.1. China
10.8.5.2. Australia
10.8.5.3. Japan
10.8.5.4. South Korea
10.8.5.5. India
10.8.5.6. Taiwan
10.8.5.7. Malaysia
11. Private Label Food and Beverage Market - Entropy
11.1. New product launches
11.2. M&A's, collaborations, JVs and partnerships
12. Private Label Food and Beverage Market – Industry / Segment Competition landscape Premium
12.1. Market Share Analysis
12.1.1. Market Share by Country- Top companies
12.1.2. Market Share by Region- Top 10 companies
12.1.3. Market Share by type of Application – Top 10 companies
12.1.4. Market Share by type of Product / Product category- Top 10 companies
12.1.5. Market Share at global level- Top 10 companies
12.1.6. Best Practises for companies
13. Private Label Food and Beverage Market – Key Company List by Country Premium
14. Private Label Food and Beverage Market Company Analysis
14.1. Market Share, Company Revenue, Products, M&A, Developments
14.2. ALDI
14.3. Costco Wholesale Corporation
14.4. Trader Joe's
14.5. Company 4
14.6. Company 5
14.7. Company 6
14.8. Company 7
14.9. Company 8
14.10. Company 9
14.11. Company 10 and more
"*Financials would be provided on a best efforts basis for private companies"
15. Private Label Food and Beverage Market -Appendix
15.1. Abbreviations
15.2. Sources
16. Private Label Food and Beverage Market -Methodology Premium
16.1. Research Methodology
16.1.1. Company Expert Interviews
16.1.2. Industry Databases
16.1.3. Associations
16.1.4. Company News
16.1.5. Company Annual Reports
16.1.6. Application Trends
16.1.7. New Products and Product database
16.1.8. Company Transcripts
16.1.9. R&D Trends
16.1.10. Key Opinion Leaders Interviews
16.1.11. Supply and Demand Trends
List of Tables:
Table 1: Private Label Food and Beverage Market Overview 2019-2024
Table 2: Private Label Food and Beverage Market Leader Analysis 2018-2019 (US$)
Table 3: Private Label Food and Beverage Market Product Analysis 2018-2019 (US$)
Table 4: Private Label Food and Beverage Market End User Analysis 2018-2019 (US$)
Table 5: Private Label Food and Beverage Market Patent Analysis 2013-2018* (US$)
Table 6: Private Label Food and Beverage Market Financial Analysis 2018-2019 (US$)
Table 7: Private Label Food and Beverage Market Driver Analysis 2018-2019 (US$)
Table 8: Private Label Food and Beverage Market Challenges Analysis 2018-2019 (US$)
Table 9: Private Label Food and Beverage Market Constraint Analysis 2018-2019 (US$)
Table 10: Private Label Food and Beverage Market Supplier Bargaining Power Analysis 2018-2019 (US$)
Table 11: Private Label Food and Beverage Market Buyer Bargaining Power Analysis 2018-2019 (US$)
Table 12: Private Label Food and Beverage Market Threat of Substitutes Analysis 2018-2019 (US$)
Table 13: Private Label Food and Beverage Market Threat of New Entrants Analysis 2018-2019 (US$)
Table 14: Private Label Food and Beverage Market Degree of Competition Analysis 2018-2019 (US$)
Table 15: Private Label Food and Beverage Market Value Chain Analysis 2018-2019 (US$)
Table 16: Private Label Food and Beverage Market Pricing Analysis 2019-2024 (US$)
Table 17: Private Label Food and Beverage Market Opportunities Analysis 2019-2024 (US$)
Table 18: Private Label Food and Beverage Market Product Life Cycle Analysis 2019-2024 (US$)
Table 19: Private Label Food and Beverage Market Supplier Analysis 2018-2019 (US$)
Table 20: Private Label Food and Beverage Market Distributor Analysis 2018-2019 (US$)
Table 21: Private Label Food and Beverage Market Trend Analysis 2018-2019 (US$)
Table 22: Private Label Food and Beverage Market Size 2018 (US$)
Table 23: Private Label Food and Beverage Market Forecast Analysis 2019-2024 (US$)
Table 24: Private Label Food and Beverage Market Sales Forecast Analysis 2019-2024 (Units)
Table 25: Private Label Food and Beverage Market, Revenue & Volume,By Product, 2019-2024 ($)
Table 26: Private Label Food and Beverage Market By Product, Revenue & Volume,By Private label food, 2019-2024 ($)
Table 27: Private Label Food and Beverage Market By Product, Revenue & Volume,By Bakery Products, 2019-2024 ($)
Table 28: Private Label Food and Beverage Market By Product, Revenue & Volume,By Dairy Food, 2019-2024 ($)
Table 29: Private Label Food and Beverage Market By Product, Revenue & Volume,By Meat, Egg & Seafood, 2019-2024 ($)
Table 30: Private Label Food and Beverage Market By Product, Revenue & Volume,By Condiments & Sauces, 2019-2024 ($)
Table 31: Private Label Food and Beverage Market, Revenue & Volume,By Distribution, 2019-2024 ($)
Table 32: Private Label Food and Beverage Market By Distribution, Revenue & Volume,By Retail format, 2019-2024 ($)
Table 33: Private Label Food and Beverage Market By Distribution, Revenue & Volume,By SuperMarket s and hyperMarket s, 2019-2024 ($)
Table 34: Private Label Food and Beverage Market By Distribution, Revenue & Volume,By Convenience Stores, 2019-2024 ($)
Table 35: Private Label Food and Beverage Market By Distribution, Revenue & Volume,By Cash & Carries & Warehouse Clubs, 2019-2024 ($)
Table 36: Private Label Food and Beverage Market By Distribution, Revenue & Volume,By Department Stores, 2019-2024 ($)
Table 37: North America Private Label Food and Beverage Market, Revenue & Volume,By Product, 2019-2024 ($)
Table 38: North America Private Label Food and Beverage Market, Revenue & Volume,By Distribution, 2019-2024 ($)
Table 39: South america Private Label Food and Beverage Market, Revenue & Volume,By Product, 2019-2024 ($)
Table 40: South america Private Label Food and Beverage Market, Revenue & Volume,By Distribution, 2019-2024 ($)
Table 41: Europe Private Label Food and Beverage Market, Revenue & Volume,By Product, 2019-2024 ($)
Table 42: Europe Private Label Food and Beverage Market, Revenue & Volume,By Distribution, 2019-2024 ($)
Table 43: APAC Private Label Food and Beverage Market, Revenue & Volume,By Product, 2019-2024 ($)
Table 44: APAC Private Label Food and Beverage Market, Revenue & Volume,By Distribution, 2019-2024 ($)
Table 45: Middle East & Africa Private Label Food and Beverage Market, Revenue & Volume,By Product, 2019-2024 ($)
Table 46: Middle East & Africa Private Label Food and Beverage Market, Revenue & Volume,By Distribution, 2019-2024 ($)
Table 47: Russia Private Label Food and Beverage Market, Revenue & Volume,By Product, 2019-2024 ($)
Table 48: Russia Private Label Food and Beverage Market, Revenue & Volume,By Distribution, 2019-2024 ($)
Table 49: Israel Private Label Food and Beverage Market, Revenue & Volume,By Product, 2019-2024 ($)
Table 50: Israel Private Label Food and Beverage Market, Revenue & Volume,By Distribution, 2019-2024 ($)
Table 51: Top Companies 2018 (US$)Private Label Food and Beverage Market, Revenue & Volume
Table 52: Product Launch 2018-2019Private Label Food and Beverage Market, Revenue & Volume
Table 53: Mergers & Acquistions 2018-2019Private Label Food and Beverage Market, Revenue & Volume
List of Figures:
Figure 1: Overview of Private Label Food and Beverage Market 2019-2024
Figure 2: Market Share Analysis for Private Label Food and Beverage Market 2018 (US$)
Figure 3: Product Comparison in Private Label Food and Beverage Market 2018-2019 (US$)
Figure 4: End User Profile for Private Label Food and Beverage Market 2018-2019 (US$)
Figure 5: Patent Application and Grant in Private Label Food and Beverage Market 2013-2018* (US$)
Figure 6: Top 5 Companies Financial Analysis in Private Label Food and Beverage Market 2018-2019 (US$)
Figure 7: Market Entry Strategy in Private Label Food and Beverage Market 2018-2019
Figure 8: Ecosystem Analysis in Private Label Food and Beverage Market 2018
Figure 9: Average Selling Price in Private Label Food and Beverage Market 2019-2024
Figure 10: Top Opportunites in Private Label Food and Beverage Market 2018-2019
Figure 11: Market Life Cycle Analysis in Private Label Food and Beverage Market Market Life Cycle Analysis in 3D Printing
Figure 12: GlobalBy ProductPrivate Label Food and Beverage Market Revenue, 2019-2024 ($)
Figure 13: GlobalBy DistributionPrivate Label Food and Beverage Market Revenue, 2019-2024 ($)
Figure 14: Global Private Label Food and Beverage Market - By Geography
Figure 15: Global Private Label Food and Beverage Market Value & Volume, By Geography, 2019-2024 ($)
Figure 16: Global Private Label Food and Beverage Market CAGR, By Geography, 2019-2024 (%)
Figure 17: North America Private Label Food and Beverage Market Value & Volume, 2019-2024 ($)
Figure 18: US Private Label Food and Beverage Market Value & Volume, 2019-2024 ($)
Figure 19: US GDP and Population, 2018-2019 ($)
Figure 20: US GDP – Composition of 2018, By Sector of Origin
Figure 21: US Export and Import Value & Volume, 2018-2019 ($)
Figure 22: Canada Private Label Food and Beverage Market Value & Volume, 2019-2024 ($)
Figure 23: Canada GDP and Population, 2018-2019 ($)
Figure 24: Canada GDP – Composition of 2018, By Sector of Origin
Figure 25: Canada Export and Import Value & Volume, 2018-2019 ($)
Figure 26: Mexico Private Label Food and Beverage Market Value & Volume, 2019-2024 ($)
Figure 27: Mexico GDP and Population, 2018-2019 ($)
Figure 28: Mexico GDP – Composition of 2018, By Sector of Origin
Figure 29: Mexico Export and Import Value & Volume, 2018-2019 ($)
Figure 30: South America Private Label Food and Beverage Market South America 3D Printing Market Value & Volume, 2019-2024 ($)
Figure 31: Brazil Private Label Food and Beverage Market Value & Volume, 2019-2024 ($)
Figure 32: Brazil GDP and Population, 2018-2019 ($)
Figure 33: Brazil GDP – Composition of 2018, By Sector of Origin
Figure 34: Brazil Export and Import Value & Volume, 2018-2019 ($)
Figure 35: Venezuela Private Label Food and Beverage Market Value & Volume, 2019-2024 ($)
Figure 36: Venezuela GDP and Population, 2018-2019 ($)
Figure 37: Venezuela GDP – Composition of 2018, By Sector of Origin
Figure 38: Venezuela Export and Import Value & Volume, 2018-2019 ($)
Figure 39: Argentina Private Label Food and Beverage Market Value & Volume, 2019-2024 ($)
Figure 40: Argentina GDP and Population, 2018-2019 ($)
Figure 41: Argentina GDP – Composition of 2018, By Sector of Origin
Figure 42: Argentina Export and Import Value & Volume, 2018-2019 ($)
Figure 43: Ecuador Private Label Food and Beverage Market Value & Volume, 2019-2024 ($)
Figure 44: Ecuador GDP and Population, 2018-2019 ($)
Figure 45: Ecuador GDP – Composition of 2018, By Sector of Origin
Figure 46: Ecuador Export and Import Value & Volume, 2018-2019 ($)
Figure 47: Peru Private Label Food and Beverage Market Value & Volume, 2019-2024 ($)
Figure 48: Peru GDP and Population, 2018-2019 ($)
Figure 49: Peru GDP – Composition of 2018, By Sector of Origin
Figure 50: Peru Export and Import Value & Volume, 2018-2019 ($)
Figure 51: Colombia Private Label Food and Beverage Market Value & Volume, 2019-2024 ($)
Figure 52: Colombia GDP and Population, 2018-2019 ($)
Figure 53: Colombia GDP – Composition of 2018, By Sector of Origin
Figure 54: Colombia Export and Import Value & Volume, 2018-2019 ($)
Figure 55: Costa Rica Private Label Food and Beverage Market Costa Rica 3D Printing Market Value & Volume, 2019-2024 ($)
Figure 56: Costa Rica GDP and Population, 2018-2019 ($)
Figure 57: Costa Rica GDP – Composition of 2018, By Sector of Origin
Figure 58: Costa Rica Export and Import Value & Volume, 2018-2019 ($)
Figure 59: Europe Private Label Food and Beverage Market Value & Volume, 2019-2024 ($)
Figure 60: U.K Private Label Food and Beverage Market Value & Volume, 2019-2024 ($)
Figure 61: U.K GDP and Population, 2018-2019 ($)
Figure 62: U.K GDP – Composition of 2018, By Sector of Origin
Figure 63: U.K Export and Import Value & Volume, 2018-2019 ($)
Figure 64: Germany Private Label Food and Beverage Market Value & Volume, 2019-2024 ($)
Figure 65: Germany GDP and Population, 2018-2019 ($)
Figure 66: Germany GDP – Composition of 2018, By Sector of Origin
Figure 67: Germany Export and Import Value & Volume, 2018-2019 ($)
Figure 68: Italy Private Label Food and Beverage Market Value & Volume, 2019-2024 ($)
Figure 69: Italy GDP and Population, 2018-2019 ($)
Figure 70: Italy GDP – Composition of 2018, By Sector of Origin
Figure 71: Italy Export and Import Value & Volume, 2018-2019 ($)
Figure 72: France Private Label Food and Beverage Market Value & Volume, 2019-2024 ($)
Figure 73: France GDP and Population, 2018-2019 ($)
Figure 74: France GDP – Composition of 2018, By Sector of Origin
Figure 75: France Export and Import Value & Volume, 2018-2019 ($)
Figure 76: Netherlands Private Label Food and Beverage Market Value & Volume, 2019-2024 ($)
Figure 77: Netherlands GDP and Population, 2018-2019 ($)
Figure 78: Netherlands GDP – Composition of 2018, By Sector of Origin
Figure 79: Netherlands Export and Import Value & Volume, 2018-2019 ($)
Figure 80: Belgium Private Label Food and Beverage Market Value & Volume, 2019-2024 ($)
Figure 81: Belgium GDP and Population, 2018-2019 ($)
Figure 82: Belgium GDP – Composition of 2018, By Sector of Origin
Figure 83: Belgium Export and Import Value & Volume, 2018-2019 ($)
Figure 84: Spain Private Label Food and Beverage Market Value & Volume, 2019-2024 ($)
Figure 85: Spain GDP and Population, 2018-2019 ($)
Figure 86: Spain GDP – Composition of 2018, By Sector of Origin
Figure 87: Spain Export and Import Value & Volume, 2018-2019 ($)
Figure 88: Denmark Private Label Food and Beverage Market Value & Volume, 2019-2024 ($)
Figure 89: Denmark GDP and Population, 2018-2019 ($)
Figure 90: Denmark GDP – Composition of 2018, By Sector of Origin
Figure 91: Denmark Export and Import Value & Volume, 2018-2019 ($)
Figure 92: APAC Private Label Food and Beverage Market Value & Volume, 2019-2024 ($)
Figure 93: China Private Label Food and Beverage Market Value & Volume, 2019-2024
Figure 94: China GDP and Population, 2018-2019 ($)
Figure 95: China GDP – Composition of 2018, By Sector of Origin
Figure 96: China Export and Import Value & Volume, 2018-2019 ($)Private Label Food and Beverage Market China Export and Import Value & Volume, 2018-2019 ($)
Figure 97: Australia Private Label Food and Beverage Market Value & Volume, 2019-2024 ($)
Figure 98: Australia GDP and Population, 2018-2019 ($)
Figure 99: Australia GDP – Composition of 2018, By Sector of Origin
Figure 100: Australia Export and Import Value & Volume, 2018-2019 ($)
Figure 101: South Korea Private Label Food and Beverage Market Value & Volume, 2019-2024 ($)
Figure 102: South Korea GDP and Population, 2018-2019 ($)
Figure 103: South Korea GDP – Composition of 2018, By Sector of Origin
Figure 104: South Korea Export and Import Value & Volume, 2018-2019 ($)
Figure 105: India Private Label Food and Beverage Market Value & Volume, 2019-2024 ($)
Figure 106: India GDP and Population, 2018-2019 ($)
Figure 107: India GDP – Composition of 2018, By Sector of Origin
Figure 108: India Export and Import Value & Volume, 2018-2019 ($)
Figure 109: Taiwan Private Label Food and Beverage Market Taiwan 3D Printing Market Value & Volume, 2019-2024 ($)
Figure 110: Taiwan GDP and Population, 2018-2019 ($)
Figure 111: Taiwan GDP – Composition of 2018, By Sector of Origin
Figure 112: Taiwan Export and Import Value & Volume, 2018-2019 ($)
Figure 113: Malaysia Private Label Food and Beverage Market Malaysia 3D Printing Market Value & Volume, 2019-2024 ($)
Figure 114: Malaysia GDP and Population, 2018-2019 ($)
Figure 115: Malaysia GDP – Composition of 2018, By Sector of Origin
Figure 116: Malaysia Export and Import Value & Volume, 2018-2019 ($)
Figure 117: Hong Kong Private Label Food and Beverage Market Hong Kong 3D Printing Market Value & Volume, 2019-2024 ($)
Figure 118: Hong Kong GDP and Population, 2018-2019 ($)
Figure 119: Hong Kong GDP – Composition of 2018, By Sector of Origin
Figure 120: Hong Kong Export and Import Value & Volume, 2018-2019 ($)
Figure 121: Middle East & Africa Private Label Food and Beverage Market Middle East & Africa 3D Printing Market Value & Volume, 2019-2024 ($)
Figure 122: Russia Private Label Food and Beverage Market Russia 3D Printing Market Value & Volume, 2019-2024 ($)
Figure 123: Russia GDP and Population, 2018-2019 ($)
Figure 124: Russia GDP – Composition of 2018, By Sector of Origin
Figure 125: Russia Export and Import Value & Volume, 2018-2019 ($)
Figure 126: Israel Private Label Food and Beverage Market Value & Volume, 2019-2024 ($)
Figure 127: Israel GDP and Population, 2018-2019 ($)
Figure 128: Israel GDP – Composition of 2018, By Sector of Origin
Figure 129: Israel Export and Import Value & Volume, 2018-2019 ($)
Figure 130: Entropy Share, By Strategies, 2018-2019* (%)Private Label Food and Beverage Market
Figure 131: Developments, 2018-2019*Private Label Food and Beverage Market
Figure 132: Company 1 Private Label Food and Beverage Market Net Revenue, By Years, 2018-2019* ($)
Figure 133: Company 1 Private Label Food and Beverage Market Net Revenue Share, By Business segments, 2018 (%)
Figure 134: Company 1 Private Label Food and Beverage Market Net Sales Share, By Geography, 2018 (%)
Figure 135: Company 2 Private Label Food and Beverage Market Net Revenue, By Years, 2018-2019* ($)
Figure 136: Company 2 Private Label Food and Beverage Market Net Revenue Share, By Business segments, 2018 (%)
Figure 137: Company 2 Private Label Food and Beverage Market Net Sales Share, By Geography, 2018 (%)
Figure 138: Company 3Private Label Food and Beverage Market Net Revenue, By Years, 2018-2019* ($)
Figure 139: Company 3Private Label Food and Beverage Market Net Revenue Share, By Business segments, 2018 (%)
Figure 140: Company 3Private Label Food and Beverage Market Net Sales Share, By Geography, 2018 (%)
Figure 141: Company 4 Private Label Food and Beverage Market Net Revenue, By Years, 2018-2019* ($)
Figure 142: Company 4 Private Label Food and Beverage Market Net Revenue Share, By Business segments, 2018 (%)
Figure 143: Company 4 Private Label Food and Beverage Market Net Sales Share, By Geography, 2018 (%)
Figure 144: Company 5 Private Label Food and Beverage Market Net Revenue, By Years, 2018-2019* ($)
Figure 145: Company 5 Private Label Food and Beverage Market Net Revenue Share, By Business segments, 2018 (%)
Figure 146: Company 5 Private Label Food and Beverage Market Net Sales Share, By Geography, 2018 (%)
Figure 147: Company 6 Private Label Food and Beverage Market Net Revenue, By Years, 2018-2019* ($)
Figure 148: Company 6 Private Label Food and Beverage Market Net Revenue Share, By Business segments, 2018 (%)
Figure 149: Company 6 Private Label Food and Beverage Market Net Sales Share, By Geography, 2018 (%)
Figure 150: Company 7 Private Label Food and Beverage Market Net Revenue, By Years, 2018-2019* ($)
Figure 151: Company 7 Private Label Food and Beverage Market Net Revenue Share, By Business segments, 2018 (%)
Figure 152: Company 7 Private Label Food and Beverage Market Net Sales Share, By Geography, 2018 (%)
Figure 153: Company 8 Private Label Food and Beverage Market Net Revenue, By Years, 2018-2019* ($)
Figure 154: Company 8 Private Label Food and Beverage Market Net Revenue Share, By Business segments, 2018 (%)
Figure 155: Company 8 Private Label Food and Beverage Market Net Sales Share, By Geography, 2018 (%)
Figure 156: Company 9 Private Label Food and Beverage Market Net Revenue, By Years, 2018-2019* ($)
Figure 157: Company 9 Private Label Food and Beverage Market Net Revenue Share, By Business segments, 2018 (%)
Figure 158: Company 9 Private Label Food and Beverage Market Net Sales Share, By Geography, 2018 (%)
Figure 159: Company 10 Private Label Food and Beverage Market Net Revenue, By Years, 2018-2019* ($)
Figure 160: Company 10 Private Label Food and Beverage Market Net Revenue Share, By Business segments, 2018 (%)
Figure 161: Company 10 Private Label Food and Beverage Market Net Sales Share, By Geography, 2018 (%)
Figure 162: Company 11 Private Label Food and Beverage Market Net Revenue, By Years, 2018-2019* ($)
Figure 163: Company 11 Private Label Food and Beverage Market Net Revenue Share, By Business segments, 2018 (%)
Figure 164: Company 11 Private Label Food and Beverage Market Net Sales Share, By Geography, 2018 (%)
Figure 165: Company 12 Private Label Food and Beverage Market Net Revenue, By Years, 2018-2019* ($)
Figure 166: Company 12 Private Label Food and Beverage Market Net Revenue Share, By Business segments, 2018 (%)
Figure 167: Company 12 Private Label Food and Beverage Market Net Sales Share, By Geography, 2018 (%)
Figure 168: Company 13Private Label Food and Beverage Market Net Revenue, By Years, 2018-2019* ($)
Figure 169: Company 13Private Label Food and Beverage Market Net Revenue Share, By Business segments, 2018 (%)
Figure 170: Company 13Private Label Food and Beverage Market Net Sales Share, By Geography, 2018 (%)
Figure 171: Company 14 Private Label Food and Beverage Market Net Revenue, By Years, 2018-2019* ($)
Figure 172: Company 14 Private Label Food and Beverage Market Net Revenue Share, By Business segments, 2018 (%)
Figure 173: Company 14 Private Label Food and Beverage Market Net Sales Share, By Geography, 2018 (%)
Figure 174: Company 15 Private Label Food and Beverage Market Net Revenue, By Years, 2018-2019* ($)
Figure 175: Company 15 Private Label Food and Beverage Market Net Revenue Share, By Business segments, 2018 (%)
Figure 176: Company 15 Private Label Food and Beverage Market Net Sales Share, By Geography, 2018 (%)