 Email
Email Print
Print


Octane Booster Market Overview
The Octane Booster Market size is estimated to reach US$2.4 billion by 2027, after growing
at a CAGR of 6.5% during the forecast period 2022-2027. An octane booster is a
liquid additive utilized to increase the octane rating of an automobile in addition
to its fuel intake system,
by enhancing the performance of gasoline and jet
fuel engines. The growing transportation sector is driving
the octane booster market
growth, for increasing the driving performance of an automobile. The transportation industry is growing. According to the government of Canada, in 2020, in Atlantic Canada, in
order to build 21 combat ships Halifax Shipyards, won a contract of US$25
billion from the Department of National Defense for over the next 30 years. Moreover, the increasing requirement for octane
boosters in the power generation sector,
due to their usage in providing a longer life for machinery such as power
generators is anticipated to
upsurge the growth of the octane booster industry during the forecast period. The global economic downturn caused by the
COVID-19 pandemic resulted in a huge drop in transportation, industrial and
other industries all across the world, which had a significant impact on the
growth of the octane booster market
size.
Report Coverage
The “Octane Booster Market Report – Forecast (2022 - 2027)” by
IndustryARC, covers an in-depth analysis of the following segments in the octane booster industry.
By Type: Organo-Metallic and Non-Metallic.
By Application: Methylcyclopentadienyl Manganese Tricarbonyl (MMT), Ferrocene, Aromatic
Alcohols, Ethanol and Others.
By End-use Industry: Transportation (Aerospace, Marine, Automotive, Locomotive), Power
Generation, Industrial and Others.
By Geography: North
America (the U.S., Canada and Mexico), Europe (the UK, Germany, France, Italy,
Netherlands, Spain, Belgium and the Rest of Europe), Asia-Pacific (China, Japan,
India, South Korea, Australia and New Zealand, Indonesia, Taiwan, Malaysia and
Rest of APAC), South America (Brazil, Argentina, Colombia, Chile and Rest of
South America), Rest of the World (Middle East and Africa).
Key Takeaways
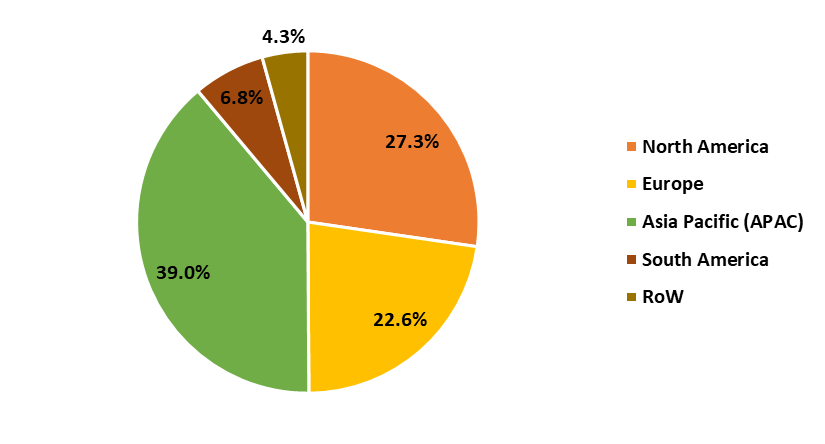
- The Asia-Pacific region dominates the Octane Booster market owing to the rising growth of the transportation industry. According to Invest India, during January 2021, a total of 161 projects in the marine sector, at a cost of US$12 billion have been completed and 178 projects at a cost of INR 1,96,578 Crores (US$ 26,595 million) are under implementation.
- Rapidly rising demand for Octane boosters in the automotive industry for increasing the driving performance of an automobile, has driven the growth of the octane booster market.
- The increasing demand for Octane Boosters in the power generation sector, due to their usage in providing a longer life for machinery such as power generators, has been a critical factor driving the growth of the octane booster market in the upcoming years.
- However, the problems associated with octane boosters such as causing air pollution can hinder the growth of the Octane Booster market.
Figure: Octane Booster Market Revenue Share by Geography, 2021 (%)
For More Details on This Report - Request for Sample
Octane Booster Market Segment Analysis – by Application
The methylcyclopentadienyl
manganese tricarbonyl (MMT) segment held the largest Octane Booster Market
share in 2021 and is estimated to grow at a CAGR of 5.9% during the forecast
period 2022-2027. Methylcyclopentadienyl manganese tricarbonyl (MMT) is utilized
as an antiknock agent in gasoline
and jet fuel and is
used in refineries to increase the octane rating of fuel as a substitute to TEL
(tetra-ethyl lead). Since it is more environment-friendly and is not
harmful to emission control devices. MMT is a cost-effective active compound in
most good-quality octane boosters as compared to others such as ferrocene and
TEL. Thus, all these exhibit characteristics of methylcyclopentadienyl
manganese tricarbonyl (MMT) making it a preferred choice over the other
applications of octane boosters that are driving its segmental growth.
Octane Booster Market Segment Analysis – by End-use Industry
The transportation industry held the largest Octane
Booster Market share in 2021 and is
estimated to grow at a CAGR of 6.1% during the forecast period 2022-2027. Octane Booster is a combination of
agents formulated according to the fuel and additives technology. In the
transportation industry, it is added to the fuel intake system to improve fuel combustion and the performance of gasoline and jet fuel engines.
The transportation industry is growing, for instance, according to the Organisation Internationale des
Constructeurs d'Automobiles (OICA), in Austria, motor vehicle production
increased from 86,300 units in 2020 to 92,000 units in the year 2021. Moreover,
in 2021, the Government of Quebec and the Government of Canada,
funded US$2 billion in the aerospace industry to drive the recovery of the
sector.
With such increasing production of automobiles and the growing marine and
aerospace sector, it is estimated that in the upcoming years the requirement
for octane boosters in the transportation industry
will rise. Thus, which will boost the growth of the market.
Octane Booster Market Segment Analysis – by Geography
Asia-Pacific region dominated the Octane
Booster Market share by 39% in
the year 2021, due to the increasing requirement for octane boosters in developing countries such as China, Japan,
India and South Korea. China, India and Taiwan are expected to continue their
dominance in the octane booster market
during the forecast period. This is due to the growth of the transportation
industry in the countries. For instance, according to the United Nations Conference on Trade and Development
(UNCTD), China had 4,504 merchant ships in 2019, which reached about 4,603
merchant ships in 2020, with a growth rate of about 2.2%. Moreover, according
to the Indian Brand Equity Foundation (IBEF), domestic air travel demand
continued an upward trend in October 2020, with a 33% increase to 52 lakh
passengers. In June 2020, the Ministry of Civil Aviation approved a capacity
increase of 45% from one-third and it further increased to 60% in September
2020. Thus, the
rising growth in the transportation sector is proving
to be a market booster for the octane booster market size in this
region.
Octane Booster Market Drivers
Increasing Automotive Sector:
In the automotive industry, an Octane Booster is
utilized generally to increase the driving performance of an automobile, in
addition to the fuel intake system. In order to achieve this, the booster enhances
the octane rating that is connected to the stability of the fuel and the
pressure with which the fuel can explode. The automotive industry is growing,
for instance, in 2021, 79.1 million motor vehicles were manufactured globally,
a rise of 1.3% in comparison to 2020, according to the European Automobile
Manufacturers' Association (ACEA). Also, in the U.S., the manufacturing of motor
vehicles increased from 62,39,401 units in 2020 to 68,57,182 units in the year
2021, according to the Organisation Internationale des Constructeurs
d'Automobiles (OICA). With the increasing production of automobiles, it is
estimated that in the upcoming years the requirement for octane boosters in the
automotive industry will rise. Thus, which will boost the growth of the octane
booster industry.
Growing Power Generation Industry:
Octane boosters provide a longer life for machineries such
as power generators, utilized in the power generation industry as it avoids the
damaging effects of detonation, pre-ignition and other undesirable conditions. The power
generation industry is growing. According to Invest India, the Indian
power sector is estimated to attract investments worth US$128.24 to US$135.37 billion
between 2019 and 2023. The future of the sector looks bright by 2026- 2027, as the Indian power generation installed capacity will be close to 620 GW.
Moreover, according to International Trade Administration (ITA), Canada’s total
installed electricity generation capacity was approximately 149 GW in 2021 and
is estimated to increase to 170 GW by 2035.
Thus, such an increase in power generation capacity
is expected to increase the demand for octane boosters to increase the driving performance of
an engine utilized in the power industry,
required for the efficient functioning of power generators used in such power
generation plants. This is expected to propel the growth of the octane booster market in the upcoming years.
Octane Booster Market Challenge
Problems Associated with Octane Booster:
The implementation
of strict rules and regulations by the government bodies on various industrial
applications of octane boosters related to
industrial activities is anticipated to further slow down the octane booster market growth rate. The variations in
environmental mandates and regulations, new regulations set by the governmental
organizations of various countries related to air pollution control, lack of
standardization norms and changes in the demand-supply spectrum due to the
strengthening of rules and regulations will further hamper the market
situation. Thus, the problems associated with octane boosters will create hurdles for the Octane Booster market growth in the forecast period.
Octane Booster Industry Outlook
Technology launches, acquisitions and R&D
activities are key strategies players adopt in the octane
booster market. The top 10 companies in the Octane Booster market are:
- Afton Chemical Limited
- The Dow Chemical Company
- Chevron Corporation
- Exxon Mobil Corporation
- The Lubrizol Corporation
- Innospec Inc.
- JX Holdings, Inc.
- Cestoil Chemical Inc.
- Total S.A.
- Armored AutoGroup, Inc.
Relevant Reports
Report Code: CMR 0126
Report Code: CMR 0528
Report Code: CMR 0034
For more Chemicals and Materials Market reports, please click here
1. Octane Booster Market - Market Overview
1.1 Definitions and Scope
2. Octane Booster Market - Executive Summary
2.1 Key Trends by Type
2.2 Key Trends by Application
2.3 Key Trends by End-use Industry
2.4 Key Trends by Geography
3. Octane Booster Market – Comparative analysis
3.1 Market Share Analysis - Major Companies
3.2 Product Benchmarking - Major Companies
3.3 Top 5 Financials Analysis
3.4 Patent Analysis - Major Companies
3.5 Pricing Analysis (ASPs will be provided)
4. Octane Booster Market - Startup Companies Scenario Premium
4.1 Major startup company analysis:
4.1.1 Investment
4.1.2 Revenue
4.1.3 Product portfolio
4.1.4 Venture Capital and Funding Scenario
5. Octane Booster Market – Market Entry Scenario Premium Premium
5.1 Regulatory Framework Overview
5.2 New Business and Ease of Doing Business Index
5.3 Successful Venture Profiles
5.4 Customer Analysis – Major companies
6. Octane Booster Market - Market Forces
6.1 Market Drivers
6.2 Market Constraints
6.3 Porter's Five Force Model
6.3.1 Bargaining Power of Suppliers
6.3.2 Bargaining Powers of Buyers
6.3.3 Threat of New Entrants
6.3.4 Competitive Rivalry
6.3.5 Threat of Substitutes
7. Octane Booster Market – Strategic Analysis
7.1 Value/Supply Chain Analysis
7.2 Opportunity Analysis
7.3 Product/Market Life Cycle
7.4 Distributor Analysis – Major Companies
8. Octane Booster Market – by Type (Market Size - US$ Million/Billion)
8.1 Organo-Metallic
8.2 Non-Metallic
9. Octane Booster Market – by Application (Market Size - US$ Million/Billion)
9.1 Methylcyclopentadienyl Manganese Tricarbonyl (MMT)
9.2 Ferrocene
9.3 Aromatic Alcohols
9.4 Ethanol
9.5 Others
10 Octane Booster Market – by End-use Industry (Market Size - US$ Million/Billion)
10.1 Transportation
10.1.1 Aerospace
10.1.1.1 Commercial Aircrafts
10.1.1.2 Military Aircrafts
10.1.1.3 Helicopters
10.1.1.4 Others
10.1.2 Marine
10.1.3 Automotive
10.1.3.1 Passenger Vehicles (PV)
10.1.3.2 Light Commercial Vehicles (LCV)
10.1.3.3 Heavy commercial Vehicle (HCV)
10.1.4 Locomotive
10.2 Power Generation
10.3 Industrial
10.4 Others
11 Octane Booster Market - by Geography (Market Size -US$ Million/Billion)
11.1 North America
11.1.1 the U.S.
11.1.2 Canada
11.1.3 Mexico
11.2 Europe
11.2.1 the UK
11.2.2 Germany
11.2.3 France
11.2.4 Italy
11.2.5 Netherlands
11.2.6 Spain
11.2.7 Belgium
11.2.8 Rest of Europe
11.3 Asia-Pacific
11.3.1 China
11.3.2 Japan
11.3.3 India
11.3.4 South Korea
11.3.5 Australia and New Zeeland
11.3.6 Indonesia
11.3.7 Taiwan
11.3.8 Malaysia
11.3.9 Rest of APAC
11.4 South America
11.4.1 Brazil
11.4.2 Argentina
11.4.3 Colombia
11.4.4 Chile
11.4.5 Rest of South America
11.5 Rest of the World
11.5.1 Middle East
11.5.1.1 Saudi Arabia
11.5.1.2 UAE
11.5.1.3 Israel
11.5.1.4 Rest of the Middle East
11.5.2 Africa
11.5.2.1 South Africa
11.5.2.2 Nigeria
11.5.2.3 Rest of Africa
12 Octane Booster Market – Entropy
12.1 New Product Launches
12.2 M&As, Collaborations, JVs and Partnerships
13 Octane Booster Market – Industry/Segment Competition Landscape Premium
13.1 Company Benchmarking Matrix – Major Companies
13.2 Market Share at Global Level - Major companies
13.3 Market Share at Country Level - Major companies
13.4 Market Share by Key Geography - Major companies
13.5 Market Share by Key Application - Major companies
13.6 Market Share by Key Product - Major companies
14 Octane Booster Market – Key Company List by Country Premium Premium
15 Octane Booster Market Company Analysis - Business Overview, Product Portfolio, Financials and Developments
15.1 Company 1
15.2 Company 2
15.3 Company 3
15.4 Company 4
15.5 Company 5
15.6 Company 6
15.7 Company 7
15.8 Company 8
15.9 Company 9
15.10 Company 10 and more
* "Financials would be provided to private companies on best-efforts basis."
Connect with our experts to get customized reports that best suit your requirements. Our reports include global-level data, niche markets and competitive landscape.
List of Tables
Table 1: Octane Booster Market Overview 2019-2024
Table 2: Octane Booster Market Leader Analysis 2018-2019 (US$)
Table 3: Octane Booster Market Product Analysis 2018-2019 (US$)
Table 4: Octane Booster Market End User Analysis 2018-2019 (US$)
Table 5: Octane Booster Market Patent Analysis 2013-2018* (US$)
Table 6: Octane Booster Market Financial Analysis 2018-2019 (US$)
Table 7: Octane Booster Market Driver Analysis 2018-2019 (US$)
Table 8: Octane Booster Market Challenges Analysis 2018-2019 (US$)
Table 9: Octane Booster Market Constraint Analysis 2018-2019 (US$)
Table 10: Octane Booster Market Supplier Bargaining Power Analysis 2018-2019 (US$)
Table 11: Octane Booster Market Buyer Bargaining Power Analysis 2018-2019 (US$)
Table 12: Octane Booster Market Threat of Substitutes Analysis 2018-2019 (US$)
Table 13: Octane Booster Market Threat of New Entrants Analysis 2018-2019 (US$)
Table 14: Octane Booster Market Degree of Competition Analysis 2018-2019 (US$)
Table 15: Octane Booster Market Value Chain Analysis 2018-2019 (US$)
Table 16: Octane Booster Market Pricing Analysis 2019-2024 (US$)
Table 17: Octane Booster Market Opportunities Analysis 2019-2024 (US$)
Table 18: Octane Booster Market Product Life Cycle Analysis 2019-2024 (US$)
Table 19: Octane Booster Market Supplier Analysis 2018-2019 (US$)
Table 20: Octane Booster Market Distributor Analysis 2018-2019 (US$)
Table 21: Octane Booster Market Trend Analysis 2018-2019 (US$)
Table 22: Octane Booster Market Size 2018 (US$)
Table 23: Octane Booster Market Forecast Analysis 2019-2024 (US$)
Table 24: Octane Booster Market Sales Forecast Analysis 2019-2024 (Units)
Table 25: Octane Booster Market, Revenue & Volume, By Type, 2019-2024 ($)
Table 26: Octane Booster Market By Type, Revenue & Volume, By Organ Metallic, 2019-2024 ($)
Table 27: Octane Booster Market By Type, Revenue & Volume, By Non-Metallic, 2019-2024 ($)
Table 28: Octane Booster Market, Revenue & Volume, By Application, 2019-2024 ($)
Table 29: Octane Booster Market By Application, Revenue & Volume, By Alcohols, 2019-2024 ($)
Table 30: Octane Booster Market By Application, Revenue & Volume, By Ethers, 2019-2024 ($)
Table 31: Octane Booster Market, Revenue & Volume, By End Use, 2019-2024 ($)
Table 32: Octane Booster Market By End Use, Revenue & Volume, By Automotive, 2019-2024 ($)
Table 33: Octane Booster Market By End Use, Revenue & Volume, By Aerospace, 2019-2024 ($)
Table 34: Octane Booster Market By End Use, Revenue & Volume, By Industrial machinery, 2019-2024 ($)
Table 35: Octane Booster Market By End Use, Revenue & Volume, By Power Generators, 2019-2024 ($)
Table 36: North America Octane Booster Market, Revenue & Volume, By Type, 2019-2024 ($)
Table 37: North America Octane Booster Market, Revenue & Volume, By Application, 2019-2024 ($)
Table 38: North America Octane Booster Market, Revenue & Volume, By End Use, 2019-2024 ($)
Table 39: South america Octane Booster Market, Revenue & Volume, By Type, 2019-2024 ($)
Table 40: South america Octane Booster Market, Revenue & Volume, By Application, 2019-2024 ($)
Table 41: South america Octane Booster Market, Revenue & Volume, By End Use, 2019-2024 ($)
Table 42: Europe Octane Booster Market, Revenue & Volume, By Type, 2019-2024 ($)
Table 43: Europe Octane Booster Market, Revenue & Volume, By Application, 2019-2024 ($)
Table 44: Europe Octane Booster Market, Revenue & Volume, By End Use, 2019-2024 ($)
Table 45: APAC Octane Booster Market, Revenue & Volume, By Type, 2019-2024 ($)
Table 46: APAC Octane Booster Market, Revenue & Volume, By Application, 2019-2024 ($)
Table 47: APAC Octane Booster Market, Revenue & Volume, By End Use, 2019-2024 ($)
Table 48: Middle East & Africa Octane Booster Market, Revenue & Volume, By Type, 2019-2024 ($)
Table 49: Middle East & Africa Octane Booster Market, Revenue & Volume, By Application, 2019-2024 ($)
Table 50: Middle East & Africa Octane Booster Market, Revenue & Volume, By End Use, 2019-2024 ($)
Table 51: Russia Octane Booster Market, Revenue & Volume, By Type, 2019-2024 ($)
Table 52: Russia Octane Booster Market, Revenue & Volume, By Application, 2019-2024 ($)
Table 53: Russia Octane Booster Market, Revenue & Volume, By End Use, 2019-2024 ($)
Table 54: Israel Octane Booster Market, Revenue & Volume, By Type, 2019-2024 ($)
Table 55: Israel Octane Booster Market, Revenue & Volume, By Application, 2019-2024 ($)
Table 56: Israel Octane Booster Market, Revenue & Volume, By End Use, 2019-2024 ($)
Table 57: Top Companies 2018 (US$)Octane Booster Market, Revenue & Volume
Table 58: Product Launch 2018-2019Octane Booster Market, Revenue & Volume
Table 59: Mergers & Acquistions 2018-2019Octane Booster Market, Revenue & Volume
List of Figures
Figure 1: Overview of Octane Booster Market 2019-2024
Figure 2: Market Share Analysis for Octane Booster Market 2018 (US$)
Figure 3: Product Comparison in Octane Booster Market 2018-2019 (US$)
Figure 4: End User Profile for Octane Booster Market 2018-2019 (US$)
Figure 5: Patent Application and Grant in Octane Booster Market 2013-2018* (US$)
Figure 6: Top 5 Companies Financial Analysis in Octane Booster Market 2018-2019 (US$)
Figure 7: Market Entry Strategy in Octane Booster Market 2018-2019
Figure 8: Ecosystem Analysis in Octane Booster Market 2018
Figure 9: Average Selling Price in Octane Booster Market 2019-2024
Figure 10: Top Opportunites in Octane Booster Market 2018-2019
Figure 11: Market Life Cycle Analysis in Octane Booster Market
Figure 12: GlobalBy TypeOctane Booster Market Revenue, 2019-2024 ($)
Figure 13: GlobalBy ApplicationOctane Booster Market Revenue, 2019-2024 ($)
Figure 14: GlobalBy End UseOctane Booster Market Revenue, 2019-2024 ($)
Figure 15: Global Octane Booster Market - By Geography
Figure 16: Global Octane Booster Market Value & Volume, By Geography, 2019-2024 ($)
Figure 17: Global Octane Booster Market CAGR, By Geography, 2019-2024 (%)
Figure 18: North America Octane Booster Market Value & Volume, 2019-2024 ($)
Figure 19: US Octane Booster Market Value & Volume, 2019-2024 ($)
Figure 20: US GDP and Population, 2018-2019 ($)
Figure 21: US GDP – Composition of 2018, By Sector of Origin
Figure 22: US Export and Import Value & Volume, 2018-2019 ($)
Figure 23: Canada Octane Booster Market Value & Volume, 2019-2024 ($)
Figure 24: Canada GDP and Population, 2018-2019 ($)
Figure 25: Canada GDP – Composition of 2018, By Sector of Origin
Figure 26: Canada Export and Import Value & Volume, 2018-2019 ($)
Figure 27: Mexico Octane Booster Market Value & Volume, 2019-2024 ($)
Figure 28: Mexico GDP and Population, 2018-2019 ($)
Figure 29: Mexico GDP – Composition of 2018, By Sector of Origin
Figure 30: Mexico Export and Import Value & Volume, 2018-2019 ($)
Figure 31: South America Octane Booster Market Value & Volume, 2019-2024 ($)
Figure 32: Brazil Octane Booster Market Value & Volume, 2019-2024 ($)
Figure 33: Brazil GDP and Population, 2018-2019 ($)
Figure 34: Brazil GDP – Composition of 2018, By Sector of Origin
Figure 35: Brazil Export and Import Value & Volume, 2018-2019 ($)
Figure 36: Venezuela Octane Booster Market Value & Volume, 2019-2024 ($)
Figure 37: Venezuela GDP and Population, 2018-2019 ($)
Figure 38: Venezuela GDP – Composition of 2018, By Sector of Origin
Figure 39: Venezuela Export and Import Value & Volume, 2018-2019 ($)
Figure 40: Argentina Octane Booster Market Value & Volume, 2019-2024 ($)
Figure 41: Argentina GDP and Population, 2018-2019 ($)
Figure 42: Argentina GDP – Composition of 2018, By Sector of Origin
Figure 43: Argentina Export and Import Value & Volume, 2018-2019 ($)
Figure 44: Ecuador Octane Booster Market Value & Volume, 2019-2024 ($)
Figure 45: Ecuador GDP and Population, 2018-2019 ($)
Figure 46: Ecuador GDP – Composition of 2018, By Sector of Origin
Figure 47: Ecuador Export and Import Value & Volume, 2018-2019 ($)
Figure 48: Peru Octane Booster Market Value & Volume, 2019-2024 ($)
Figure 49: Peru GDP and Population, 2018-2019 ($)
Figure 50: Peru GDP – Composition of 2018, By Sector of Origin
Figure 51: Peru Export and Import Value & Volume, 2018-2019 ($)
Figure 52: Colombia Octane Booster Market Value & Volume, 2019-2024 ($)
Figure 53: Colombia GDP and Population, 2018-2019 ($)
Figure 54: Colombia GDP – Composition of 2018, By Sector of Origin
Figure 55: Colombia Export and Import Value & Volume, 2018-2019 ($)
Figure 56: Costa Rica Octane Booster Market Value & Volume, 2019-2024 ($)
Figure 57: Costa Rica GDP and Population, 2018-2019 ($)
Figure 58: Costa Rica GDP – Composition of 2018, By Sector of Origin
Figure 59: Costa Rica Export and Import Value & Volume, 2018-2019 ($)
Figure 60: Europe Octane Booster Market Value & Volume, 2019-2024 ($)
Figure 61: U.K Octane Booster Market Value & Volume, 2019-2024 ($)
Figure 62: U.K GDP and Population, 2018-2019 ($)
Figure 63: U.K GDP – Composition of 2018, By Sector of Origin
Figure 64: U.K Export and Import Value & Volume, 2018-2019 ($)
Figure 65: Germany Octane Booster Market Value & Volume, 2019-2024 ($)
Figure 66: Germany GDP and Population, 2018-2019 ($)
Figure 67: Germany GDP – Composition of 2018, By Sector of Origin
Figure 68: Germany Export and Import Value & Volume, 2018-2019 ($)
Figure 69: Italy Octane Booster Market Value & Volume, 2019-2024 ($)
Figure 70: Italy GDP and Population, 2018-2019 ($)
Figure 71: Italy GDP – Composition of 2018, By Sector of Origin
Figure 72: Italy Export and Import Value & Volume, 2018-2019 ($)
Figure 73: France Octane Booster Market Value & Volume, 2019-2024 ($)
Figure 74: France GDP and Population, 2018-2019 ($)
Figure 75: France GDP – Composition of 2018, By Sector of Origin
Figure 76: France Export and Import Value & Volume, 2018-2019 ($)
Figure 77: Netherlands Octane Booster Market Value & Volume, 2019-2024 ($)
Figure 78: Netherlands GDP and Population, 2018-2019 ($)
Figure 79: Netherlands GDP – Composition of 2018, By Sector of Origin
Figure 80: Netherlands Export and Import Value & Volume, 2018-2019 ($)
Figure 81: Belgium Octane Booster Market Value & Volume, 2019-2024 ($)
Figure 82: Belgium GDP and Population, 2018-2019 ($)
Figure 83: Belgium GDP – Composition of 2018, By Sector of Origin
Figure 84: Belgium Export and Import Value & Volume, 2018-2019 ($)
Figure 85: Spain Octane Booster Market Value & Volume, 2019-2024 ($)
Figure 86: Spain GDP and Population, 2018-2019 ($)
Figure 87: Spain GDP – Composition of 2018, By Sector of Origin
Figure 88: Spain Export and Import Value & Volume, 2018-2019 ($)
Figure 89: Denmark Octane Booster Market Value & Volume, 2019-2024 ($)
Figure 90: Denmark GDP and Population, 2018-2019 ($)
Figure 91: Denmark GDP – Composition of 2018, By Sector of Origin
Figure 92: Denmark Export and Import Value & Volume, 2018-2019 ($)
Figure 93: APAC Octane Booster Market Value & Volume, 2019-2024 ($)
Figure 94: China Octane Booster Market Value & Volume, 2019-2024
Figure 95: China GDP and Population, 2018-2019 ($)
Figure 96: China GDP – Composition of 2018, By Sector of Origin
Figure 97: China Export and Import Value & Volume, 2018-2019 ($)Octane Booster Market China Export and Import Value & Volume, 2018-2019 ($)
Figure 98: Australia Octane Booster Market Value & Volume, 2019-2024 ($)
Figure 99: Australia GDP and Population, 2018-2019 ($)
Figure 100: Australia GDP – Composition of 2018, By Sector of Origin
Figure 101: Australia Export and Import Value & Volume, 2018-2019 ($)
Figure 102: South Korea Octane Booster Market Value & Volume, 2019-2024 ($)
Figure 103: South Korea GDP and Population, 2018-2019 ($)
Figure 104: South Korea GDP – Composition of 2018, By Sector of Origin
Figure 105: South Korea Export and Import Value & Volume, 2018-2019 ($)
Figure 106: India Octane Booster Market Value & Volume, 2019-2024 ($)
Figure 107: India GDP and Population, 2018-2019 ($)
Figure 108: India GDP – Composition of 2018, By Sector of Origin
Figure 109: India Export and Import Value & Volume, 2018-2019 ($)
Figure 110: Taiwan Octane Booster Market Value & Volume, 2019-2024 ($)
Figure 111: Taiwan GDP and Population, 2018-2019 ($)
Figure 112: Taiwan GDP – Composition of 2018, By Sector of Origin
Figure 113: Taiwan Export and Import Value & Volume, 2018-2019 ($)
Figure 114: Malaysia Octane Booster Market Value & Volume, 2019-2024 ($)
Figure 115: Malaysia GDP and Population, 2018-2019 ($)
Figure 116: Malaysia GDP – Composition of 2018, By Sector of Origin
Figure 117: Malaysia Export and Import Value & Volume, 2018-2019 ($)
Figure 118: Hong Kong Octane Booster Market Value & Volume, 2019-2024 ($)
Figure 119: Hong Kong GDP and Population, 2018-2019 ($)
Figure 120: Hong Kong GDP – Composition of 2018, By Sector of Origin
Figure 121: Hong Kong Export and Import Value & Volume, 2018-2019 ($)
Figure 122: Middle East & Africa Octane Booster Market Middle East & Africa 3D Printing Market Value & Volume, 2019-2024 ($)
Figure 123: Russia Octane Booster Market Value & Volume, 2019-2024 ($)
Figure 124: Russia GDP and Population, 2018-2019 ($)
Figure 125: Russia GDP – Composition of 2018, By Sector of Origin
Figure 126: Russia Export and Import Value & Volume, 2018-2019 ($)
Figure 127: Israel Octane Booster Market Value & Volume, 2019-2024 ($)
Figure 128: Israel GDP and Population, 2018-2019 ($)
Figure 129: Israel GDP – Composition of 2018, By Sector of Origin
Figure 130: Israel Export and Import Value & Volume, 2018-2019 ($)
Figure 131: Entropy Share, By Strategies, 2018-2019* (%)Octane Booster Market
Figure 132: Developments, 2018-2019*Octane Booster Market
Figure 133: Company 1 Octane Booster Market Net Revenue, By Years, 2018-2019* ($)
Figure 134: Company 1 Octane Booster Market Net Revenue Share, By Business segments, 2018 (%)
Figure 135: Company 1 Octane Booster Market Net Sales Share, By Geography, 2018 (%)
Figure 136: Company 2 Octane Booster Market Net Revenue, By Years, 2018-2019* ($)
Figure 137: Company 2 Octane Booster Market Net Revenue Share, By Business segments, 2018 (%)
Figure 138: Company 2 Octane Booster Market Net Sales Share, By Geography, 2018 (%)
Figure 139: Company 3 Octane Booster Market Net Revenue, By Years, 2018-2019* ($)
Figure 140: Company 3 Octane Booster Market Net Revenue Share, By Business segments, 2018 (%)
Figure 141: Company 3 Octane Booster Market Net Sales Share, By Geography, 2018 (%)
Figure 142: Company 4 Octane Booster Market Net Revenue, By Years, 2018-2019* ($)
Figure 143: Company 4 Octane Booster Market Net Revenue Share, By Business segments, 2018 (%)
Figure 144: Company 4 Octane Booster Market Net Sales Share, By Geography, 2018 (%)
Figure 145: Company 5 Octane Booster Market Net Revenue, By Years, 2018-2019* ($)
Figure 146: Company 5 Octane Booster Market Net Revenue Share, By Business segments, 2018 (%)
Figure 147: Company 5 Octane Booster Market Net Sales Share, By Geography, 2018 (%)
Figure 148: Company 6 Octane Booster Market Net Revenue, By Years, 2018-2019* ($)
Figure 149: Company 6 Octane Booster Market Net Revenue Share, By Business segments, 2018 (%)
Figure 150: Company 6 Octane Booster Market Net Sales Share, By Geography, 2018 (%)
Figure 151: Company 7 Octane Booster Market Net Revenue, By Years, 2018-2019* ($)
Figure 152: Company 7 Octane Booster Market Net Revenue Share, By Business segments, 2018 (%)
Figure 153: Company 7 Octane Booster Market Net Sales Share, By Geography, 2018 (%)
Figure 154: Company 8 Octane Booster Market Net Revenue, By Years, 2018-2019* ($)
Figure 155: Company 8 Octane Booster Market Net Revenue Share, By Business segments, 2018 (%)
Figure 156: Company 8 Octane Booster Market Net Sales Share, By Geography, 2018 (%)
Figure 157: Company 9 Octane Booster Market Net Revenue, By Years, 2018-2019* ($)
Figure 158: Company 9 Octane Booster Market Net Revenue Share, By Business segments, 2018 (%)
Figure 159: Company 9 Octane Booster Market Net Sales Share, By Geography, 2018 (%)
Figure 160: Company 10 Octane Booster Market Net Revenue, By Years, 2018-2019* ($)
Figure 161: Company 10 Octane Booster Market Net Revenue Share, By Business segments, 2018 (%)
Figure 162: Company 10 Octane Booster Market Net Sales Share, By Geography, 2018 (%)
Figure 163: Company 11 Octane Booster Market Net Revenue, By Years, 2018-2019* ($)
Figure 164: Company 11 Octane Booster Market Net Revenue Share, By Business segments, 2018 (%)
Figure 165: Company 11 Octane Booster Market Net Sales Share, By Geography, 2018 (%)
Figure 166: Company 12 Octane Booster Market Net Revenue, By Years, 2018-2019* ($)
Figure 167: Company 12 Octane Booster Market Net Revenue Share, By Business segments, 2018 (%)
Figure 168: Company 12 Octane Booster Market Net Sales Share, By Geography, 2018 (%)
Figure 169: Company 13 Octane Booster Market Net Revenue, By Years, 2018-2019* ($)
Figure 170: Company 13 Octane Booster Market Net Revenue Share, By Business segments, 2018 (%)
Figure 171: Company 13 Octane Booster Market Net Sales Share, By Geography, 2018 (%)
Figure 172: Company 14 Octane Booster Market Net Revenue, By Years, 2018-2019* ($)
Figure 173: Company 14 Octane Booster Market Net Revenue Share, By Business segments, 2018 (%)
Figure 174: Company 14 Octane Booster Market Net Sales Share, By Geography, 2018 (%)
Figure 175: Company 15 Octane Booster Market Net Revenue, By Years, 2018-2019* ($)
Figure 176: Company 15 Octane Booster Market Net Revenue Share, By Business segments, 2018 (%)
Figure 177: Company 15 Octane Booster Market Net Sales Share, By Geography, 2018 (%)