 Email
Email Print
Print


Whey Protein Ingredients Market - Forecast(2024 - 2030)
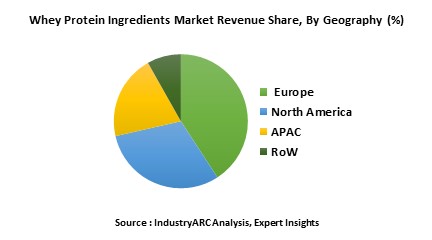
The global Whey protein ingredients Market is estimated to surpass $13.5 billion mark by 2023 growing at an estimated CAGR of more than 6.5% during 2018 to 2023. Europe captures the dominant market share of 40%. Asia-pacific to lead with a projected 4.5% CAGR. Whey protein concentrate dominate the market with a share of 39.3% and estimated to generate a revenue $3,312m by 2023 growing at a CAGR of 8.3%. With increasing demand from food and beverages industry, the demand for whey protein ingredients is also increasing as they provide a concentrated source of protein for enriched nutritional, sensory and functional properties.
What are Whey Protein ingredients?
Whey is considered as a by-product of cheese-making process. It is the fluid that remains after milk has been curdled and strained. Whey proteins contain lactoferrin, natural growth factor, lactoperoxidase, and other minor proteins. Whey proteins includes proteins, minerals, vitamins, lactose, traces of fat. Whey proteins can be classified into three different types which are whey protein concentrate, whey protein isolate and hydrolyzed whey protein.
Whey protein concentrate (WPC) contains lactose of 4-8%, fat, moisture, minerals and has protein concentration that vary between 25-89%. Whey protein isolate (WPI) contains 90-95% of protein and contains little or no lactose and also very low in fat.
What are the major applications for Whey protein ingredients?
They are several potential health benefits with whey protein. Some components can give protection for some types of cancers. Peptides can protect from hypertension and have anti-inflammatory properties. Whey proteins are suitable in sports drinks because they contain amino acids that assist both as an energy source, protein source and for muscle building. Some of the common applications for whey proteins are protein beverages and bars, confectionary and bakery products, nutritional food products, protein bars, protein beverages, sports and medical nutrition products, protein beverages, infant formula, protein supplementation products and others.
Market Research and Market Trends of Whey protein ingredients market
- Arla food ingredients has developed a unique whey protein isolate called crystal clear beverages which are extremely appealing as a tasty and refreshing soft drink. It is a fat free drink with added health claims for bones and muscles. When applied in drink applications, can give a high protein content yet crystal clear.
- The recent trend influencing growth in market is use of whey protein in cancer preventing compounds. Lactoferrin, a protein in whey proteins helps in binding iron, reduce the formation of free radicals and thereby preventing the cell damage and reducing the risk of cancer.
- Arla food ingredients has developed an on trend whey protein iced-coffee concept that can make bone strengthening, muscle building. It’s a source of phosphorous and calcium through the inclusion of capolac milk minerals which helps maintain bone mass and muscles.
- War on sugar, carbohydrate energy is a consumer need in sports nutrition, this trend opens a new market for whey protein. The whey water which is naturally rich in lactose, becomes one attractive alternative to added sugars in water-based sports drinks. Whey permeate replaces electrolytes which contains a small amount of whey peptides which carry additional health benefits.
Who are the Major Players in Whey protein ingreditiens market?
The companies referred in the market research report includes Arla foods amba, Davisco foods international, Milk specialties Global, Glanbia PLC, Hilmar cheese company, Agropur, Fonterra cooperative group, Milk specialties, Westland milk, Agropur industries, Kerry group.
What is our report scope?
The report incorporates in-depth assessment of the competitive landscape, product market sizing, product benchmarking, market trends, product developments, financial analysis, strategic analysis and so on to gauge the impact forces and potential opportunities of the market. Apart from this the report also includes a study of major developments in the market such as product launches, agreements, acquisitions, collaborations, mergers and so on to comprehend the prevailing market dynamics at present and its impact during the forecast period 2018-2024.
All our reports are customizable to your company needs to a certain extent, we do provide 20 free consulting hours along with purchase of each report, and this will allow you to request any additional data to customize the report to your needs.
Key Takeaways from this Report
- Evaluate market potential through analyzing growth rates (CAGR %), Volume (Units) and Value ($M) data given at country level – for product types, end use applications and by different industry verticals.
- Understand the different dynamics influencing the market – key driving factors, challenges and hidden opportunities.
- Get in-depth insights on your competitor performance – market shares, strategies, financial benchmarking, product benchmarking, SWOT and more.
- Analyze the sales and distribution channels across key geographies to improve top-line revenues.
- Understand the industry supply chain with a deep-dive on the value augmentation at each step, in order to optimize value and bring efficiencies in your processes.
- Get a quick outlook on the market entropy – M&A’s, deals, partnerships, product launches of all key players for the past 4 years.
- Evaluate the supply-demand gaps, import-export statistics and regulatory landscape for more than top 20 countries globally for the market.
1. Whey protein ingredients Market Overview
2. Executive Summary
3. Whey protein ingredients Market Landscape
3.1. Market Share Analysis
3.2. Comparative Analysis
3.2.1. Product Benchmarking
3.2.2. End User profiling
3.2.3. Patent Analysis
3.2.4. Top 5 Financials Analysis
4. Whey protein ingredients Market Forces
4.1. Market Drivers
4.2. Market Constraints
4.3. Market Challenges
4.4. Attractiveness of the Industry
4.4.1. Power of Suppliers
4.4.2. Power of Customers
4.4.3. Threat of New entrants
4.4.4. Threat of Substitution
4.4.5. Degree of Competition
5. Whey protein ingredients Market – Strategic Analysis
5.1. Value Chain Analysis
5.2. Pricing Analysis
5.3. Opportunities Analysis
5.4. Product/Market Life Cycle Analysis
5.5. Suppliers and Distributors
6. Whey protein ingredients Market - By Type
6.1. Introduction
6.2. Whey protein concentrate
6.2.1. WPC 35/34
6.2.2. WPC50
6.2.3. WPC65
6.2.4. WPC80
6.3. Whey protein isolate
6.4. Hydrolyzed whey protein
6.5. Demineralized way powder
6.6. Milk protein
7. Whey protein ingredients Market – By Application
7.1. Bakery and confectionary
7.1.1. Baked products
7.1.2. Ice-cream mixes
7.1.3. Dressings
7.1.4. Frozen-desserts
7.1.5. Soups
7.1.6. Sauces
7.1.7. Infant formula
7.2. Beverages
7.2.1. Carbonated
7.2.2. Protein bars
7.2.3. ISO sports drinks
7.2.4. RTD protein drinks
7.2.5. PH beverages
7.3. Sports nutrition
7.4. Infant nutrition
7.5. Meat products and others
8. Whey protein market- By distribution channel
8.1. Supermarket
8.2. Hypermarket
8.3. Specialty stores
8.4. Drug retailers
8.5. E-retailers
9. Whey protein ingredients Substrate Market - By Geography
9.1. North America
9.1.1. U.S.
9.1.2. Canada
9.1.3. Mexico
9.1.4. Rest of North America
9.2. South America
9.2.1. Brazil
9.2.2. Venezuela
9.2.3. Argentina
9.2.4. Ecuador
9.2.5. Peru
9.2.6. Colombia
9.2.7. Costa Rica
9.2.8. Rest of South America
9.3. Europe
9.3.1. U.K
9.3.2. Germany
9.3.3. Italy
9.3.4. France
9.3.5. Netherlands
9.3.6. Belgium
9.3.7. Spain
9.3.8. Denmark
9.3.9. Rest of Europe
9.4. APAC
9.4.1. China
9.4.2. Australia
9.4.3. South Korea
9.4.4. India
9.4.5. Taiwan
9.4.6. Malaysia
9.4.7. Hong Kong
9.4.8. Rest of APAC
9.5. Middle East& Africa
9.5.1. Israel
9.5.2. South Africa
9.5.3. Saudi Arabia
9.6. Rest of Middle East and Africa
10. Market Entropy
10.1. New Product Launches
10.2. M&As, Collaborations, JVs, Partnership
11. Company Profiles (Overview, Financials, SWOT Analysis, Developments, Product Portfolio)
11.1. Arla foods amba
11.2. Davisco foods international
11.3. Milk specialties Global
11.4. Glanbia PLC
11.5. Hilmar cheese company
11.6. Agropur
11.7. Fonterra cooperative group
11.8. Milk specialties
11.9. Westland milk
*More than 10 Companies are profiled in this Research Report*
"*Financials would be provided on a best efforts basis for private companies"
12. Appendix
12.1. Abbreviations
12.2. Sources
12.3. Research Methodology
12.4. Bibliography
12.5. Compilation of Expert Insights
12.6. Disclaimer
List of Tables
Table 1: Whey Protein Ingredients Market Overview 2021-2026
Table 2: Whey Protein Ingredients Market Leader Analysis 2018-2019 (US$)
Table 3: Whey Protein Ingredients Market Product Analysis 2018-2019 (US$)
Table 4: Whey Protein Ingredients Market End User Analysis 2018-2019 (US$)
Table 5: Whey Protein Ingredients Market Patent Analysis 2013-2018* (US$)
Table 6: Whey Protein Ingredients Market Financial Analysis 2018-2019 (US$)
Table 7: Whey Protein Ingredients Market Driver Analysis 2018-2019 (US$)
Table 8: Whey Protein Ingredients Market Challenges Analysis 2018-2019 (US$)
Table 9: Whey Protein Ingredients Market Constraint Analysis 2018-2019 (US$)
Table 10: Whey Protein Ingredients Market Supplier Bargaining Power Analysis 2018-2019 (US$)
Table 11: Whey Protein Ingredients Market Buyer Bargaining Power Analysis 2018-2019 (US$)
Table 12: Whey Protein Ingredients Market Threat of Substitutes Analysis 2018-2019 (US$)
Table 13: Whey Protein Ingredients Market Threat of New Entrants Analysis 2018-2019 (US$)
Table 14: Whey Protein Ingredients Market Degree of Competition Analysis 2018-2019 (US$)
Table 15: Whey Protein Ingredients Market Value Chain Analysis 2018-2019 (US$)
Table 16: Whey Protein Ingredients Market Pricing Analysis 2021-2026 (US$)
Table 17: Whey Protein Ingredients Market Opportunities Analysis 2021-2026 (US$)
Table 18: Whey Protein Ingredients Market Product Life Cycle Analysis 2021-2026 (US$)
Table 19: Whey Protein Ingredients Market Supplier Analysis 2018-2019 (US$)
Table 20: Whey Protein Ingredients Market Distributor Analysis 2018-2019 (US$)
Table 21: Whey Protein Ingredients Market Trend Analysis 2018-2019 (US$)
Table 22: Whey Protein Ingredients Market Size 2018 (US$)
Table 23: Whey Protein Ingredients Market Forecast Analysis 2021-2026 (US$)
Table 24: Whey Protein Ingredients Market Sales Forecast Analysis 2021-2026 (Units)
Table 25: Whey Protein Ingredients Market, Revenue & Volume,By Type, 2021-2026 ($)
Table 26: Whey Protein Ingredients MarketBy Type, Revenue & Volume,Whey Protein IsolateType 1, 2021-2026 ($)
Table 27: Whey Protein Ingredients MarketBy Type, Revenue & Volume,By Whey Protein Hydrolysates, 2021-2026 ($)
Table 28: Whey Protein Ingredients MarketBy Type, Revenue & Volume,By Whey Protein Concentrate, 2021-2026 ($)
Table 29: Whey Protein Ingredients MarketBy Type, Revenue & Volume,By WPC35/34, 2021-2026 ($)
Table 30: Whey Protein Ingredients MarketBy Type, Revenue & Volume,By Demineralised whey powder, 2021-2026 ($)
Table 31: Whey Protein Ingredients Market, Revenue & Volume,By Application, 2021-2026 ($)
Table 32: Whey Protein Ingredients MarketBy Application, Revenue & Volume,By Bakery & Confectionary, 2021-2026 ($)
Table 33: Whey Protein Ingredients MarketBy Application, Revenue & Volume,By Beverages, 2021-2026 ($)
Table 34: Whey Protein Ingredients MarketBy Application, Revenue & Volume,By Meat Products, 2021-2026 ($)
Table 35: Whey Protein Ingredients MarketBy Application, Revenue & Volume,By Dairy Products & Frozen Foods, 2021-2026 ($)
Table 36: Whey Protein Ingredients MarketBy Application, Revenue & Volume,By Sports Nutrition, 2021-2026 ($)
Table 37: North America Whey Protein Ingredients Market, Revenue & Volume,By Type, 2021-2026 ($)
Table 38: North America Whey Protein Ingredients Market, Revenue & Volume,By Application, 2021-2026 ($)
Table 39: South america Whey Protein Ingredients Market, Revenue & Volume,By Type, 2021-2026 ($)
Table 40: South america Whey Protein Ingredients Market, Revenue & Volume,By Application, 2021-2026 ($)
Table 41: Europe Whey Protein Ingredients Market, Revenue & Volume,By Type, 2021-2026 ($)
Table 42: Europe Whey Protein Ingredients Market, Revenue & Volume,By Application, 2021-2026 ($)
Table 43: APAC Whey Protein Ingredients Market, Revenue & Volume,By Type, 2021-2026 ($)
Table 44: APAC Whey Protein Ingredients Market, Revenue & Volume,By Application, 2021-2026 ($)
Table 45: Middle East & Africa Whey Protein Ingredients Market, Revenue & Volume,By Type, 2021-2026 ($)
Table 46: Middle East & Africa Whey Protein Ingredients Market, Revenue & Volume,By Application, 2021-2026 ($)
Table 47: Russia Whey Protein Ingredients Market, Revenue & Volume,By Type, 2021-2026 ($)
Table 48: Russia Whey Protein Ingredients Market, Revenue & Volume,By Application, 2021-2026 ($)
Table 49: Israel Whey Protein Ingredients Market, Revenue & Volume,By Type, 2021-2026 ($)
Table 50: Israel Whey Protein Ingredients Market, Revenue & Volume,By Application, 2021-2026 ($)
Table 51: Top Companies 2018 (US$)Whey Protein Ingredients Market, Revenue & Volume,,
Table 52: Product Launch 2018-2019Whey Protein Ingredients Market, Revenue & Volume,,
Table 53: Mergers & Acquistions 2018-2019Whey Protein Ingredients Market, Revenue & Volume,,
List of Figures
Figure 1: Overview of Whey Protein Ingredients Market 2021-2026
Figure 2: Market Share Analysis for Whey Protein Ingredients Market 2018 (US$)
Figure 3: Product Comparison in Whey Protein Ingredients Market 2018-2019 (US$)
Figure 4: End User Profile for Whey Protein Ingredients Market 2018-2019 (US$)
Figure 5: Patent Application and Grant in Whey Protein Ingredients Market 2013-2018* (US$)
Figure 6: Top 5 Companies Financial Analysis in Whey Protein Ingredients Market 2018-2019 (US$)
Figure 7: Market Entry Strategy in Whey Protein Ingredients Market 2018-2019
Figure 8: Ecosystem Analysis in Whey Protein Ingredients Market2018
Figure 9: Average Selling Price in Whey Protein Ingredients Market 2021-2026
Figure 10: Top Opportunites in Whey Protein Ingredients Market 2018-2019
Figure 11: Market Life Cycle Analysis in Whey Protein Ingredients Market
Figure 12: GlobalBy TypeWhey Protein Ingredients Market Revenue, 2021-2026 ($)
Figure 13: GlobalBy ApplicationWhey Protein Ingredients Market Revenue, 2021-2026 ($)
Figure 14: Global Whey Protein Ingredients Market - By Geography
Figure 15: Global Whey Protein Ingredients Market Value & Volume, By Geography, 2021-2026 ($)
Figure 16: Global Whey Protein Ingredients Market CAGR, By Geography, 2021-2026 (%)
Figure 17: North America Whey Protein Ingredients Market Value & Volume, 2021-2026 ($)
Figure 18: US Whey Protein Ingredients Market Value & Volume, 2021-2026 ($)
Figure 19: US GDP and Population, 2018-2019 ($)
Figure 20: US GDP – Composition of 2018, By Sector of Origin
Figure 21: US Export and Import Value & Volume, 2018-2019 ($)
Figure 22: Canada Whey Protein Ingredients Market Value & Volume, 2021-2026 ($)
Figure 23: Canada GDP and Population, 2018-2019 ($)
Figure 24: Canada GDP – Composition of 2018, By Sector of Origin
Figure 25: Canada Export and Import Value & Volume, 2018-2019 ($)
Figure 26: Mexico Whey Protein Ingredients Market Value & Volume, 2021-2026 ($)
Figure 27: Mexico GDP and Population, 2018-2019 ($)
Figure 28: Mexico GDP – Composition of 2018, By Sector of Origin
Figure 29: Mexico Export and Import Value & Volume, 2018-2019 ($)
Figure 30: South America Whey Protein Ingredients MarketSouth America 3D Printing Market Value & Volume, 2021-2026 ($)
Figure 31: Brazil Whey Protein Ingredients Market Value & Volume, 2021-2026 ($)
Figure 32: Brazil GDP and Population, 2018-2019 ($)
Figure 33: Brazil GDP – Composition of 2018, By Sector of Origin
Figure 34: Brazil Export and Import Value & Volume, 2018-2019 ($)
Figure 35: Venezuela Whey Protein Ingredients Market Value & Volume, 2021-2026 ($)
Figure 36: Venezuela GDP and Population, 2018-2019 ($)
Figure 37: Venezuela GDP – Composition of 2018, By Sector of Origin
Figure 38: Venezuela Export and Import Value & Volume, 2018-2019 ($)
Figure 39: Argentina Whey Protein Ingredients Market Value & Volume, 2021-2026 ($)
Figure 40: Argentina GDP and Population, 2018-2019 ($)
Figure 41: Argentina GDP – Composition of 2018, By Sector of Origin
Figure 42: Argentina Export and Import Value & Volume, 2018-2019 ($)
Figure 43: Ecuador Whey Protein Ingredients Market Value & Volume, 2021-2026 ($)
Figure 44: Ecuador GDP and Population, 2018-2019 ($)
Figure 45: Ecuador GDP – Composition of 2018, By Sector of Origin
Figure 46: Ecuador Export and Import Value & Volume, 2018-2019 ($)
Figure 47: Peru Whey Protein Ingredients Market Value & Volume, 2021-2026 ($)
Figure 48: Peru GDP and Population, 2018-2019 ($)
Figure 49: Peru GDP – Composition of 2018, By Sector of Origin
Figure 50: Peru Export and Import Value & Volume, 2018-2019 ($)
Figure 51: Colombia Whey Protein Ingredients Market Value & Volume, 2021-2026 ($)
Figure 52: Colombia GDP and Population, 2018-2019 ($)
Figure 53: Colombia GDP – Composition of 2018, By Sector of Origin
Figure 54: Colombia Export and Import Value & Volume, 2018-2019 ($)
Figure 55: Costa Rica Whey Protein Ingredients MarketCosta Rica 3D Printing Market Value & Volume, 2021-2026 ($)
Figure 56: Costa Rica GDP and Population, 2018-2019 ($)
Figure 57: Costa Rica GDP – Composition of 2018, By Sector of Origin
Figure 58: Costa Rica Export and Import Value & Volume, 2018-2019 ($)
Figure 59: Europe Whey Protein Ingredients Market Value & Volume, 2021-2026 ($)
Figure 60: U.K Whey Protein Ingredients Market Value & Volume, 2021-2026 ($)
Figure 61: U.K GDP and Population, 2018-2019 ($)
Figure 62: U.K GDP – Composition of 2018, By Sector of Origin
Figure 63: U.K Export and Import Value & Volume, 2018-2019 ($)
Figure 64: Germany Whey Protein Ingredients Market Value & Volume, 2021-2026 ($)
Figure 65: Germany GDP and Population, 2018-2019 ($)
Figure 66: Germany GDP – Composition of 2018, By Sector of Origin
Figure 67: Germany Export and Import Value & Volume, 2018-2019 ($)
Figure 68: Italy Whey Protein Ingredients Market Value & Volume, 2021-2026 ($)
Figure 69: Italy GDP and Population, 2018-2019 ($)
Figure 70: Italy GDP – Composition of 2018, By Sector of Origin
Figure 71: Italy Export and Import Value & Volume, 2018-2019 ($)
Figure 72: France Whey Protein Ingredients Market Value & Volume, 2021-2026 ($)
Figure 73: France GDP and Population, 2018-2019 ($)
Figure 74: France GDP – Composition of 2018, By Sector of Origin
Figure 75: France Export and Import Value & Volume, 2018-2019 ($)
Figure 76: Netherlands Whey Protein Ingredients Market Value & Volume, 2021-2026 ($)
Figure 77: Netherlands GDP and Population, 2018-2019 ($)
Figure 78: Netherlands GDP – Composition of 2018, By Sector of Origin
Figure 79: Netherlands Export and Import Value & Volume, 2018-2019 ($)
Figure 80: Belgium Whey Protein Ingredients Market Value & Volume, 2021-2026 ($)
Figure 81: Belgium GDP and Population, 2018-2019 ($)
Figure 82: Belgium GDP – Composition of 2018, By Sector of Origin
Figure 83: Belgium Export and Import Value & Volume, 2018-2019 ($)
Figure 84: Spain Whey Protein Ingredients Market Value & Volume, 2021-2026 ($)
Figure 85: Spain GDP and Population, 2018-2019 ($)
Figure 86: Spain GDP – Composition of 2018, By Sector of Origin
Figure 87: Spain Export and Import Value & Volume, 2018-2019 ($)
Figure 88: Denmark Whey Protein Ingredients Market Value & Volume, 2021-2026 ($)
Figure 89: Denmark GDP and Population, 2018-2019 ($)
Figure 90: Denmark GDP – Composition of 2018, By Sector of Origin
Figure 91: Denmark Export and Import Value & Volume, 2018-2019 ($)
Figure 92: APAC Whey Protein Ingredients Market Value & Volume, 2021-2026 ($)
Figure 93: China Whey Protein Ingredients MarketValue & Volume, 2021-2026
Figure 94: China GDP and Population, 2018-2019 ($)
Figure 95: China GDP – Composition of 2018, By Sector of Origin
Figure 96: China Export and Import Value & Volume, 2018-2019 ($)Whey Protein Ingredients MarketChina Export and Import Value & Volume, 2018-2019 ($)
Figure 97: Australia Whey Protein Ingredients Market Value & Volume, 2021-2026 ($)
Figure 98: Australia GDP and Population, 2018-2019 ($)
Figure 99: Australia GDP – Composition of 2018, By Sector of Origin
Figure 100: Australia Export and Import Value & Volume, 2018-2019 ($)
Figure 101: South Korea Whey Protein Ingredients Market Value & Volume, 2021-2026 ($)
Figure 102: South Korea GDP and Population, 2018-2019 ($)
Figure 103: South Korea GDP – Composition of 2018, By Sector of Origin
Figure 104: South Korea Export and Import Value & Volume, 2018-2019 ($)
Figure 105: India Whey Protein Ingredients Market Value & Volume, 2021-2026 ($)
Figure 106: India GDP and Population, 2018-2019 ($)
Figure 107: India GDP – Composition of 2018, By Sector of Origin
Figure 108: India Export and Import Value & Volume, 2018-2019 ($)
Figure 109: Taiwan Whey Protein Ingredients MarketTaiwan 3D Printing Market Value & Volume, 2021-2026 ($)
Figure 110: Taiwan GDP and Population, 2018-2019 ($)
Figure 111: Taiwan GDP – Composition of 2018, By Sector of Origin
Figure 112: Taiwan Export and Import Value & Volume, 2018-2019 ($)
Figure 113: Malaysia Whey Protein Ingredients MarketMalaysia 3D Printing Market Value & Volume, 2021-2026 ($)
Figure 114: Malaysia GDP and Population, 2018-2019 ($)
Figure 115: Malaysia GDP – Composition of 2018, By Sector of Origin
Figure 116: Malaysia Export and Import Value & Volume, 2018-2019 ($)
Figure 117: Hong Kong Whey Protein Ingredients MarketHong Kong 3D Printing Market Value & Volume, 2021-2026 ($)
Figure 118: Hong Kong GDP and Population, 2018-2019 ($)
Figure 119: Hong Kong GDP – Composition of 2018, By Sector of Origin
Figure 120: Hong Kong Export and Import Value & Volume, 2018-2019 ($)
Figure 121: Middle East & Africa Whey Protein Ingredients MarketMiddle East & Africa 3D Printing Market Value & Volume, 2021-2026 ($)
Figure 122: Russia Whey Protein Ingredients MarketRussia 3D Printing Market Value & Volume, 2021-2026 ($)
Figure 123: Russia GDP and Population, 2018-2019 ($)
Figure 124: Russia GDP – Composition of 2018, By Sector of Origin
Figure 125: Russia Export and Import Value & Volume, 2018-2019 ($)
Figure 126: Israel Whey Protein Ingredients Market Value & Volume, 2021-2026 ($)
Figure 127: Israel GDP and Population, 2018-2019 ($)
Figure 128: Israel GDP – Composition of 2018, By Sector of Origin
Figure 129: Israel Export and Import Value & Volume, 2018-2019 ($)
Figure 130: Entropy Share, By Strategies, 2018-2019* (%)Whey Protein Ingredients Market
Figure 131: Developments, 2018-2019*Whey Protein Ingredients Market
Figure 132: Company 1 Whey Protein Ingredients Market Net Revenue, By Years, 2018-2019* ($)
Figure 133: Company 1 Whey Protein Ingredients Market Net Revenue Share, By Business segments, 2018 (%)
Figure 134: Company 1 Whey Protein Ingredients Market Net Sales Share, By Geography, 2018 (%)
Figure 135: Company 2 Whey Protein Ingredients Market Net Revenue, By Years, 2018-2019* ($)
Figure 136: Company 2 Whey Protein Ingredients Market Net Revenue Share, By Business segments, 2018 (%)
Figure 137: Company 2 Whey Protein Ingredients Market Net Sales Share, By Geography, 2018 (%)
Figure 138: Company 3Whey Protein Ingredients Market Net Revenue, By Years, 2018-2019* ($)
Figure 139: Company 3Whey Protein Ingredients Market Net Revenue Share, By Business segments, 2018 (%)
Figure 140: Company 3Whey Protein Ingredients Market Net Sales Share, By Geography, 2018 (%)
Figure 141: Company 4 Whey Protein Ingredients Market Net Revenue, By Years, 2018-2019* ($)
Figure 142: Company 4 Whey Protein Ingredients Market Net Revenue Share, By Business segments, 2018 (%)
Figure 143: Company 4 Whey Protein Ingredients Market Net Sales Share, By Geography, 2018 (%)
Figure 144: Company 5 Whey Protein Ingredients Market Net Revenue, By Years, 2018-2019* ($)
Figure 145: Company 5 Whey Protein Ingredients Market Net Revenue Share, By Business segments, 2018 (%)
Figure 146: Company 5 Whey Protein Ingredients Market Net Sales Share, By Geography, 2018 (%)
Figure 147: Company 6 Whey Protein Ingredients Market Net Revenue, By Years, 2018-2019* ($)
Figure 148: Company 6 Whey Protein Ingredients Market Net Revenue Share, By Business segments, 2018 (%)
Figure 149: Company 6 Whey Protein Ingredients Market Net Sales Share, By Geography, 2018 (%)
Figure 150: Company 7 Whey Protein Ingredients Market Net Revenue, By Years, 2018-2019* ($)
Figure 151: Company 7 Whey Protein Ingredients Market Net Revenue Share, By Business segments, 2018 (%)
Figure 152: Company 7 Whey Protein Ingredients Market Net Sales Share, By Geography, 2018 (%)
Figure 153: Company 8 Whey Protein Ingredients Market Net Revenue, By Years, 2018-2019* ($)
Figure 154: Company 8 Whey Protein Ingredients Market Net Revenue Share, By Business segments, 2018 (%)
Figure 155: Company 8 Whey Protein Ingredients Market Net Sales Share, By Geography, 2018 (%)
Figure 156: Company 9 Whey Protein Ingredients Market Net Revenue, By Years, 2018-2019* ($)
Figure 157: Company 9 Whey Protein Ingredients Market Net Revenue Share, By Business segments, 2018 (%)
Figure 158: Company 9 Whey Protein Ingredients Market Net Sales Share, By Geography, 2018 (%)
Figure 159: Company 10 Whey Protein Ingredients Market Net Revenue, By Years, 2018-2019* ($)
Figure 160: Company 10 Whey Protein Ingredients Market Net Revenue Share, By Business segments, 2018 (%)
Figure 161: Company 10 Whey Protein Ingredients Market Net Sales Share, By Geography, 2018 (%)
Figure 162: Company 11 Whey Protein Ingredients Market Net Revenue, By Years, 2018-2019* ($)
Figure 163: Company 11 Whey Protein Ingredients Market Net Revenue Share, By Business segments, 2018 (%)
Figure 164: Company 11 Whey Protein Ingredients Market Net Sales Share, By Geography, 2018 (%)
Figure 165: Company 12 Whey Protein Ingredients Market Net Revenue, By Years, 2018-2019* ($)
Figure 166: Company 12 Whey Protein Ingredients Market Net Revenue Share, By Business segments, 2018 (%)
Figure 167: Company 12 Whey Protein Ingredients Market Net Sales Share, By Geography, 2018 (%)
Figure 168: Company 13Whey Protein Ingredients Market Net Revenue, By Years, 2018-2019* ($)
Figure 169: Company 13Whey Protein Ingredients Market Net Revenue Share, By Business segments, 2018 (%)
Figure 170: Company 13Whey Protein Ingredients Market Net Sales Share, By Geography, 2018 (%)
Figure 171: Company 14 Whey Protein Ingredients Market Net Revenue, By Years, 2018-2019* ($)
Figure 172: Company 14 Whey Protein Ingredients Market Net Revenue Share, By Business segments, 2018 (%)
Figure 173: Company 14 Whey Protein Ingredients Market Net Sales Share, By Geography, 2018 (%)
Figure 174: Company 15 Whey Protein Ingredients Market Net Revenue, By Years, 2018-2019* ($)
Figure 175: Company 15 Whey Protein Ingredients Market Net Revenue Share, By Business segments, 2018 (%)
Figure 176: Company 15 Whey Protein Ingredients Market Net Sales Share, By Geography, 2018 (%)