 Email
Email Print
Print


Microsphere Market Overview
The Microsphere Market size is projected to grow at a CAGR of 8.3% during the forecast period 2022-2027 and reach US$8.1 billion by 2027. Microspheres are primarily composed of various materials which include glass, polymer, chitosan, alginate, fly ash, metal, glycolic acid and other raw materials. They are primarily used in a wide range of industries including construction, healthcare, automotive, cosmetics & personal care, paints & coating and other industries. The expansion of microspheres is primarily driven by their usage in the construction industry. According to recent insights from the World Cement report, the global construction industry output increased by 5.7% in 2021. An increase in construction activities along with the growth of the paints & coating industry is expected to drive the growth of the microsphere market size in the upcoming years. In 2020, the surge in the COVID-19 pandemic negatively impacted construction activities as a result of the country-wise shutdown of construction sites, shortage of labor and the decline of the supply and demand chain all across the world, thus, temporarily affecting the growth of the microsphere industry. However, a steady recovery in new development and construction contracts has been witnessed across many countries around the world since 2021, which in turn, is driving the demand for microspheres.
Microsphere Market Report Coverage
The
"Microsphere Market Report – Forecast (2022-2027)” by IndustryARC,
covers an in-depth analysis of the following segments in the Microsphere Market.
Key Takeaways
- Polymer raw material held a significant share in the Microsphere Market in 2021. Its wide range of characteristics and good chemical resistance made it stand out in comparison to other raw materials in the market.
- Healthcare industry held the largest share in the Microsphere Market in 2021, owing to
the increasing demand for microspheres from the healthcare sector across the
world.
- Asia-Pacific dominated the Microsphere Market in 2021, owing to its increasing demand from the healthcare sector in the region.
- A detailed analysis of strengths, weaknesses, opportunities and threats will be provided in the Microsphere Market Report.
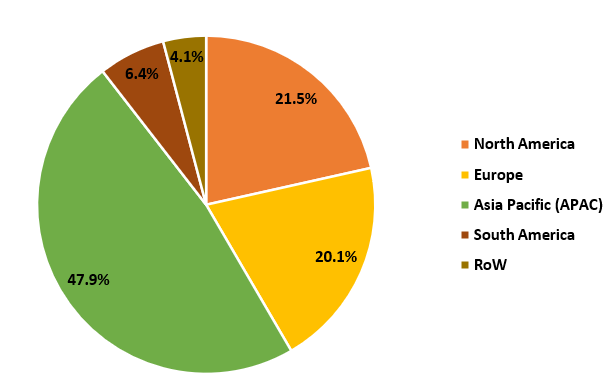
Figure: Microsphere Market Revenue Share, By Geography, 2021 (%)
For More Details On this report - Request For Sample
Microsphere Market Segment Analysis – By Raw Material
The polymer raw
material held a significant Microsphere Market share of over 20% in 2021, owing to a range of characteristics
and benefits they offer over other types of raw materials. Polymer
microsphere offers higher compressive strength, along with better sheer, stress
and heat resistance in comparison to chitosan, alginate, fly
ash and other types of raw materials. Hence, all of these benefits are driving its demand
for use in construction, automotive and other industries. In January 2022, the government of China approved 695 building and
construction projects with a total investment of 3 trillion yuan (US$471
billion). Furthermore, recent insights from Construct Connect state that the
U.S. government has funded around US$20 billion for the construction of a real
estate and development project called One Central project in Chicago. Thus, such surging developments in the construction
sector are expected to increase the demand for polymer microsphere for use in
construction materials thereby driving the market growth during the forecast
period.
Microsphere Market Segment Analysis – By End-use Industry
The Healthcare industry held the largest Microsphere Market share of over 25% in 2021, owing to the increasing demand for microspheres from the healthcare sector across the world. According to the International Trade Administration (ITA), the Mexican medical device market was valued at US$16.80 billion in 2020, representing a significant increase of 10% in comparison to US$15.27 billion in 2019. It further states that the medical device industry in France was valued at US$34.9 billion in 2019. Moreover, the medical device market in Canada was valued at around US$8.6 billion in 2020. Furthermore, according to Vietnam’s Ministry of Health, the pharmaceutical industry is expected to grow at a rate of 10% per year from 2017 to 2028, owing to an increase in pharmaceutical production and sales in the country. Recent insights from the Indian Economic Survey 2021 stated that the Indian domestic pharmaceutical industry is estimated to grow threefold in the next decade. Microspheres composed of polymer, chitosan, alginate, fly ash, metal and more are primarily used in the healthcare industry for multiple applications involving medical devices, drug delivery, active pharmaceutical ingredient (API), nutraceuticals and other applications. Thus, such surging growth of the healthcare industry is expected to expand the microsphere market size during the forecast period.
Microsphere Market Segment Analysis – By Geography
Asia-Pacific held a dominant Microsphere Market share of over 48% in the year 2021. The consumption of microspheres is particularly high in this region due to its increasing demand from the healthcare sector in the region. According to the India Brand Equity Foundation (IBEF), in Union Budget 2022-2023, INR 86,200.65 crore (US$11.28 billion) was allocated to the Ministry of Health and Family Welfare (MoHFW) with the aim of improving the country’s healthcare sectors along with its facilities, products and services. It further states that India ranked 3rd in terms of pharmaceutical production by volume in 2021. The domestic pharmaceutical industry in India includes around 3,000 drug companies and around 10,500 manufacturing units. In addition to this, according to the Government of Japan Ministry of Health, Labor and Welfare (MHLW), the production of pharmaceuticals in Japan was valued at US$87.03 million in 2019, an increase of 39% in comparison to the previous year. Thus, such surging growth of the healthcare sectors in multiple countries across the region is expected to propel the growth of the market during the forecast period.
Microsphere Market Drivers
An increase in construction activities
Construction activities are considered to be the pillar of growth for a country and also play a major role in increasing the overall global economy. The factors such as urbanization and the rapid pace of development to aid the economic growth of the countries are driving the construction activities in multiple regions across the world. For instance, according to Volvo CE, the construction sector saw an increase in construction activities across multiple regions since the fourth quarter of 2020. South America saw an increase of 12%, Asia by 39%, Europe by 20% and China by 28% in 2020. Furthermore, YIT Corporation commenced the construction of numerous residential apartment building projects in Finland, the CEE countries and Russia in December 2021, with total investments of around EUR 200 million (US$236.5 million). The projects are scheduled to be completed by the end of 2023. Thus, an increase in global construction activities is expected to increase the demand for microspheres, owing to their above-mentioned properties. This is anticipated to drive the growth of the market in the upcoming years.
Growth of the paints & coating industry
The use of
microspheres in paints and coatings offers a range of benefits such as improved
flow, increased burnish resistance and hardness, lower viscosity, barrier
effect, gloss control, along with higher resistance to chemical and UV rays.
All of these benefits are driving its demand for use in the paints & coating
industry. For instance, Nippon Paints Group made medium to long-term
investments in 2021 for upgrading and streamlining industrial facilities in
Japan 2021 to 2023 to boost the production of paints and coatings to
secure its position in the market. According to the British Coatings Federation
(BCF), the first 5 months of 2021 achieved significant sales results in both
industrial and decorative coatings in the United Kingdom, owing to strong
consumer demand for DIY commodities such as paints and coatings in the country. Hence, such surging growth of the
paints & coating industry is expected to increase the demand for microspheres,
owing to its above-mentioned benefits. This is expected to accelerate the
growth of the market in the upcoming years.
Microsphere Market Challenge
Fluctuating prices of raw materials may confine the market growth
Some of the raw materials required for the
production of microspheres are obtained from crude oil. As
a result, fluctuations in the prices of crude oil may hinder the growth of the
market. For instance, in
2020, the international benchmark for petroleum prices across the world also
known as Brent crude prices decreased to US$9.12 per barrel, which was the
lowest record since December 10, 1998. Likewise, in April 2020, India’s Crude
Oil Basket (COB) reached US$19.90 per barrel, which was the lowest record since
February 2002. During the first 11 months of the year 2020-21, the average
annual price of India’s COB was around US$42.72 per barrel, which decreased by
30% more than the average COB price in 2019-20. Furthermore, as per revised
estimates for 2020-21, the COB has increased by around 35% from its initial
budget estimate. In this way, such uncertainty
regarding the price of crude oil may affect the prices of raw materials that
are used in the production of microspheres. Thus, such instability and
fluctuating prices of raw materials may limit the growth of the microsphere
industry during the forecast period.
Microsphere Industry Outlook
Technology launches, acquisitions and increased R&D activities are key
strategies adopted by players in the Microsphere Market. The top
companies in the Microsphere Market are:
- 3M
- Potters Industries LLC
- AkzoNobel N.V.
- Matsumoto Yushi-Seiyaku Company
- Trelleborg AB
- Luminex Corporation
- Momentive Performance Materials Inc.
- Chase Corporation
- Sigmund Lindner GmbH
- Mo-Sci Corporation
Recent Developments
- In June 2022, Nouryon launched its new microsphere, Expancel HP9. The newly launched product is primarily designed for use in the manufacturing process involved in the automotive industry, owing to the increasing demand for lightweight materials from automotive manufacturers.
- In April 2021, BASF partnered with Omya with the aim of advancing and commercializing BasoSphere hollow glass microspheres, particularly for use in cementing applications in the oil and gas industry. BasoSphere offers a unique combination of shapes and sizes, along with higher compressive strength and lower density, which makes it ideal for use in such applications.
- In August 2019, Varian acquired the microspheres business of Boston Scientific at US$90 million. The main motive of this acquisition was to expand the company’s product portfolio and strengthen its position in the market.
Relevant Reports
Report Code: CMR 95759
Report Code: CMR 81418
Report Code: CMR 86803
For more Chemicals and Materials Market reports, please click here