 Email
Email Print
Print


3D Scanning market Overview
The global 3D Scanning market is estimated to surpass $16 billion mark by 2030 growing at an estimated CAGR of more than 4.5% during the forecast period 2024 to 2030. 3D scanners emit laser to measure and capture size and shape of free form to generate accurate “cloud points which are then recognized by specialized software on computer for further probe or study. This is suited for probing of contoured surface and complex geometries which require accurate data for study, development, and various other respective purposes. 3D Scanners initially were introduced in large sizes, and with continuous up gradation sizes of these devices are now have shrunk by many fold and can now be handheld.
The 3D Scanning market is the increasing popularity of portable and handheld 3D scanners. Traditional stationary scanners, while highly accurate, are often bulky, expensive, and limited in terms of mobility. In contrast, portable and handheld 3D scanners offer greater flexibility, allowing users to capture objects in diverse environments and hard-to-reach areas with ease.
The integration of AI and ML algorithms to enhance scanning efficiency, accuracy, and processing speed. AI-powered 3D scanners can intelligently analyse scanned data in real-time, automatically detect and correct errors, and optimize scanning parameters to produce high-fidelity 3D models. In December 2022, India's Bureau of Civil Aviation Security (BCAS) announced plans to enforce the installation of 3D computer tomography (CT) scanners at airports across the country, removing the need for travellers to remove electronic gadgets from their hand luggage. The CT scanners, which would provide a three-dimensional image of the things in hand luggage, will speed up airport security check-in.
Report Coverage
The report: “3D Scanning market– Forecast (2024-2030)”, by IndustryARC covers an in-depth analysis of the following segments of the 3D Scanning market.
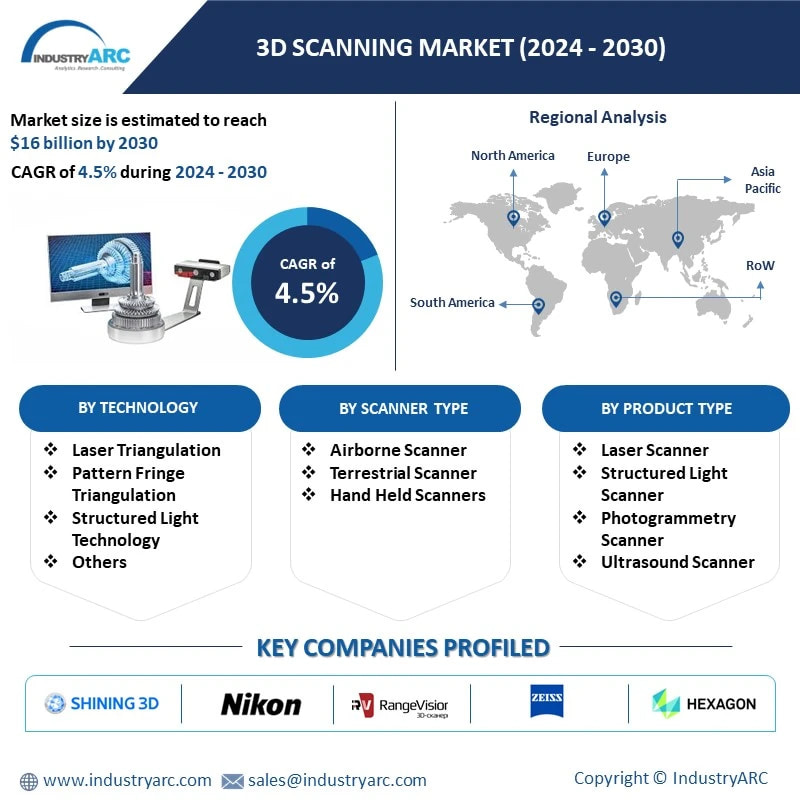
By Technology: Laser Triangulation (Phase Shift, Pulse Based), Pattern Fringe Triangulation, Structured Light Technology and Others
By Range: Short (below 7 feet), Mid( 7 feet- 20 feet), Long(up to 20 feet).
By Buildup System: Hardware, Software.
By Scanner Type: Airborne Scanner, Terrestrial Scanner, Hand Held Scanners.
By Form: Portable, Vehicle Mounted/Integrated, Handheld, Free Standing.
By Product: Laser Scanner, CMM, Structured Light Scanner, Photogrammetry Scanner, Ultrasound Scanner, White Light Scanner, CT Scanner, Optical Scanner, Modulated Light Scanner and Others.
By Application: Reverse Engineering, Inspection, AR and VR, Forensic Investigation, Chemical Structures Formation and Deformation, Rapid Prototyping, Topographical Surveys, Computer Graphics and others.
By End Use Industry: Automotive, Medical, Aerospace, Jewellery, Entertainment, Oil and Gas, Education and Others.
By Geography - North America (U.S, Canada, Mexico), South America(Brazil, Argentina and others), Europe (Germany, UK, France, Italy, Spain, Russia and Others), APAC(China, Japan India, SK, Aus and Others), and RoW (Middle east and Africa).
Key Takeaways
• Increase in research and development in the field of Augmented Reality & Virtual Reality is broadening the scope of 3D Scanner applications aiding the growth of the market.
• 3D scanners are lately witnessing demand from monitoring and maintenance purposes.
• 3D Scanning is trending amongst artists and art historians. The artefacts or subjects are scanned to create reproducible 3D printed versions and for the purpose of archiving them electronically.
3D Scanning market Segment Analysis - By Technology
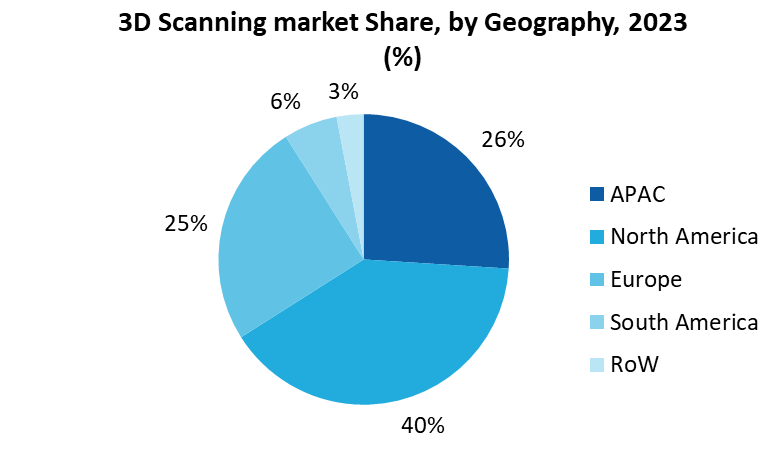
Laser Triangulation has dominated the 3D Scanning market and held a market share of 40% in 2023. 3D Scanners have a range limitation where in all the scanners cannot scan objects at all the distance. Therefore scanners with various ranges like short-range scanners, medium-range scanners and long-range scanners employ different technologies like Laser triangulation, Structured light technology, Pattern fringe technology. Each of these scanners can scan an object up to certain distances like less than 1 meter, between 1 meter to 150 meters and when the distance is more than 2 meters. The technologies employed in these scanners vary depending on the range of the device. Short-range devices use Laser triangulation, structured light technology and pattern fringe triangulation technology whereas for medium-range and long-range devices phase based and pulse based techniques like Terrestrial phase-based laser scanning and Terrestrial time-of-flight laser scanning for long range are being used.
3D Scanning market Segment Analysis - By End Use Industry
The market for the automotive industry is expected to grow with the significant CAGR of 5% during forecast period 2024-2030. Re-engineering is a process in which the products are replicating with respect to the existing products. While re-engineering products, 3D scanners are playing a vital role and used to record precise measure geometry of the entity/product by using lasers or structured light. Millions of data pointers are recorded by the 3D scanners in milliseconds that are known as ‘point-clouds’. Further, the data pointers are used by the 3D software to produce 3D-depiction of a scanned entity for higher enhanced throughput, productivity, inspection, modification and in-depth analysis.
3D Scanning market Segment Analysis - By Geography
North American region dominated the global 3D Scanning market with a share of over 40% in 2023. Huge presence of automotive, medical, architectural and historical industries in the region and increasing scope of 3D scanning application in these areas is fuelling the market growth. The APAC region is poised to grow at a very CAGR of 6% due to the high adoption of 3D scanning, particularly laser scanners for consumer products designing. The increasing innovation in technology and growing awareness regarding the capabilities of 3D scanning are set to propel the adoption. The Europe region is projected to exhibit slow growth as economic uncertainty combined with low growth in manufacturing and automotive sectors hinders the market. The manufacturing sector would further witness huge demand especially from countries such as India, China, and South Korea, given the rising manufacturing sector.
For More Details on This Report - Request for Sample
3D Scanning market Drivers
Growing Miniaturization driving adoption
Earlier, 3D Scanners were large in sizes and cost was high, and therefore, the sales and revenue generated from them was low. This challenged initiated the researchers to develop scanners which were smaller in sizes, and could be manufactured at lower costs. Continuous Research & development has enabled the players not only to decrease the size of the product but also to reduce the cost and achieve economies of scale in manufacturing. This has led to a decline in prices, and has consequently boosting the sales and scope of the market. Furthermore, this has led in gaining popularity amongst the individual users and freelancing programmers and designers.
Risk Mitigation creating new applications for 3D Scanners
Risk mitigation is a cornerstone in ensuring the smooth execution of capital projects. Invariably, challenges arise during project implementation, leading to potential cost overruns or schedule delays, often stemming from insufficient documentation or control procedures. To counter these risks effectively, the adoption of 3D scanning emerges as a strategic solution, particularly in brownfield projects or revamping initiatives, as well as when deploying modular construction methods where adherence to strict schedules is paramount. The utilization of laser scanning technology, specifically, has been pivotal in curbing installation costs by 6-8% and compressing project timelines by up to 10%.
3D Scanning market Challenges
Accuracy and Resolution
Achieving high accuracy and resolution in 3D scanning remains a challenge, especially when capturing intricate details or complex surfaces. Speed and efficiency are also areas of concern, as capturing detailed 3D models of large objects or areas can be time-consuming. Improving the portability and flexibility of 3D scanning solutions, along with addressing interoperability and standardization issues among different systems and file formats, are additional challenges that need attention.
Market Landscape
Product launches, acquisitions, and R&D activities are key strategies adopted by players in the 3D Scanning market. Key companies are:
- Shining 3D
- Nikon
- RangeVision
- Carl-Zeiss
- Hexagon AB
- Ametek
- Keyence Corporation
- Artec3D
- Faro
- Trimble Inc.
Acquisitions/Technology Launches/Partnerships
• September 2022, SHINING 3D, a global leader in 3D technologies ranging from 3D scanning to 3D printing, launched the EINSTAR 3D scanner, a low-cost portable 3D scanner designed to make high-quality 3D data capture accessible to anyone.
• In October 2023, Manufacturing Intelligence, a branch of Hexagon, announced the launching of a new laser scanner for coordinate measuring machines (CMMs) designed for manufacturers seeking a cost-effective choice for more efficient surface measurement and better throughput. The new HP-L-10.10 LITE laser scanner, which focuses on fundamental laser scanning operations, makes it simple and economical for manufacturers to benefit from the measurement speed and coverage of laser scanning.
For more Information and Communications Technology Market reports, please click here
1. 3D Scanning market- Market Overview
1.1 Definitions and Scope
2. 3D Scanning market- Executive Summary
2.1 Market Revenue, Market Size and Key Trends by Company
2.2 Key trends by view
2.3 Key trends segmented by geography
3. 3D Scanning market–Market Landscape
3.1 Comparative Analysis
3.1.1 Product/Company Benchmarking
3.1.2 Top 5 Financial Analysis
3.1.3 Market Value Split by Top 10 companies
3.1.4 Patent Analysis
3.1.5 Pricing Analysis
4.3D Scanning market– Industry Market Entry Scenario Premium (Premium)
4.1 Regulatory Framework Overview
4.2 New Business and Ease of Doing business index
4.3 Case studies of successful ventures
4.4 Customer Analysis – Top 10 companies
5. 3D Scanning market – Startup Company Scenario (Premium)
5.1 Investment Analysis
5.2 Venture Capital Funding Scenario
6. 3D Scanning market- Market Forces
6.1 Market Drivers
6.2 Market Constraints
6.3 Porters five force model
6.3.1 Bargaining power of suppliers
6.3.2 Bargaining powers of customers
6.3.3 Threat of new entrants
6.3.4 Rivalry among existing players
6.3.5 Threat of substitutes
7. 3D Scanning market – By Strategic Analysis (Market Size -$Million/Billion)
7.1 Value Chain Analysis
7.2 Opportunities Analysis
7.3 Product Life Cycle
7.4 Suppliers and Distributors
8. 3D Scanning market- By Technology (Market Size -$Million/Billion)
8.1 Laser Triangulation
8.1.1. Phase Shift
8.1.2. Pulse Based
8.2 Pattern Fringe Triangulation
8.3 Structured Light Technology
8.4 Others
9. 3D Scanning market- By Range (Market Size -$Million/Billion)
9.1 Short (Below 7 feet)
9.2 Mid ( 7 feet – 20 feet)
9.3 Long ( above 20 feet)
10. 3D Scanning market- By Buildup System (Market Size -$Million/Billion)
10.1 Hardware
10.2 Software
11. 3D Scanning market- By Scanner Type (Market Size -$Million/Billion)
11.1 Airborne Scanner
11.2 Terrestrial Scanner
11.3 Hand Held Scanners
12. 3D Scanning market- By Form (Market Size -$Million/Billion)
12.1 Portable
12.2 Vehicle Mounted/Integrated
12.3 Handheld
12.4 Free Standing
13. 3D Scanning market- By Product (Market Size -$Million/Billion)
13.1 Laser Scanner
13.2 coordinate measuring machine (CMM)
13.3 Structured Light Scanner
13.4 Photogrammetry Scanner
13.5 Ultrasound Scanner
13.6 White Light Scanner
13.7 CT Scanner
13.8 Optical Scanner
13.9 Modulated Light Scanner
13.10 Others
14. 3D Scanning market- By Application (Market Size -$Million/Billion)
14.1 Reverse Engineering
14.2 Inspection
14.3 AR and VR
14.4 Forensic Investigation
14.5 Chemical Structures Formation and Deformation
14.6 Rapid Prototyping
14.7 Topographical Surveys
14.8 Computer Graphics
14.9 others.
15. 3D Scanning market- By End Use Industry (Market Size -$Million/Billion)
15.1 Automotive
15.2 Medical
15.3 Aerospace
15.4 Jewellery
15.5 Entertainment
15.6 Oil and Gas
15.7 Education
15.8 Others
16. 3D Scanning market - By Geography (Market Size -$Million/Billion)
16.1 North America
16.1.1 U.S.
16.1.2 Canada
16.1.3 Mexico
16.2 South America
16.2.1 Brazil
16.2.2 Argentina
16.2.3 Colombia
16.2.4 Chile
16.2.5 Rest of South America
16.3 Europe
16.3.1 U.K.
16.3.2 Germany
16.3.3 Italy
16.3.4 France
16.3.5 Netherlands
16.3.6 Belgium
16.3.7 Russia
16.3.8 Spain
16.3.9 Rest of Europe
16.4 APAC
16.4.1 China
16.4.2 India
16.4.3 Japan
16.4.4 South Korea
16.4.5 Australia
16.4.6 Taiwan
16.4.7 Malaysia
16.4.8 Hong kong
16.4.9 Rest of APAC
16.5 RoW
16.5.1 Middle East
16.5.1.1.1 Saudi Arabia
16.5.1.1.2 UAE
16.5.2 Israel
16.5.3 Rest of Middle East
16.5.4 Africa
16.5.5 South Africa
16.5.6 Nigeria
16.5.7 Rest of Africa
17. 3D Scanning market- Entropy
18. 3D Scanning market- Industry Competition Landscape (Premium)
18.1 Market Share by Global
18.2 Market Share by Country
18.3 Market Share By Product Type
19. 3D Scanning market- Key Company List by Country Premium (Premium)
20. 3D Scanning market Company Analysis
20.1 Shining 3D
20.2 Nikon
20.3 RangeVision
20.4 Carl-Zeiss
20.5 Hexagon AB
20.6 Ametek
20.7 Keyence Corporation
20.8 Artec3D
20.9 Faro
20.10 Trimble Inc.
List of Tables:
Table 1: 3D Scanning Market Overview 2021-2026
Table 2: 3D Scanning Market Leader Analysis 2018-2019 (US$)
Table 3: 3D Scanning Market Product Analysis 2018-2019 (US$)
Table 4: 3D Scanning Market End User Analysis 2018-2019 (US$)
Table 5: 3D Scanning Market Patent Analysis 2013-2018* (US$)
Table 6: 3D Scanning Market Financial Analysis 2018-2019 (US$)
Table 7: 3D Scanning Market Driver Analysis 2018-2019 (US$)
Table 8: 3D Scanning Market Challenges Analysis 2018-2019 (US$)
Table 9: 3D Scanning Market Constraint Analysis 2018-2019 (US$)
Table 10: 3D Scanning Market Supplier Bargaining Power Analysis 2018-2019 (US$)
Table 11: 3D Scanning Market Buyer Bargaining Power Analysis 2018-2019 (US$)
Table 12: 3D Scanning Market Threat of Substitutes Analysis 2018-2019 (US$)
Table 13: 3D Scanning Market Threat of New Entrants Analysis 2018-2019 (US$)
Table 14: 3D Scanning Market Degree of Competition Analysis 2018-2019 (US$)
Table 15: 3D Scanning Market Value Chain Analysis 2018-2019 (US$)
Table 16: 3D Scanning Market Pricing Analysis 2021-2026 (US$)
Table 17: 3D Scanning Market Opportunities Analysis 2021-2026 (US$)
Table 18: 3D Scanning Market Product Life Cycle Analysis 2021-2026 (US$)
Table 19: 3D Scanning Market Supplier Analysis 2018-2019 (US$)
Table 20: 3D Scanning Market Distributor Analysis 2018-2019 (US$)
Table 21: 3D Scanning Market Trend Analysis 2018-2019 (US$)
Table 22: 3D Scanning Market Size 2018 (US$)
Table 23: 3D Scanning Market Forecast Analysis 2021-2026 (US$)
Table 24: 3D Scanning Market Sales Forecast Analysis 2021-2026 (Units)
Table 25: 3D Scanning Market , Revenue & Volume, By Type, 2021-2026 ($)
Table 26: 3D Scanning Market By Type, Revenue & Volume, By Hardware, 2021-2026 ($)
Table 27: 3D Scanning Market By Type, Revenue & Volume, By Software, 2021-2026 ($)
Table 28: 3D Scanning Market By Type, Revenue & Volume, By Services, 2021-2026 ($)
Table 29: 3D Scanning Market , Revenue & Volume, By Technology Type, 2021-2026 ($)
Table 30: 3D Scanning Market By Technology Type, Revenue & Volume, By Laser Scanners, 2021-2026 ($)
Table 31: 3D Scanning Market By Technology Type, Revenue & Volume, By Structured Light Scanners, 2021-2026 ($)
Table 32: 3D Scanning Market By Technology Type, Revenue & Volume, By Optical Scanners, 2021-2026 ($)
Table 33: 3D Scanning Market By Technology Type, Revenue & Volume, By Machine Vision Devices, 2021-2026 ($)
Table 34: 3D Scanning Market By Technology Type, Revenue & Volume, By White Light Scanning Devices, 2021-2026 ($)
Table 35: 3D Scanning Market , Revenue & Volume, By Scanning Range, 2021-2026 ($)
Table 36: 3D Scanning Market By Scanning Range, Revenue & Volume, By Short Range Scanner (<1 Meter), 2021-2026 ($)
Table 37: 3D Scanning Market By Scanning Range, Revenue & Volume, By Mid-Range Scanner (>1 Meter and <150 Meter), 2021-2026 ($)
Table 38: 3D Scanning Market By Scanning Range, Revenue & Volume, By Long Range Scanner (>2 Meter), 2021-2026 ($)
Table 39: 3D Scanning Market , Revenue & Volume, By End Use Application, 2021-2026 ($)
Table 40: 3D Scanning Market By End Use Application, Revenue & Volume, By Reverse Engineering, 2021-2026 ($)
Table 41: 3D Scanning Market By End Use Application, Revenue & Volume, By Quality Inspection, 2021-2026 ($)
Table 42: 3D Scanning Market By End Use Application, Revenue & Volume, By Rapid Prototyping, 2021-2026 ($)
Table 43: 3D Scanning Market By End Use Application, Revenue & Volume, By Digital Preservation, 2021-2026 ($)
Table 44: 3D Scanning Market By End Use Application, Revenue & Volume, By Augmented Reality, 2021-2026 ($)
Table 45: 3D Scanning Market , Revenue & Volume, By End User Industry, 2021-2026 ($)
Table 46: 3D Scanning Market By End User Industry, Revenue & Volume, By Aerospace & Defense, 2021-2026 ($)
Table 47: 3D Scanning Market By End User Industry, Revenue & Volume, By Marine (Sonar Bases 3D Scanner Market ), 2021-2026 ($)
Table 48: 3D Scanning Market By End User Industry, Revenue & Volume, By Healthcare, 2021-2026 ($)
Table 49: 3D Scanning Market By End User Industry, Revenue & Volume, By Industrial Engineering, 2021-2026 ($)
Table 50: 3D Scanning Market By End User Industry, Revenue & Volume, By Automotive, 2021-2026 ($)
Table 51: North America 3D Scanning Market , Revenue & Volume, By Type, 2021-2026 ($)
Table 52: North America 3D Scanning Market , Revenue & Volume, By Technology Type, 2021-2026 ($)
Table 53: North America 3D Scanning Market , Revenue & Volume, By Scanning Range, 2021-2026 ($)
Table 54: North America 3D Scanning Market , Revenue & Volume, By End Use Application, 2021-2026 ($)
Table 55: North America 3D Scanning Market , Revenue & Volume, By End User Industry, 2021-2026 ($)
Table 56: South america 3D Scanning Market , Revenue & Volume, By Type, 2021-2026 ($)
Table 57: South america 3D Scanning Market , Revenue & Volume, By Technology Type, 2021-2026 ($)
Table 58: South america 3D Scanning Market , Revenue & Volume, By Scanning Range, 2021-2026 ($)
Table 59: South america 3D Scanning Market , Revenue & Volume, By End Use Application, 2021-2026 ($)
Table 60: South america 3D Scanning Market , Revenue & Volume, By End User Industry, 2021-2026 ($)
Table 61: Europe 3D Scanning Market , Revenue & Volume, By Type, 2021-2026 ($)
Table 62: Europe 3D Scanning Market , Revenue & Volume, By Technology Type, 2021-2026 ($)
Table 63: Europe 3D Scanning Market , Revenue & Volume, By Scanning Range, 2021-2026 ($)
Table 64: Europe 3D Scanning Market , Revenue & Volume, By End Use Application, 2021-2026 ($)
Table 65: Europe 3D Scanning Market , Revenue & Volume, By End User Industry, 2021-2026 ($)
Table 66: APAC 3D Scanning Market , Revenue & Volume, By Type, 2021-2026 ($)
Table 67: APAC 3D Scanning Market , Revenue & Volume, By Technology Type, 2021-2026 ($)
Table 68: APAC 3D Scanning Market , Revenue & Volume, By Scanning Range, 2021-2026 ($)
Table 69: APAC 3D Scanning Market , Revenue & Volume, By End Use Application, 2021-2026 ($)
Table 70: APAC 3D Scanning Market , Revenue & Volume, By End User Industry, 2021-2026 ($)
Table 71: Middle East & Africa 3D Scanning Market , Revenue & Volume, By Type, 2021-2026 ($)
Table 72: Middle East & Africa 3D Scanning Market , Revenue & Volume, By Technology Type, 2021-2026 ($)
Table 73: Middle East & Africa 3D Scanning Market , Revenue & Volume, By Scanning Range, 2021-2026 ($)
Table 74: Middle East & Africa 3D Scanning Market , Revenue & Volume, By End Use Application, 2021-2026 ($)
Table 75: Middle East & Africa 3D Scanning Market , Revenue & Volume, By End User Industry, 2021-2026 ($)
Table 76: Russia 3D Scanning Market , Revenue & Volume, By Type, 2021-2026 ($)
Table 77: Russia 3D Scanning Market , Revenue & Volume, By Technology Type, 2021-2026 ($)
Table 78: Russia 3D Scanning Market , Revenue & Volume, By Scanning Range, 2021-2026 ($)
Table 79: Russia 3D Scanning Market , Revenue & Volume, By End Use Application, 2021-2026 ($)
Table 80: Russia 3D Scanning Market , Revenue & Volume, By End User Industry, 2021-2026 ($)
Table 81: Israel 3D Scanning Market , Revenue & Volume, By Type, 2021-2026 ($)
Table 82: Israel 3D Scanning Market , Revenue & Volume, By Technology Type, 2021-2026 ($)
Table 83: Israel 3D Scanning Market , Revenue & Volume, By Scanning Range, 2021-2026 ($)
Table 84: Israel 3D Scanning Market , Revenue & Volume, By End Use Application, 2021-2026 ($)
Table 85: Israel 3D Scanning Market , Revenue & Volume, By End User Industry, 2021-2026 ($)
Table 86: Top Companies 2018 (US$) 3D Scanning Market , Revenue & Volume
Table 87: Product Launch 2018-2019 3D Scanning Market , Revenue & Volume
Table 88: Mergers & Acquistions 2018-2019 3D Scanning Market , Revenue & Volume
List of Figures:
Figure 1: Overview of 3D Scanning Market 2021-2026
Figure 2: Market Share Analysis for 3D Scanning Market 2018 (US$)
Figure 3: Product Comparison in 3D Scanning Market 2018-2019 (US$)
Figure 4: End User Profile for 3D Scanning Market 2018-2019 (US$)
Figure 5: Patent Application and Grant in 3D Scanning Market 2013-2018* (US$)
Figure 6: Top 5 Companies Financial Analysis in 3D Scanning Market 2018-2019 (US$)
Figure 7: Market Entry Strategy in 3D Scanning Market 2018-2019
Figure 8: Ecosystem Analysis in 3D Scanning Market 2018
Figure 9: Average Selling Price in 3D Scanning Market 2021-2026
Figure 10: Top Opportunites in 3D Scanning Market 2018-2019
Figure 11: Market Life Cycle Analysis in 3D Scanning Market
Figure 12: GlobalBy Type 3D Scanning Market Revenue, 2021-2026 ($)
Figure 13: GlobalBy Technology Type 3D Scanning Market Revenue, 2021-2026 ($)
Figure 14: GlobalBy Scanning Range 3D Scanning Market Revenue, 2021-2026 ($)
Figure 15: GlobalBy End Use Application 3D Scanning Market Revenue, 2021-2026 ($)
Figure 16: GlobalBy End User Industry 3D Scanning Market Revenue, 2021-2026 ($)
Figure 17: Global 3D Scanning Market - By Geography
Figure 18: Global 3D Scanning Market Value & Volume, By Geography, 2021-2026 ($)
Figure 19: Global 3D Scanning Market CAGR, By Geography, 2021-2026 (%)
Figure 20: North America 3D Scanning Market Value & Volume, 2021-2026 ($)
Figure 21: US 3D Scanning Market Value & Volume, 2021-2026 ($)
Figure 22: US GDP and Population, 2018-2019 ($)
Figure 23: US GDP – Composition of 2018, By Sector of Origin
Figure 24: US Export and Import Value & Volume, 2018-2019 ($)
Figure 25: Canada 3D Scanning Market Value & Volume, 2021-2026 ($)
Figure 26: Canada GDP and Population, 2018-2019 ($)
Figure 27: Canada GDP – Composition of 2018, By Sector of Origin
Figure 28: Canada Export and Import Value & Volume, 2018-2019 ($)
Figure 29: Mexico 3D Scanning Market Value & Volume, 2021-2026 ($)
Figure 30: Mexico GDP and Population, 2018-2019 ($)
Figure 31: Mexico GDP – Composition of 2018, By Sector of Origin
Figure 32: Mexico Export and Import Value & Volume, 2018-2019 ($)
Figure 33: South America 3D Scanning Market Value & Volume, 2021-2026 ($)
Figure 34: Brazil 3D Scanning Market Value & Volume, 2021-2026 ($)
Figure 35: Brazil GDP and Population, 2018-2019 ($)
Figure 36: Brazil GDP – Composition of 2018, By Sector of Origin
Figure 37: Brazil Export and Import Value & Volume, 2018-2019 ($)
Figure 38: Venezuela 3D Scanning Market Value & Volume, 2021-2026 ($)
Figure 39: Venezuela GDP and Population, 2018-2019 ($)
Figure 40: Venezuela GDP – Composition of 2018, By Sector of Origin
Figure 41: Venezuela Export and Import Value & Volume, 2018-2019 ($)
Figure 42: Argentina 3D Scanning Market Value & Volume, 2021-2026 ($)
Figure 43: Argentina GDP and Population, 2018-2019 ($)
Figure 44: Argentina GDP – Composition of 2018, By Sector of Origin
Figure 45: Argentina Export and Import Value & Volume, 2018-2019 ($)
Figure 46: Ecuador 3D Scanning Market Value & Volume, 2021-2026 ($)
Figure 47: Ecuador GDP and Population, 2018-2019 ($)
Figure 48: Ecuador GDP – Composition of 2018, By Sector of Origin
Figure 49: Ecuador Export and Import Value & Volume, 2018-2019 ($)
Figure 50: Peru 3D Scanning Market Value & Volume, 2021-2026 ($)
Figure 51: Peru GDP and Population, 2018-2019 ($)
Figure 52: Peru GDP – Composition of 2018, By Sector of Origin
Figure 53: Peru Export and Import Value & Volume, 2018-2019 ($)
Figure 54: Colombia 3D Scanning Market Value & Volume, 2021-2026 ($)
Figure 55: Colombia GDP and Population, 2018-2019 ($)
Figure 56: Colombia GDP – Composition of 2018, By Sector of Origin
Figure 57: Colombia Export and Import Value & Volume, 2018-2019 ($)
Figure 58: Costa Rica 3D Scanning Market Value & Volume, 2021-2026 ($)
Figure 59: Costa Rica GDP and Population, 2018-2019 ($)
Figure 60: Costa Rica GDP – Composition of 2018, By Sector of Origin
Figure 61: Costa Rica Export and Import Value & Volume, 2018-2019 ($)
Figure 62: Europe 3D Scanning Market Value & Volume, 2021-2026 ($)
Figure 63: U.K 3D Scanning Market Value & Volume, 2021-2026 ($)
Figure 64: U.K GDP and Population, 2018-2019 ($)
Figure 65: U.K GDP – Composition of 2018, By Sector of Origin
Figure 66: U.K Export and Import Value & Volume, 2018-2019 ($)
Figure 67: Germany 3D Scanning Market Value & Volume, 2021-2026 ($)
Figure 68: Germany GDP and Population, 2018-2019 ($)
Figure 69: Germany GDP – Composition of 2018, By Sector of Origin
Figure 70: Germany Export and Import Value & Volume, 2018-2019 ($)
Figure 71: Italy 3D Scanning Market Value & Volume, 2021-2026 ($)
Figure 72: Italy GDP and Population, 2018-2019 ($)
Figure 73: Italy GDP – Composition of 2018, By Sector of Origin
Figure 74: Italy Export and Import Value & Volume, 2018-2019 ($)
Figure 75: France 3D Scanning Market Value & Volume, 2021-2026 ($)
Figure 76: France GDP and Population, 2018-2019 ($)
Figure 77: France GDP – Composition of 2018, By Sector of Origin
Figure 78: France Export and Import Value & Volume, 2018-2019 ($)
Figure 79: Netherlands 3D Scanning Market Value & Volume, 2021-2026 ($)
Figure 80: Netherlands GDP and Population, 2018-2019 ($)
Figure 81: Netherlands GDP – Composition of 2018, By Sector of Origin
Figure 82: Netherlands Export and Import Value & Volume, 2018-2019 ($)
Figure 83: Belgium 3D Scanning Market Value & Volume, 2021-2026 ($)
Figure 84: Belgium GDP and Population, 2018-2019 ($)
Figure 85: Belgium GDP – Composition of 2018, By Sector of Origin
Figure 86: Belgium Export and Import Value & Volume, 2018-2019 ($)
Figure 87: Spain 3D Scanning Market Value & Volume, 2021-2026 ($)
Figure 88: Spain GDP and Population, 2018-2019 ($)
Figure 89: Spain GDP – Composition of 2018, By Sector of Origin
Figure 90: Spain Export and Import Value & Volume, 2018-2019 ($)
Figure 91: Denmark 3D Scanning Market Value & Volume, 2021-2026 ($)
Figure 92: Denmark GDP and Population, 2018-2019 ($)
Figure 93: Denmark GDP – Composition of 2018, By Sector of Origin
Figure 94: Denmark Export and Import Value & Volume, 2018-2019 ($)
Figure 95: APAC 3D Scanning Market Value & Volume, 2021-2026 ($)
Figure 96: China 3D Scanning Market Value & Volume, 2021-2026
Figure 97: China GDP and Population, 2018-2019 ($)
Figure 98: China GDP – Composition of 2018, By Sector of Origin
Figure 99: China Export and Import Value & Volume, 2018-2019 ($) 3D Scanning Market China Export and Import Value & Volume, 2018-2019 ($)
Figure 100: Australia 3D Scanning Market Value & Volume, 2021-2026 ($)
Figure 101: Australia GDP and Population, 2018-2019 ($)
Figure 102: Australia GDP – Composition of 2018, By Sector of Origin
Figure 103: Australia Export and Import Value & Volume, 2018-2019 ($)
Figure 104: South Korea 3D Scanning Market Value & Volume, 2021-2026 ($)
Figure 105: South Korea GDP and Population, 2018-2019 ($)
Figure 106: South Korea GDP – Composition of 2018, By Sector of Origin
Figure 107: South Korea Export and Import Value & Volume, 2018-2019 ($)
Figure 108: India 3D Scanning Market Value & Volume, 2021-2026 ($)
Figure 109: India GDP and Population, 2018-2019 ($)
Figure 110: India GDP – Composition of 2018, By Sector of Origin
Figure 111: India Export and Import Value & Volume, 2018-2019 ($)
Figure 112: Taiwan 3D Scanning Market Value & Volume, 2021-2026 ($)
Figure 113: Taiwan GDP and Population, 2018-2019 ($)
Figure 114: Taiwan GDP – Composition of 2018, By Sector of Origin
Figure 115: Taiwan Export and Import Value & Volume, 2018-2019 ($)
Figure 116: Malaysia 3D Scanning Market Value & Volume, 2021-2026 ($)
Figure 117: Malaysia GDP and Population, 2018-2019 ($)
Figure 118: Malaysia GDP – Composition of 2018, By Sector of Origin
Figure 119: Malaysia Export and Import Value & Volume, 2018-2019 ($)
Figure 120: Hong Kong 3D Scanning Market Value & Volume, 2021-2026 ($)
Figure 121: Hong Kong GDP and Population, 2018-2019 ($)
Figure 122: Hong Kong GDP – Composition of 2018, By Sector of Origin
Figure 123: Hong Kong Export and Import Value & Volume, 2018-2019 ($)
Figure 124: Middle East & Africa 3D Scanning Market Middle East & Africa 3D Printing Market Value & Volume, 2021-2026 ($)
Figure 125: Russia 3D Scanning Market Value & Volume, 2021-2026 ($)
Figure 126: Russia GDP and Population, 2018-2019 ($)
Figure 127: Russia GDP – Composition of 2018, By Sector of Origin
Figure 128: Russia Export and Import Value & Volume, 2018-2019 ($)
Figure 129: Israel 3D Scanning Market Value & Volume, 2021-2026 ($)
Figure 130: Israel GDP and Population, 2018-2019 ($)
Figure 131: Israel GDP – Composition of 2018, By Sector of Origin
Figure 132: Israel Export and Import Value & Volume, 2018-2019 ($)
Figure 133: Entropy Share, By Strategies, 2018-2019* (%) 3D Scanning Market
Figure 134: Developments, 2018-2019* 3D Scanning Market
Figure 135: Company 1 3D Scanning Market Net Revenue, By Years, 2018-2019* ($)
Figure 136: Company 1 3D Scanning Market Net Revenue Share, By Business segments, 2018 (%)
Figure 137: Company 1 3D Scanning Market Net Sales Share, By Geography, 2018 (%)
Figure 138: Company 2 3D Scanning Market Net Revenue, By Years, 2018-2019* ($)
Figure 139: Company 2 3D Scanning Market Net Revenue Share, By Business segments, 2018 (%)
Figure 140: Company 2 3D Scanning Market Net Sales Share, By Geography, 2018 (%)
Figure 141: Company 3 3D Scanning Market Net Revenue, By Years, 2018-2019* ($)
Figure 142: Company 3 3D Scanning Market Net Revenue Share, By Business segments, 2018 (%)
Figure 143: Company 3 3D Scanning Market Net Sales Share, By Geography, 2018 (%)
Figure 144: Company 4 3D Scanning Market Net Revenue, By Years, 2018-2019* ($)
Figure 145: Company 4 3D Scanning Market Net Revenue Share, By Business segments, 2018 (%)
Figure 146: Company 4 3D Scanning Market Net Sales Share, By Geography, 2018 (%)
Figure 147: Company 5 3D Scanning Market Net Revenue, By Years, 2018-2019* ($)
Figure 148: Company 5 3D Scanning Market Net Revenue Share, By Business segments, 2018 (%)
Figure 149: Company 5 3D Scanning Market Net Sales Share, By Geography, 2018 (%)
Figure 150: Company 6 3D Scanning Market Net Revenue, By Years, 2018-2019* ($)
Figure 151: Company 6 3D Scanning Market Net Revenue Share, By Business segments, 2018 (%)
Figure 152: Company 6 3D Scanning Market Net Sales Share, By Geography, 2018 (%)
Figure 153: Company 7 3D Scanning Market Net Revenue, By Years, 2018-2019* ($)
Figure 154: Company 7 3D Scanning Market Net Revenue Share, By Business segments, 2018 (%)
Figure 155: Company 7 3D Scanning Market Net Sales Share, By Geography, 2018 (%)
Figure 156: Company 8 3D Scanning Market Net Revenue, By Years, 2018-2019* ($)
Figure 157: Company 8 3D Scanning Market Net Revenue Share, By Business segments, 2018 (%)
Figure 158: Company 8 3D Scanning Market Net Sales Share, By Geography, 2018 (%)
Figure 159: Company 9 3D Scanning Market Net Revenue, By Years, 2018-2019* ($)
Figure 160: Company 9 3D Scanning Market Net Revenue Share, By Business segments, 2018 (%)
Figure 161: Company 9 3D Scanning Market Net Sales Share, By Geography, 2018 (%)
Figure 162: Company 10 3D Scanning Market Net Revenue, By Years, 2018-2019* ($)
Figure 163: Company 10 3D Scanning Market Net Revenue Share, By Business segments, 2018 (%)
Figure 164: Company 10 3D Scanning Market Net Sales Share, By Geography, 2018 (%)
Figure 165: Company 11 3D Scanning Market Net Revenue, By Years, 2018-2019* ($)
Figure 166: Company 11 3D Scanning Market Net Revenue Share, By Business segments, 2018 (%)
Figure 167: Company 11 3D Scanning Market Net Sales Share, By Geography, 2018 (%)
Figure 168: Company 12 3D Scanning Market Net Revenue, By Years, 2018-2019* ($)
Figure 169: Company 12 3D Scanning Market Net Revenue Share, By Business segments, 2018 (%)
Figure 170: Company 12 3D Scanning Market Net Sales Share, By Geography, 2018 (%)
Figure 171: Company 13 3D Scanning Market Net Revenue, By Years, 2018-2019* ($)
Figure 172: Company 13 3D Scanning Market Net Revenue Share, By Business segments, 2018 (%)
Figure 173: Company 13 3D Scanning Market Net Sales Share, By Geography, 2018 (%)
Figure 174: Company 14 3D Scanning Market Net Revenue, By Years, 2018-2019* ($)
Figure 175: Company 14 3D Scanning Market Net Revenue Share, By Business segments, 2018 (%)
Figure 176: Company 14 3D Scanning Market Net Sales Share, By Geography, 2018 (%)
Figure 177: Company 15 3D Scanning Market Net Revenue, By Years, 2018-2019* ($)
Figure 178: Company 15 3D Scanning Market Net Revenue Share, By Business segments, 2018 (%)
Figure 179: Company 15 3D Scanning Market Net Sales Share, By Geography, 2018 (%)