 Email
Email Print
Print


Biocides Market - Industry Analysis, Market Size, Share, Trends, Application Analysis, Growth And Forecast 2024-2030
Biocides Market Overview:
Market Snapshot:

Biocides Market - Report Coverage:
COVID-19 / Ukraine Crisis - Impact Analysis:
- The Covid-19 pandemic has significantly influenced the Biocides Market, leading to both challenges and opportunities. The increased emphasis on hygiene and sanitation measures to curb the virus's spread has boosted the demand for biocidal products. Industries such as healthcare, water treatment, and disinfectants experienced a surge in biocide usage. However, supply chain disruptions, workforce shortages, and economic uncertainties presented obstacles. Regulatory scrutiny intensified due to heightened awareness of chemical safety. Companies in the biocides sector navigated through these complexities, adapting strategies to meet evolving market demands. The pandemic underscored the critical role of biocides in public health, fostering innovation and resilience in the industry.
- The Russia-Ukraine crisis has reverberated across the global biocides market, introducing challenges and uncertainties. Supply chain disruptions, heightened geopolitical tensions, and trade restrictions have impacted the production and distribution of biocidal products. The crisis has led to fluctuations in raw material prices and availability, influencing overall market dynamics. Companies operating in the biocides sector are grappling with increased operational costs and logistical complexities, potentially affecting product pricing. Moreover, geopolitical uncertainties have prompted market players to reassess their strategies and risk management approaches. As the situation unfolds, the biocides market remains susceptible to geopolitical developments, emphasizing the need for adaptability and resilience within the industry.
Key Takeaways:
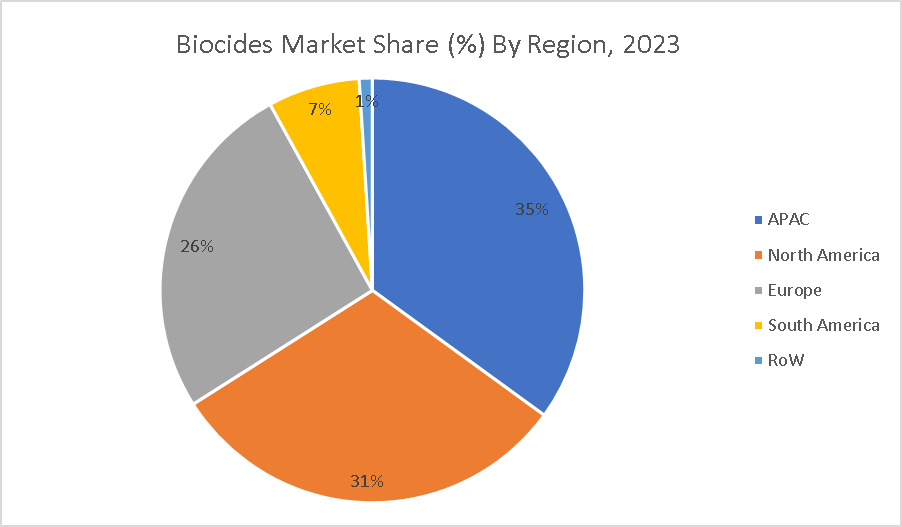
- The Asia Pacific region stands as the fastest-growing market in the biocides sector, showcasing remarkable expansion driven by industrialization, urbanization, and increasing awareness about hygiene standards. Robust economic growth in countries like China and India has fueled demand for biocidal products across various industries, including water treatment, healthcare, and agriculture. Moreover, stringent regulations emphasizing environmental sustainability have propelled the adoption of eco-friendly biocides in the region. With a burgeoning population and rising emphasis on health and sanitation, the Asia Pacific biocides market is poised for sustained growth, offering significant opportunities for industry players.
- Disinfectants are experiencing exceptional growth in the biocides market due to heightened global awareness of hygiene and the ongoing need to combat infectious diseases. With increased demand in healthcare, commercial, and residential sectors, disinfectants play a pivotal role in maintaining a sanitized environment. The COVID-19 pandemic has further accelerated this trend, emphasizing the crucial role of disinfectants in public health. As a result, the disinfectants segment stands out as the highest growing category in the biocides market, reflecting its essential role in contemporary hygiene practices.
- Water purification stands out as the highest-growing segment in the biocides market, driven by increasing global concerns about water quality and safety. As population growth and industrialization escalate, the demand for effective water treatment solutions intensifies. Biocides play a pivotal role in disinfecting and preserving water, addressing microbial contamination. The stringent need for clean water, especially in emerging economies, fuels the expansion of the biocides market, making water purification one of its most rapidly growing segments.
Biocides Market Segment Analysis – By Product Type
Biocides Market Segment Analysis – By Function
Biocides Market Segment Analysis – By End-Use Industry
Biocides Market Segment Analysis – By Geography
Biocides Market Drivers
The Increasing Awareness of Hygiene and Health Standards
The Global Focus on Preventing and Controlling Infectious Diseases
Biocides Market Challenges
Biocides Industry is Challenged by Increasing Regulatory Scrutiny and Evolving Environmental Concerns
Market Landscape
Developments:
- Ecolab Inc. in March 2023, launched "Bioshield," a biocide line made from plant extracts. This eco-friendly alternative offers similar effectiveness to traditional biocides while being safer for people and the environment, meeting the demand for sustainable solutions in disinfection and food preservation.
- Ecolab bolstered its food and beverage biosecurity presence by acquiring RGF Environmental Group in July 2023. RGF specializes in pesticide application and antimicrobial solutions, perfectly complementing Ecolab's offerings. This acquisition allows Ecolab to provide a more comprehensive suite of biosecurity solutions, ensuring food safety and preventing contamination for their clients in the food and beverage industry.
12.2 M&A’s, collaborations, JVs and partnerships
List of Tables
Table 1: Biocides Market Overview 2023-2030
Table 2: Biocides Market Leader Analysis 2023-2024 (US$)
Table 3: Biocides Market Product Analysis 2023-2024 (US$)
Table 4: Biocides Market End User Analysis 2023-2024 (US$)
Table 5: Biocides Market Patent Analysis 2021-2023* (US$)
Table 6: Biocides Market Financial Analysis 2023-2024 (US$)
Table 7: Biocides Market Driver Analysis 2023-2024 (US$)
Table 8: Biocides Market Challenges Analysis 2023-2024 (US$)
Table 9: Biocides Market Constraint Analysis 2023-2024 (US$)
Table 10: Biocides Market Supplier Bargaining Power Analysis 2023-2024 (US$)
Table 11: Biocides Market Buyer Bargaining Power Analysis 2023-2024 (US$)
Table 12: Biocides Market Threat of Substitutes Analysis 2023-2024 (US$)
Table 13: Biocides Market Threat of New Entrants Analysis 2023-2024 (US$)
Table 14: Biocides Market Degree of Competition Analysis 2023-2024 (US$)
Table 15: Biocides Market Value Chain Analysis 2023-2024 (US$)
Table 16: Biocides Market Pricing Analysis 2023-2030 (US$)
Table 17: Biocides Market Opportunities Analysis 2023-2030 (US$)
Table 18: Biocides Market Product Life Cycle Analysis 2023-2030 (US$)
Table 19: Biocides Market Supplier Analysis 2023-2024 (US$)
Table 20: Biocides Market Distributor Analysis 2023-2024 (US$)
Table 21: Biocides Market Trend Analysis 2023-2024 (US$)
Table 22: Biocides Market Size 2023 (US$)
Table 23: Biocides Market Forecast Analysis 2023-2030 (US$)
Table 24: Biocides Market Sales Forecast Analysis 2023-2030 (Units)
Table 25: Biocides Market, Revenue & Volume, By Type, 2023-2030 ($)
Table 26: Biocides Market By Type, Revenue & Volume, By Organic Compounds, 2023-2030 ($)
Table 27: Biocides Market By Type, Revenue & Volume, By Halogen Compounds, 2023-2030 ($)
Table 28: Biocides Market By Type, Revenue & Volume, By Metallic Compounds, 2023-2030 ($)
Table 29: Biocides Market By Type, Revenue & Volume, By Nitrogen Compounds, 2023-2030 ($)
Table 30: Biocides Market, Revenue & Volume, By Function, 2023-2030 ($)
Table 31: Biocides Market By Function, Revenue & Volume, By Disinfectants, 2023-2030 ($)
Table 32: Biocides Market By Function, Revenue & Volume, By Preservatives, 2023-2030 ($)
Table 33: Biocides Market By Function, Revenue & Volume, By Pesticides, 2023-2030 ($)
Table 34: Biocides Market, Revenue & Volume, By End User, 2023-2030 ($)
Table 35: Biocides Market By End User, Revenue & Volume, By Water Treatment, 2023-2030 ($)
Table 36: Biocides Market By End User, Revenue & Volume, By Food and Beverages, 2023-2030 ($)
Table 37: Biocides Market By End User, Revenue & Volume, By Personal/Health Care, 2023-2030 ($)
Table 38: Biocides Market By End User, Revenue & Volume, By Wood Preservatives, 2023-2030 ($)
Table 39: Biocides Market By End User, Revenue & Volume, By Paints and Coatings, 2023-2030 ($)
Table 40: North America Biocides Market, Revenue & Volume, By Type, 2023-2030 ($)
Table 41: North America Biocides Market, Revenue & Volume, By Function, 2023-2030 ($)
Table 42: North America Biocides Market, Revenue & Volume, By End User, 2023-2030 ($)
Table 43: South america Biocides Market, Revenue & Volume, By Type, 2023-2030 ($)
Table 44: South america Biocides Market, Revenue & Volume, By Function, 2023-2030 ($)
Table 45: South america Biocides Market, Revenue & Volume, By End User, 2023-2030 ($)
Table 46: Europe Biocides Market, Revenue & Volume, By Type, 2023-2030 ($)
Table 47: Europe Biocides Market, Revenue & Volume, By Function, 2023-2030 ($)
Table 48: Europe Biocides Market, Revenue & Volume, By End User, 2023-2030 ($)
Table 49: APAC Biocides Market, Revenue & Volume, By Type, 2023-2030 ($)
Table 50: APAC Biocides Market, Revenue & Volume, By Function, 2023-2030 ($)
Table 51: APAC Biocides Market, Revenue & Volume, By End User, 2023-2030 ($)
Table 52: Middle East & Africa Biocides Market, Revenue & Volume, By Type, 2023-2030 ($)
Table 53: Middle East & Africa Biocides Market, Revenue & Volume, By Function, 2023-2030 ($)
Table 54: Middle East & Africa Biocides Market, Revenue & Volume, By End User, 2023-2030 ($)
Table 55: Russia Biocides Market, Revenue & Volume, By Type, 2023-2030 ($)
Table 56: Russia Biocides Market, Revenue & Volume, By Function, 2023-2030 ($)
Table 57: Russia Biocides Market, Revenue & Volume, By End User, 2023-2030 ($)
Table 58: Israel Biocides Market, Revenue & Volume, By Type, 2023-2030 ($)
Table 59: Israel Biocides Market, Revenue & Volume, By Function, 2023-2030 ($)
Table 60: Israel Biocides Market, Revenue & Volume, By End User, 2023-2030 ($)
Table 61: Top Companies 2023 (US$)Biocides Market, Revenue & Volume
Table 62: Product Launch 2023-2024Biocides Market, Revenue & Volume
Table 63: Mergers & Acquistions 2023-2024Biocides Market, Revenue & Volume
List of Figures
Figure 1: Overview of Biocides Market 2023-2030
Figure 2: Market Share Analysis for Biocides Market 2023 (US$)
Figure 3: Product Comparison in Biocides Market 2023-2024 (US$)
Figure 4: End User Profile for Biocides Market 2023-2024 (US$)
Figure 5: Patent Application and Grant in Biocides Market 2021-2023* (US$)
Figure 6: Top 5 Companies Financial Analysis in Biocides Market 2023-2024 (US$)
Figure 7: Market Entry Strategy in Biocides Market 2023-2024
Figure 8: Ecosystem Analysis in Biocides Market 2023
Figure 9: Average Selling Price in Biocides Market 2023-2030
Figure 10: Top Opportunites in Biocides Market 2023-2024
Figure 11: Market Life Cycle Analysis in Biocides Market
Figure 12: GlobalBy TypeBiocides Market Revenue, 2023-2030 ($)
Figure 13: GlobalBy FunctionBiocides Market Revenue, 2023-2030 ($)
Figure 14: GlobalBy End UserBiocides Market Revenue, 2023-2030 ($)
Figure 15: Global Biocides Market - By Geography
Figure 16: Global Biocides Market Value & Volume, By Geography, 2023-2030 ($)
Figure 17: Global Biocides Market CAGR, By Geography, 2023-2030 (%)
Figure 18: North America Biocides Market Value & Volume, 2023-2030 ($)
Figure 19: US Biocides Market Value & Volume, 2023-2030 ($)
Figure 20: US GDP and Population, 2023-2024 ($)
Figure 21: US GDP – Composition of 2023, By Sector of Origin
Figure 22: US Export and Import Value & Volume, 2023-2024 ($)
Figure 23: Canada Biocides Market Value & Volume, 2023-2030 ($)
Figure 24: Canada GDP and Population, 2023-2024 ($)
Figure 25: Canada GDP – Composition of 2023, By Sector of Origin
Figure 26: Canada Export and Import Value & Volume, 2023-2024 ($)
Figure 27: Mexico Biocides Market Value & Volume, 2023-2030 ($)
Figure 28: Mexico GDP and Population, 2023-2024 ($)
Figure 29: Mexico GDP – Composition of 2023, By Sector of Origin
Figure 30: Mexico Export and Import Value & Volume, 2023-2024 ($)
Figure 31: South America Biocides Market Value & Volume, 2023-2030 ($)
Figure 32: Brazil Biocides Market Value & Volume, 2023-2030 ($)
Figure 33: Brazil GDP and Population, 2023-2024 ($)
Figure 34: Brazil GDP – Composition of 2023, By Sector of Origin
Figure 35: Brazil Export and Import Value & Volume, 2023-2024 ($)
Figure 36: Venezuela Biocides Market Value & Volume, 2023-2030 ($)
Figure 37: Venezuela GDP and Population, 2023-2024 ($)
Figure 38: Venezuela GDP – Composition of 2023, By Sector of Origin
Figure 39: Venezuela Export and Import Value & Volume, 2023-2024 ($)
Figure 40: Argentina Biocides Market Value & Volume, 2023-2030 ($)
Figure 41: Argentina GDP and Population, 2023-2024 ($)
Figure 42: Argentina GDP – Composition of 2023, By Sector of Origin
Figure 43: Argentina Export and Import Value & Volume, 2023-2024 ($)
Figure 44: Ecuador Biocides Market Value & Volume, 2023-2030 ($)
Figure 45: Ecuador GDP and Population, 2023-2024 ($)
Figure 46: Ecuador GDP – Composition of 2023, By Sector of Origin
Figure 47: Ecuador Export and Import Value & Volume, 2023-2024 ($)
Figure 48: Peru Biocides Market Value & Volume, 2023-2030 ($)
Figure 49: Peru GDP and Population, 2023-2024 ($)
Figure 50: Peru GDP – Composition of 2023, By Sector of Origin
Figure 51: Peru Export and Import Value & Volume, 2023-2024 ($)
Figure 52: Colombia Biocides Market Value & Volume, 2023-2030 ($)
Figure 53: Colombia GDP and Population, 2023-2024 ($)
Figure 54: Colombia GDP – Composition of 2023, By Sector of Origin
Figure 55: Colombia Export and Import Value & Volume, 2023-2024 ($)
Figure 56: Costa Rica Biocides Market Value & Volume, 2023-2030 ($)
Figure 57: Costa Rica GDP and Population, 2023-2024 ($)
Figure 58: Costa Rica GDP – Composition of 2023, By Sector of Origin
Figure 59: Costa Rica Export and Import Value & Volume, 2023-2024 ($)
Figure 60: Europe Biocides Market Value & Volume, 2023-2030 ($)
Figure 61: U.K Biocides Market Value & Volume, 2023-2030 ($)
Figure 62: U.K GDP and Population, 2023-2024 ($)
Figure 63: U.K GDP – Composition of 2023, By Sector of Origin
Figure 64: U.K Export and Import Value & Volume, 2023-2024 ($)
Figure 65: Germany Biocides Market Value & Volume, 2023-2030 ($)
Figure 66: Germany GDP and Population, 2023-2024 ($)
Figure 67: Germany GDP – Composition of 2023, By Sector of Origin
Figure 68: Germany Export and Import Value & Volume, 2023-2024 ($)
Figure 69: Italy Biocides Market Value & Volume, 2023-2030 ($)
Figure 70: Italy GDP and Population, 2023-2024 ($)
Figure 71: Italy GDP – Composition of 2023, By Sector of Origin
Figure 72: Italy Export and Import Value & Volume, 2023-2024 ($)
Figure 73: France Biocides Market Value & Volume, 2023-2030 ($)
Figure 74: France GDP and Population, 2023-2024 ($)
Figure 75: France GDP – Composition of 2023, By Sector of Origin
Figure 76: France Export and Import Value & Volume, 2023-2024 ($)
Figure 77: Netherlands Biocides Market Value & Volume, 2023-2030 ($)
Figure 78: Netherlands GDP and Population, 2023-2024 ($)
Figure 79: Netherlands GDP – Composition of 2023, By Sector of Origin
Figure 80: Netherlands Export and Import Value & Volume, 2023-2024 ($)
Figure 81: Belgium Biocides Market Value & Volume, 2023-2030 ($)
Figure 82: Belgium GDP and Population, 2023-2024 ($)
Figure 83: Belgium GDP – Composition of 2023, By Sector of Origin
Figure 84: Belgium Export and Import Value & Volume, 2023-2024 ($)
Figure 85: Spain Biocides Market Value & Volume, 2023-2030 ($)
Figure 86: Spain GDP and Population, 2023-2024 ($)
Figure 87: Spain GDP – Composition of 2023, By Sector of Origin
Figure 88: Spain Export and Import Value & Volume, 2023-2024 ($)
Figure 89: Denmark Biocides Market Value & Volume, 2023-2030 ($)
Figure 90: Denmark GDP and Population, 2023-2024 ($)
Figure 91: Denmark GDP – Composition of 2023, By Sector of Origin
Figure 92: Denmark Export and Import Value & Volume, 2023-2024 ($)
Figure 93: APAC Biocides Market Value & Volume, 2023-2030 ($)
Figure 94: China Biocides Market Value & Volume, 2023-2030
Figure 95: China GDP and Population, 2023-2024 ($)
Figure 96: China GDP – Composition of 2023, By Sector of Origin
Figure 97: China Export and Import Value & Volume, 2023-2024 ($)Biocides Market China Export and Import Value & Volume, 2023-2024 ($)
Figure 98: Australia Biocides Market Value & Volume, 2023-2030 ($)
Figure 99: Australia GDP and Population, 2023-2024 ($)
Figure 100: Australia GDP – Composition of 2023, By Sector of Origin
Figure 101: Australia Export and Import Value & Volume, 2023-2024 ($)
Figure 102: South Korea Biocides Market Value & Volume, 2023-2030 ($)
Figure 103: South Korea GDP and Population, 2023-2024 ($)
Figure 104: South Korea GDP – Composition of 2023, By Sector of Origin
Figure 105: South Korea Export and Import Value & Volume, 2023-2024 ($)
Figure 106: India Biocides Market Value & Volume, 2023-2030 ($)
Figure 107: India GDP and Population, 2023-2024 ($)
Figure 108: India GDP – Composition of 2023, By Sector of Origin
Figure 109: India Export and Import Value & Volume, 2023-2024 ($)
Figure 110: Taiwan Biocides Market Value & Volume, 2023-2030 ($)
Figure 111: Taiwan GDP and Population, 2023-2024 ($)
Figure 112: Taiwan GDP – Composition of 2023, By Sector of Origin
Figure 113: Taiwan Export and Import Value & Volume, 2023-2024 ($)
Figure 114: Malaysia Biocides Market Value & Volume, 2023-2030 ($)
Figure 115: Malaysia GDP and Population, 2023-2024 ($)
Figure 116: Malaysia GDP – Composition of 2023, By Sector of Origin
Figure 117: Malaysia Export and Import Value & Volume, 2023-2024 ($)
Figure 118: Hong Kong Biocides Market Value & Volume, 2023-2030 ($)
Figure 119: Hong Kong GDP and Population, 2023-2024 ($)
Figure 120: Hong Kong GDP – Composition of 2023, By Sector of Origin
Figure 121: Hong Kong Export and Import Value & Volume, 2023-2024 ($)
Figure 122: Middle East & Africa Biocides Market Middle East & Africa 3D Printing Market Value & Volume, 2023-2030 ($)
Figure 123: Russia Biocides Market Value & Volume, 2023-2030 ($)
Figure 124: Russia GDP and Population, 2023-2024 ($)
Figure 125: Russia GDP – Composition of 2023, By Sector of Origin
Figure 126: Russia Export and Import Value & Volume, 2023-2024 ($)
Figure 127: Israel Biocides Market Value & Volume, 2023-2030 ($)
Figure 128: Israel GDP and Population, 2023-2024 ($)
Figure 129: Israel GDP – Composition of 2023, By Sector of Origin
Figure 130: Israel Export and Import Value & Volume, 2023-2024 ($)
Figure 131: Entropy Share, By Strategies, 2023-2024* (%)Biocides Market
Figure 132: Developments, 2023-2024*Biocides Market
Figure 133: Company 1 Biocides Market Net Revenue, By Years, 2023-2024* ($)
Figure 134: Company 1 Biocides Market Net Revenue Share, By Business segments, 2023 (%)
Figure 135: Company 1 Biocides Market Net Sales Share, By Geography, 2023 (%)
Figure 136: Company 2 Biocides Market Net Revenue, By Years, 2023-2024* ($)
Figure 137: Company 2 Biocides Market Net Revenue Share, By Business segments, 2023 (%)
Figure 138: Company 2 Biocides Market Net Sales Share, By Geography, 2023 (%)
Figure 139: Company 3 Biocides Market Net Revenue, By Years, 2023-2024* ($)
Figure 140: Company 3 Biocides Market Net Revenue Share, By Business segments, 2023 (%)
Figure 141: Company 3 Biocides Market Net Sales Share, By Geography, 2023 (%)
Figure 142: Company 4 Biocides Market Net Revenue, By Years, 2023-2024* ($)
Figure 143: Company 4 Biocides Market Net Revenue Share, By Business segments, 2023 (%)
Figure 144: Company 4 Biocides Market Net Sales Share, By Geography, 2023 (%)
Figure 145: Company 5 Biocides Market Net Revenue, By Years, 2023-2024* ($)
Figure 146: Company 5 Biocides Market Net Revenue Share, By Business segments, 2023 (%)
Figure 147: Company 5 Biocides Market Net Sales Share, By Geography, 2023 (%)
Figure 148: Company 6 Biocides Market Net Revenue, By Years, 2023-2024* ($)
Figure 149: Company 6 Biocides Market Net Revenue Share, By Business segments, 2023 (%)
Figure 150: Company 6 Biocides Market Net Sales Share, By Geography, 2023 (%)
Figure 151: Company 7 Biocides Market Net Revenue, By Years, 2023-2024* ($)
Figure 152: Company 7 Biocides Market Net Revenue Share, By Business segments, 2023 (%)
Figure 153: Company 7 Biocides Market Net Sales Share, By Geography, 2023 (%)
Figure 154: Company 8 Biocides Market Net Revenue, By Years, 2023-2024* ($)
Figure 155: Company 8 Biocides Market Net Revenue Share, By Business segments, 2023 (%)
Figure 156: Company 8 Biocides Market Net Sales Share, By Geography, 2023 (%)
Figure 157: Company 9 Biocides Market Net Revenue, By Years, 2023-2024* ($)
Figure 158: Company 9 Biocides Market Net Revenue Share, By Business segments, 2023 (%)
Figure 159: Company 9 Biocides Market Net Sales Share, By Geography, 2023 (%)
Figure 160: Company 10 Biocides Market Net Revenue, By Years, 2023-2024* ($)
Figure 161: Company 10 Biocides Market Net Revenue Share, By Business segments, 2023 (%)
Figure 162: Company 10 Biocides Market Net Sales Share, By Geography, 2023 (%)
Figure 163: Company 11 Biocides Market Net Revenue, By Years, 2023-2024* ($)
Figure 164: Company 11 Biocides Market Net Revenue Share, By Business segments, 2023 (%)
Figure 165: Company 11 Biocides Market Net Sales Share, By Geography, 2023 (%)
Figure 166: Company 12 Biocides Market Net Revenue, By Years, 2023-2024* ($)
Figure 167: Company 12 Biocides Market Net Revenue Share, By Business segments, 2023 (%)
Figure 168: Company 12 Biocides Market Net Sales Share, By Geography, 2023 (%)
Figure 169: Company 13 Biocides Market Net Revenue, By Years, 2023-2024* ($)
Figure 170: Company 13 Biocides Market Net Revenue Share, By Business segments, 2023 (%)
Figure 171: Company 13 Biocides Market Net Sales Share, By Geography, 2023 (%)
Figure 172: Company 14 Biocides Market Net Revenue, By Years, 2023-2024* ($)
Figure 173: Company 14 Biocides Market Net Revenue Share, By Business segments, 2023 (%)
Figure 174: Company 14 Biocides Market Net Sales Share, By Geography, 2023 (%)
Figure 175: Company 15 Biocides Market Net Revenue, By Years, 2023-2024* ($)
Figure 176: Company 15 Biocides Market Net Revenue Share, By Business segments, 2023 (%)
Figure 177: Company 15 Biocides Market Net Sales Share, By Geography, 2023 (%)