 Email
Email Print
Print


Polymer Foam Market - Industry Analysis, Market Size, Share, Trends, Application Analysis, Growth And Forecast 2024-2030
Polymer Foam Market Overview
The Polymer Foam Market size is projected to grow at a CAGR of 4.1% during the forecast period 2024-2030 and reach US$185 billion by 2030. Polymer foam is crafted from polymers that undergo expansion or foaming, resulting in a cellular structure marked by voids or bubbles within the polymer matrix. This cellular arrangement grants polymer foam distinctive attributes including low density, a high strength-to-weight ratio, and effective insulation capabilities. Diverse techniques exist for producing polymer foam, all centered on introducing gas bubbles into the polymer matrix during its creation. The selection of method hinges upon the particular polymer and the intended properties of the foam desired.
Polymer foams are finding new and innovative applications across various industries, including automotive, construction, packaging, and healthcare. Advancements in foam technology are enabling the development of lighter, stronger, and more versatile materials suited for a wide range of uses.The construction industry is a significant consumer of polymer foams, particularly for insulation purposes. As building codes and standards evolve to prioritize energy efficiency and sustainability, the demand for high-performance foam insulation materials is expected to rise.
Market Snapshort :

Polymer Foam Market Report Coverage
The "Polymer Foam Market Report – Forecast (2024-2030)” by IndustryARC, covers an in-depth analysis of the following segments in the Polymer Foam Market.
By Type: Ethylene-Vinyl Acetate (EVA), Polyethylene (PE) [Low-Density Polyethylene (LDPE) and High-Density Polyethylene (HDPE)], Polyvinyl Chloride (PVC), Polyurethane (PU), Polypropylene (PP), Polystyrene (PS) and Others.
By Foam Type: Rigid, Flexible.
By Processing Method: Batch Foaming, Foam Extrusion Molding and Foam Injection Molding.
By End-use Industry: Automotive (Passenger Car, Light Commercial Vehicle and Heavy Commercial Vehicles), Electrical & Electronics (Semiconductor, Appliances and Others), Aerospace (Commercial, Military, Others), Building & Construction (Residential, Commercial, Industrial), Packaging, Medical, Footwear and Others.
By Geography: North America (the USA, Canada and Mexico), Europe (the UK, Germany, France, Italy, the Netherlands, Spain, Denmark, Belgium and the Rest of Europe), Asia-Pacific (China, Japan, India, South Korea, Australia and New Zealand, Indonesia, Taiwan, Malaysia and the Rest of APAC), South America (Brazil, Argentina, Colombia, Chile and the Rest of South America) and the Rest of the World [the Middle East (Saudi Arabia, the UAE, Israel and the Rest of Middle East) and Africa (South Africa, Nigeria and the Rest of Africa)
Key Takeaways
-
Asia Pacific dominates the market with a 40.24% share in 2023 due to factors like rapid urbanization, increased construction activity, and rising demand for consumer goods and packaging, particularly in China, India, and Japan.
- The growing middle-class population in Asia Pacific boosts consumer goods consumption and the need for efficient packaging solutions, driving demand for polymer foams.
- Favorable government regulations and incentives in certain Asia Pacific countries encourage the use of lightweight and environmentally friendly materials like polymer foams, further stimulating market growth.
- Asia Pacific benefits from a strong polymer foam manufacturing base, supporting its growth across various end-use sectors.
- North America is poised for significant market growth, driven by its substantial automobile manufacturing sector and the expansion of e-commerce and retail industries. Polymer foams are crucial in protective packaging due to their cushioning and shock-absorbing properties, meeting the demands of shipping and logistics effectively
For More Details on This Report - Request for Sample
Polymer Foam Market Segment Analysis – by Type
The Polystyrene (PS) sector emerged as the dominant force in the market, capturing an impressive 88.20% share in 2023. This material finds extensive use across various applications including furniture, cushions, and carpets, thanks to its distinctive qualities such as lightweight nature, efficient heat and sound insulation, high energy dissipation, and insulation capabilities, which have garnered a sizable customer base. The escalating demand for both residential and commercial properties in Southeast Asian nations like Singapore, Korea, and Indonesia is poised to further boost the demand for polystyrene in construction applications. Expanded polystyrene foam stands out as one of the lightest materials available, offering an exceptional strength-to-weight ratio that makes it particularly valuable in packaging applications, facilitating fuel and cost savings during transportation. Moreover, its versatility extends to rail applications, such as train station platform extensions and rail embankment buildings. The anticipated surge in rail infrastructure construction ventures across Asia Pacific, the Middle East, and Africa throughout the forecast period is expected to be a key driver for the increased demand for polystyrene foam.
Polymer Foam Market Segment Analysis – by End-use Industry
The building & construction industry dominated the Polymer Foam Market with a share of over 25% in 2021, owing to the increasing construction activities across the world. According to Volvo CE, the construction sector saw an increase in construction activities across multiple regions since the fourth quarter of 2020. South America saw an increase of 12%, Asia by 39%, Europe by 20% and China by 28% in 2020. Polymer foams are primarily used in the building & construction industry for the insulation of water pipes, installation of door and window frames and sealing of roofs and walls. Thus, an increase in global construction activities is expected to increase the demand for polymer foam, owing to their above-mentioned usage. This is expected to expand the Polymer Foam market size during the forecast period.
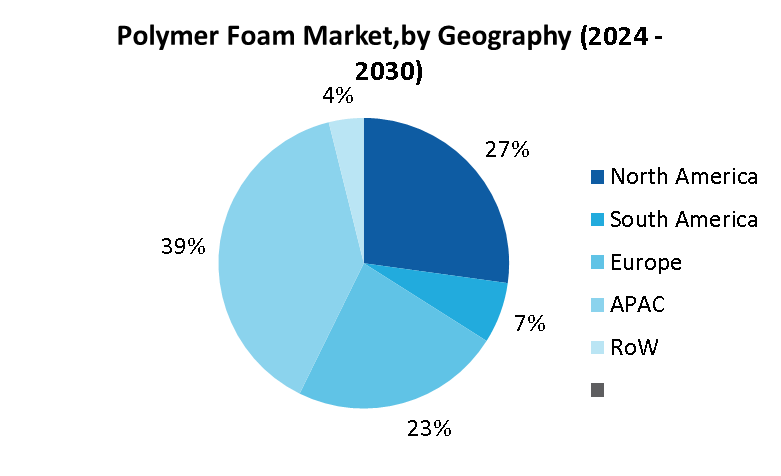
Polymer Foam Market Segment Analysis – by Geography
In 2023, Asia Pacific dominated the market with a 39.24% share, driven by factors like rapid urbanization, increased construction, and growing demand for consumer goods and packaging in countries like China, India, and Japan. The rising middle-class population has led to higher consumption of consumer goods and the need for better packaging solutions, fueling the demand for polymer foams. Favorable government regulations and incentives in some nations have also encouraged the use of lightweight and eco-friendly materials like polymer foams. The region benefits from a robust manufacturing base for polymer foams, supporting growth across various sectors. North America is poised for significant market growth, fueled by its substantial automobile manufacturing sector and the expanding e-commerce and retail industries. Polymer foams are extensively used in protective packaging due to their cushioning and shock-absorbing properties, meeting the demands of shipping and logistics effectively.
Polymer Foam Market Drivers
Growing use of polymer foam in electronics packaging & building and construction operations
The expansion of the market share for polymer foams. Polymer foam joint fillers find widespread application in diverse construction projects, with polyurethane being particularly suitable due to its lightweight nature, low heat conductivity, and minimal water absorption, making it ideal for insulation purposes. Moreover, the demand for polymer foam in electronics packaging is expected to surge owing to the increased adoption of electronic devices like smartphones and LED televisions. Polymer foams exhibit exceptional stress and vibration absorption properties while offering cushioning capabilities, making them a preferred choice for protecting electronic gadgets due to their versatility. The growing disposable income in emerging economies has contributed to the escalating demand for polymer foam, utilized in various furniture foams and automotive seating. The cushioning attributes of polymer foams, such as polyurethane and polyethylene, make them well-suited for applications in vehicle upholstery, furniture, and bedding. This rising demand is anticipated to serve as a significant driving force behind the expansion of the polymer foam market.
Polymer Foam Market Challenges
Fluctuating prices of raw materials:
Fluctuations in the prices of raw materials used in the production of polymer foams, such as petrochemicals, can impact manufacturing costs and profitability for foam manufacturers. Economic factors and geopolitical events can contribute to volatility in raw material prices.
Key Market Players
Technology launches, acquisitions and increased R&D activities are key strategies adopted by players in the Polymer Foam Market. The top companies in Polymer Foam Market are:
- Arkema Group
- Armacell International S.A.
- BASF SE
- Borealis AG
- Fritz Nauer AG
- Koepp Schaum GmbH
- JSP Corporation
- Polymer Technologies, Inc.
- Recticel NV
- Rogers Corporation
Recent Developments
- In December 2023, BASF unveiled Irgastab® PUR 71, an innovative antioxidant that enhances regulatory compliance and performance in polyols and polyurethane foams. This advanced solution is formulated without aromatic amine, effectively overcoming the limitations of traditional anti-scorch additives. With its outstanding environmental, health, and safety profile, this solution meets the industry's growing regulatory demands regarding substance classification and sustainability.
- In September 2023, Covestro partnered with Poland's Selena Group to develop a more sustainable range of polyurethane (PU) foams aimed at enhancing building thermal insulation. These materials are ISSC Plus certified, indicating the inclusion of plant-based feedstocks through the mass balancing approach, resulting in a significant 60% reduction in carbon footprint compared to fossil-derived alternatives.
- In November 2022, Huntsman launched Acoustiflex VEF BIO, a visco-elastic foam derived from vegetable oils with a bio-based content of up to 20%, tailored for molded acoustic applications in the automotive sector. This groundbreaking technology, in comparison to existing Huntsman systems, can decrease the carbon footprint of automobile carpet back-foaming by up to 25%.
For more Chemicals and Materials Market reports, please click here
16.1 BASF SE
16.2 Arkema Group
16.3 JSP Corporation
16.4 Polymer Technologies, Inc.
16.5 Recticel NV
16.6 Synthos S.A.
16.7 DowDuPont, Inc.
16.8 Trelleborg AB
16.9 Zotefoams plc
16.10 Sealed air Corporation
List of Tables
Table 1: Polymer Foam Market Overview 2023-2030
Table 2: Polymer Foam Market Leader Analysis 2023-2024 (US$)
Table 3: Polymer Foam Market Product Analysis 2023-2024 (US$)
Table 4: Polymer Foam Market End User Analysis 2023-2024 (US$)
Table 5: Polymer Foam Market Patent Analysis 2021-2023* (US$)
Table 6: Polymer Foam Market Financial Analysis 2023-2024 (US$)
Table 7: Polymer Foam Market Driver Analysis 2023-2024 (US$)
Table 8: Polymer Foam Market Challenges Analysis 2023-2024 (US$)
Table 9: Polymer Foam Market Constraint Analysis 2023-2024 (US$)
Table 10: Polymer Foam Market Supplier Bargaining Power Analysis 2023-2024 (US$)
Table 11: Polymer Foam Market Buyer Bargaining Power Analysis 2023-2024 (US$)
Table 12: Polymer Foam Market Threat of Substitutes Analysis 2023-2024 (US$)
Table 13: Polymer Foam Market Threat of New Entrants Analysis 2023-2024 (US$)
Table 14: Polymer Foam Market Degree of Competition Analysis 2023-2024 (US$)
Table 15: Polymer Foam Market Value Chain Analysis 2023-2024 (US$)
Table 16: Polymer Foam Market Pricing Analysis 2023-2030 (US$)
Table 17: Polymer Foam Market Opportunities Analysis 2023-2030 (US$)
Table 18: Polymer Foam Market Product Life Cycle Analysis 2023-2030 (US$)
Table 19: Polymer Foam Market Supplier Analysis 2023-2024 (US$)
Table 20: Polymer Foam Market Distributor Analysis 2023-2024 (US$)
Table 21: Polymer Foam Market Trend Analysis 2023-2024 (US$)
Table 22: Polymer Foam Market Size 2023 (US$)
Table 23: Polymer Foam Market Forecast Analysis 2023-2030 (US$)
Table 24: Polymer Foam Market Sales Forecast Analysis 2023-2030 (Units)
Table 25: Polymer Foam Market, Revenue & Volume, By Type, 2023-2030 ($)
Table 26: Polymer Foam Market By Type, Revenue & Volume, By Polyurethane, 2023-2030 ($)
Table 27: Polymer Foam Market By Type, Revenue & Volume, By Polystyrene, 2023-2030 ($)
Table 28: Polymer Foam Market By Type, Revenue & Volume, By Polyethylene, 2023-2030 ($)
Table 29: Polymer Foam Market By Type, Revenue & Volume, By Polypropylene, 2023-2030 ($)
Table 30: Polymer Foam Market By Type, Revenue & Volume, By Polyvinyl Chloride, 2023-2030 ($)
Table 31: Polymer Foam Market, Revenue & Volume, By Application, 2023-2030 ($)
Table 32: Polymer Foam Market By Application, Revenue & Volume, By Packaging, 2023-2030 ($)
Table 33: Polymer Foam Market By Application, Revenue & Volume, By Construction, 2023-2030 ($)
Table 34: Polymer Foam Market By Application, Revenue & Volume, By Automotive, 2023-2030 ($)
Table 35: Polymer Foam Market By Application, Revenue & Volume, By Aerospace, 2023-2030 ($)
Table 36: Polymer Foam Market By Application, Revenue & Volume, By Wind Energy, 2023-2030 ($)
Table 37: North America Polymer Foam Market, Revenue & Volume, By Type, 2023-2030 ($)
Table 38: North America Polymer Foam Market, Revenue & Volume, By Application, 2023-2030 ($)
Table 39: South america Polymer Foam Market, Revenue & Volume, By Type, 2023-2030 ($)
Table 40: South america Polymer Foam Market, Revenue & Volume, By Application, 2023-2030 ($)
Table 41: Europe Polymer Foam Market, Revenue & Volume, By Type, 2023-2030 ($)
Table 42: Europe Polymer Foam Market, Revenue & Volume, By Application, 2023-2030 ($)
Table 43: APAC Polymer Foam Market, Revenue & Volume, By Type, 2023-2030 ($)
Table 44: APAC Polymer Foam Market, Revenue & Volume, By Application, 2023-2030 ($)
Table 45: Middle East & Africa Polymer Foam Market, Revenue & Volume, By Type, 2023-2030 ($)
Table 46: Middle East & Africa Polymer Foam Market, Revenue & Volume, By Application, 2023-2030 ($)
Table 47: Russia Polymer Foam Market, Revenue & Volume, By Type, 2023-2030 ($)
Table 48: Russia Polymer Foam Market, Revenue & Volume, By Application, 2023-2030 ($)
Table 49: Israel Polymer Foam Market, Revenue & Volume, By Type, 2023-2030 ($)
Table 50: Israel Polymer Foam Market, Revenue & Volume, By Application, 2023-2030 ($)
Table 51: Top Companies 2023 (US$)Polymer Foam Market, Revenue & Volume
Table 52: Product Launch 2023-2024Polymer Foam Market, Revenue & Volume
Table 53: Mergers & Acquistions 2023-2024Polymer Foam Market, Revenue & Volume
List of Figures
Figure 1: Overview of Polymer Foam Market 2023-2030
Figure 2: Market Share Analysis for Polymer Foam Market 2023 (US$)
Figure 3: Product Comparison in Polymer Foam Market 2023-2024 (US$)
Figure 4: End User Profile for Polymer Foam Market 2023-2024 (US$)
Figure 5: Patent Application and Grant in Polymer Foam Market 2021-2023* (US$)
Figure 6: Top 5 Companies Financial Analysis in Polymer Foam Market 2023-2024 (US$)
Figure 7: Market Entry Strategy in Polymer Foam Market 2023-2024
Figure 8: Ecosystem Analysis in Polymer Foam Market 2023
Figure 9: Average Selling Price in Polymer Foam Market 2023-2030
Figure 10: Top Opportunites in Polymer Foam Market 2023-2024
Figure 11: Market Life Cycle Analysis in Polymer Foam Market
Figure 12: GlobalBy TypePolymer Foam Market Revenue, 2023-2030 ($)
Figure 13: GlobalBy ApplicationPolymer Foam Market Revenue, 2023-2030 ($)
Figure 14: Global Polymer Foam Market - By Geography
Figure 15: Global Polymer Foam Market Value & Volume, By Geography, 2023-2030 ($)
Figure 16: Global Polymer Foam Market CAGR, By Geography, 2023-2030 (%)
Figure 17: North America Polymer Foam Market Value & Volume, 2023-2030 ($)
Figure 18: US Polymer Foam Market Value & Volume, 2023-2030 ($)
Figure 19: US GDP and Population, 2023-2024 ($)
Figure 20: US GDP – Composition of 2023, By Sector of Origin
Figure 21: US Export and Import Value & Volume, 2023-2024 ($)
Figure 22: Canada Polymer Foam Market Value & Volume, 2023-2030 ($)
Figure 23: Canada GDP and Population, 2023-2024 ($)
Figure 24: Canada GDP – Composition of 2023, By Sector of Origin
Figure 25: Canada Export and Import Value & Volume, 2023-2024 ($)
Figure 26: Mexico Polymer Foam Market Value & Volume, 2023-2030 ($)
Figure 27: Mexico GDP and Population, 2023-2024 ($)
Figure 28: Mexico GDP – Composition of 2023, By Sector of Origin
Figure 29: Mexico Export and Import Value & Volume, 2023-2024 ($)
Figure 30: South America Polymer Foam Market Value & Volume, 2023-2030 ($)
Figure 31: Brazil Polymer Foam Market Value & Volume, 2023-2030 ($)
Figure 32: Brazil GDP and Population, 2023-2024 ($)
Figure 33: Brazil GDP – Composition of 2023, By Sector of Origin
Figure 34: Brazil Export and Import Value & Volume, 2023-2024 ($)
Figure 35: Venezuela Polymer Foam Market Value & Volume, 2023-2030 ($)
Figure 36: Venezuela GDP and Population, 2023-2024 ($)
Figure 37: Venezuela GDP – Composition of 2023, By Sector of Origin
Figure 38: Venezuela Export and Import Value & Volume, 2023-2024 ($)
Figure 39: Argentina Polymer Foam Market Value & Volume, 2023-2030 ($)
Figure 40: Argentina GDP and Population, 2023-2024 ($)
Figure 41: Argentina GDP – Composition of 2023, By Sector of Origin
Figure 42: Argentina Export and Import Value & Volume, 2023-2024 ($)
Figure 43: Ecuador Polymer Foam Market Value & Volume, 2023-2030 ($)
Figure 44: Ecuador GDP and Population, 2023-2024 ($)
Figure 45: Ecuador GDP – Composition of 2023, By Sector of Origin
Figure 46: Ecuador Export and Import Value & Volume, 2023-2024 ($)
Figure 47: Peru Polymer Foam Market Value & Volume, 2023-2030 ($)
Figure 48: Peru GDP and Population, 2023-2024 ($)
Figure 49: Peru GDP – Composition of 2023, By Sector of Origin
Figure 50: Peru Export and Import Value & Volume, 2023-2024 ($)
Figure 51: Colombia Polymer Foam Market Value & Volume, 2023-2030 ($)
Figure 52: Colombia GDP and Population, 2023-2024 ($)
Figure 53: Colombia GDP – Composition of 2023, By Sector of Origin
Figure 54: Colombia Export and Import Value & Volume, 2023-2024 ($)
Figure 55: Costa Rica Polymer Foam Market Value & Volume, 2023-2030 ($)
Figure 56: Costa Rica GDP and Population, 2023-2024 ($)
Figure 57: Costa Rica GDP – Composition of 2023, By Sector of Origin
Figure 58: Costa Rica Export and Import Value & Volume, 2023-2024 ($)
Figure 59: Europe Polymer Foam Market Value & Volume, 2023-2030 ($)
Figure 60: U.K Polymer Foam Market Value & Volume, 2023-2030 ($)
Figure 61: U.K GDP and Population, 2023-2024 ($)
Figure 62: U.K GDP – Composition of 2023, By Sector of Origin
Figure 63: U.K Export and Import Value & Volume, 2023-2024 ($)
Figure 64: Germany Polymer Foam Market Value & Volume, 2023-2030 ($)
Figure 65: Germany GDP and Population, 2023-2024 ($)
Figure 66: Germany GDP – Composition of 2023, By Sector of Origin
Figure 67: Germany Export and Import Value & Volume, 2023-2024 ($)
Figure 68: Italy Polymer Foam Market Value & Volume, 2023-2030 ($)
Figure 69: Italy GDP and Population, 2023-2024 ($)
Figure 70: Italy GDP – Composition of 2023, By Sector of Origin
Figure 71: Italy Export and Import Value & Volume, 2023-2024 ($)
Figure 72: France Polymer Foam Market Value & Volume, 2023-2030 ($)
Figure 73: France GDP and Population, 2023-2024 ($)
Figure 74: France GDP – Composition of 2023, By Sector of Origin
Figure 75: France Export and Import Value & Volume, 2023-2024 ($)
Figure 76: Netherlands Polymer Foam Market Value & Volume, 2023-2030 ($)
Figure 77: Netherlands GDP and Population, 2023-2024 ($)
Figure 78: Netherlands GDP – Composition of 2023, By Sector of Origin
Figure 79: Netherlands Export and Import Value & Volume, 2023-2024 ($)
Figure 80: Belgium Polymer Foam Market Value & Volume, 2023-2030 ($)
Figure 81: Belgium GDP and Population, 2023-2024 ($)
Figure 82: Belgium GDP – Composition of 2023, By Sector of Origin
Figure 83: Belgium Export and Import Value & Volume, 2023-2024 ($)
Figure 84: Spain Polymer Foam Market Value & Volume, 2023-2030 ($)
Figure 85: Spain GDP and Population, 2023-2024 ($)
Figure 86: Spain GDP – Composition of 2023, By Sector of Origin
Figure 87: Spain Export and Import Value & Volume, 2023-2024 ($)
Figure 88: Denmark Polymer Foam Market Value & Volume, 2023-2030 ($)
Figure 89: Denmark GDP and Population, 2023-2024 ($)
Figure 90: Denmark GDP – Composition of 2023, By Sector of Origin
Figure 91: Denmark Export and Import Value & Volume, 2023-2024 ($)
Figure 92: APAC Polymer Foam Market Value & Volume, 2023-2030 ($)
Figure 93: China Polymer Foam Market Value & Volume, 2023-2030
Figure 94: China GDP and Population, 2023-2024 ($)
Figure 95: China GDP – Composition of 2023, By Sector of Origin
Figure 96: China Export and Import Value & Volume, 2023-2024 ($)Polymer Foam Market China Export and Import Value & Volume, 2023-2024 ($)
Figure 97: Australia Polymer Foam Market Value & Volume, 2023-2030 ($)
Figure 98: Australia GDP and Population, 2023-2024 ($)
Figure 99: Australia GDP – Composition of 2023, By Sector of Origin
Figure 100: Australia Export and Import Value & Volume, 2023-2024 ($)
Figure 101: South Korea Polymer Foam Market Value & Volume, 2023-2030 ($)
Figure 102: South Korea GDP and Population, 2023-2024 ($)
Figure 103: South Korea GDP – Composition of 2023, By Sector of Origin
Figure 104: South Korea Export and Import Value & Volume, 2023-2024 ($)
Figure 105: India Polymer Foam Market Value & Volume, 2023-2030 ($)
Figure 106: India GDP and Population, 2023-2024 ($)
Figure 107: India GDP – Composition of 2023, By Sector of Origin
Figure 108: India Export and Import Value & Volume, 2023-2024 ($)
Figure 109: Taiwan Polymer Foam Market Value & Volume, 2023-2030 ($)
Figure 110: Taiwan GDP and Population, 2023-2024 ($)
Figure 111: Taiwan GDP – Composition of 2023, By Sector of Origin
Figure 112: Taiwan Export and Import Value & Volume, 2023-2024 ($)
Figure 113: Malaysia Polymer Foam Market Value & Volume, 2023-2030 ($)
Figure 114: Malaysia GDP and Population, 2023-2024 ($)
Figure 115: Malaysia GDP – Composition of 2023, By Sector of Origin
Figure 116: Malaysia Export and Import Value & Volume, 2023-2024 ($)
Figure 117: Hong Kong Polymer Foam Market Value & Volume, 2023-2030 ($)
Figure 118: Hong Kong GDP and Population, 2023-2024 ($)
Figure 119: Hong Kong GDP – Composition of 2023, By Sector of Origin
Figure 120: Hong Kong Export and Import Value & Volume, 2023-2024 ($)
Figure 121: Middle East & Africa Polymer Foam Market Middle East & Africa 3D Printing Market Value & Volume, 2023-2030 ($)
Figure 122: Russia Polymer Foam Market Value & Volume, 2023-2030 ($)
Figure 123: Russia GDP and Population, 2023-2024 ($)
Figure 124: Russia GDP – Composition of 2023, By Sector of Origin
Figure 125: Russia Export and Import Value & Volume, 2023-2024 ($)
Figure 126: Israel Polymer Foam Market Value & Volume, 2023-2030 ($)
Figure 127: Israel GDP and Population, 2023-2024 ($)
Figure 128: Israel GDP – Composition of 2023, By Sector of Origin
Figure 129: Israel Export and Import Value & Volume, 2023-2024 ($)
Figure 130: Entropy Share, By Strategies, 2023-2024* (%)Polymer Foam Market
Figure 131: Developments, 2023-2024*Polymer Foam Market
Figure 132: Company 1 Polymer Foam Market Net Revenue, By Years, 2023-2024* ($)
Figure 133: Company 1 Polymer Foam Market Net Revenue Share, By Business segments, 2023 (%)
Figure 134: Company 1 Polymer Foam Market Net Sales Share, By Geography, 2023 (%)
Figure 135: Company 2 Polymer Foam Market Net Revenue, By Years, 2023-2024* ($)
Figure 136: Company 2 Polymer Foam Market Net Revenue Share, By Business segments, 2023 (%)
Figure 137: Company 2 Polymer Foam Market Net Sales Share, By Geography, 2023 (%)
Figure 138: Company 3 Polymer Foam Market Net Revenue, By Years, 2023-2024* ($)
Figure 139: Company 3 Polymer Foam Market Net Revenue Share, By Business segments, 2023 (%)
Figure 140: Company 3 Polymer Foam Market Net Sales Share, By Geography, 2023 (%)
Figure 141: Company 4 Polymer Foam Market Net Revenue, By Years, 2023-2024* ($)
Figure 142: Company 4 Polymer Foam Market Net Revenue Share, By Business segments, 2023 (%)
Figure 143: Company 4 Polymer Foam Market Net Sales Share, By Geography, 2023 (%)
Figure 144: Company 5 Polymer Foam Market Net Revenue, By Years, 2023-2024* ($)
Figure 145: Company 5 Polymer Foam Market Net Revenue Share, By Business segments, 2023 (%)
Figure 146: Company 5 Polymer Foam Market Net Sales Share, By Geography, 2023 (%)
Figure 147: Company 6 Polymer Foam Market Net Revenue, By Years, 2023-2024* ($)
Figure 148: Company 6 Polymer Foam Market Net Revenue Share, By Business segments, 2023 (%)
Figure 149: Company 6 Polymer Foam Market Net Sales Share, By Geography, 2023 (%)
Figure 150: Company 7 Polymer Foam Market Net Revenue, By Years, 2023-2024* ($)
Figure 151: Company 7 Polymer Foam Market Net Revenue Share, By Business segments, 2023 (%)
Figure 152: Company 7 Polymer Foam Market Net Sales Share, By Geography, 2023 (%)
Figure 153: Company 8 Polymer Foam Market Net Revenue, By Years, 2023-2024* ($)
Figure 154: Company 8 Polymer Foam Market Net Revenue Share, By Business segments, 2023 (%)
Figure 155: Company 8 Polymer Foam Market Net Sales Share, By Geography, 2023 (%)
Figure 156: Company 9 Polymer Foam Market Net Revenue, By Years, 2023-2024* ($)
Figure 157: Company 9 Polymer Foam Market Net Revenue Share, By Business segments, 2023 (%)
Figure 158: Company 9 Polymer Foam Market Net Sales Share, By Geography, 2023 (%)
Figure 159: Company 10 Polymer Foam Market Net Revenue, By Years, 2023-2024* ($)
Figure 160: Company 10 Polymer Foam Market Net Revenue Share, By Business segments, 2023 (%)
Figure 161: Company 10 Polymer Foam Market Net Sales Share, By Geography, 2023 (%)
Figure 162: Company 11 Polymer Foam Market Net Revenue, By Years, 2023-2024* ($)
Figure 163: Company 11 Polymer Foam Market Net Revenue Share, By Business segments, 2023 (%)
Figure 164: Company 11 Polymer Foam Market Net Sales Share, By Geography, 2023 (%)
Figure 165: Company 12 Polymer Foam Market Net Revenue, By Years, 2023-2024* ($)
Figure 166: Company 12 Polymer Foam Market Net Revenue Share, By Business segments, 2023 (%)
Figure 167: Company 12 Polymer Foam Market Net Sales Share, By Geography, 2023 (%)
Figure 168: Company 13 Polymer Foam Market Net Revenue, By Years, 2023-2024* ($)
Figure 169: Company 13 Polymer Foam Market Net Revenue Share, By Business segments, 2023 (%)
Figure 170: Company 13 Polymer Foam Market Net Sales Share, By Geography, 2023 (%)
Figure 171: Company 14 Polymer Foam Market Net Revenue, By Years, 2023-2024* ($)
Figure 172: Company 14 Polymer Foam Market Net Revenue Share, By Business segments, 2023 (%)
Figure 173: Company 14 Polymer Foam Market Net Sales Share, By Geography, 2023 (%)
Figure 174: Company 15 Polymer Foam Market Net Revenue, By Years, 2023-2024* ($)
Figure 175: Company 15 Polymer Foam Market Net Revenue Share, By Business segments, 2023 (%)
Figure 176: Company 15 Polymer Foam Market Net Sales Share, By Geography, 2023 (%)