 Email
Email Print
Print


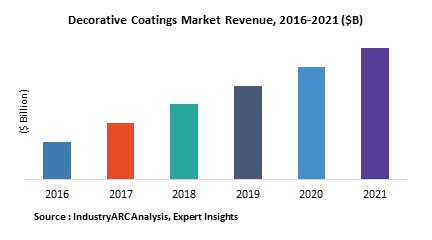
Decorative coatings are mostly used for decorative applications. However, exterior decorative coatings additionally provide protection from various environmental conditions. These coatings are applied to domestic appliances for greater looks and corrosion protection. Decorative coatings has wide range of applications in new constructions and remodelling of older buildings. The total market for decorative coatings was $25229.52 million in 2017 and is estimated grow with CAGR of 4.24% during the forecast period.
What is Decorative Coatings?
Decorative coatings are the paints and coatings used to coat buildings and homes. Most are designated for specific uses such as roof coatings, wall paints, or deck finishes. No matter its use, each architectural coating must provide certain decorative, durable, and protective functions.
Decorative coatings ensure that the buildings have the longest life span as possible. These coatings are highly useful for enhancing the sheet life, its usage and aesthetic value of the residential and commercial buildings. Major types of resins used for these coatings include alkyd, acrylic, polyurethanes and many more.
What are the major applications of Decorative Coatings?
Decorative Coatings Market has been segmented on basis of applications such as architectural, automotive, domestic appliances and others.
Market Research and Market Trends of Decorative Coatings
- Development of PVD decorative coatings technologies alternatives to chrome plating for automotive.
- In order to obtain a perfect look for an extended period of time and intense use physical vapor deposition technology is essential in decorative coatings which ensures wear resistance to the materials. Major players in the market are developing new series of coatings with a large palette of standard colors for goods that require a wear resistance surface that cannot be provided by electroplating, anodizing or lacquer. The coatings are used in numerous applications ranging from bathroom faucets, firearms, to luxury watches:
- New developments for wood coatings
- Wood is a popular material in construction especially in residential markets. However, it is facing challenges from substitute materials such as wood plastic composites, plastic and fiber cement as they offer greater dimensional stability and resistance to microbial attack. Therefore, wood formulators in decorative coatings are coming up with technical developments in coatings for interior or exterior wood applications and continuously conducting research and development activities which can aid the advancement of the decorative coatings industry and counteract these competitive threats.
- Increasing trends towards green coatings
- Globally, the interest towards green coatings is increasing rapidly due to environmental concerns. This generated a trend in the market and the manufactures are now producing products that are ecofriendly which are fueled by a new sensitivity for environmental issues by customers and policymakers. However, there are differences in the attitudes towards sustainable consumption across the globe.
Who are the Major Players in Decorative Coatings Market?
The companies referred in the market research report include the PPG Industries, Inc., Akzo Nobel N.V., The Sherwin-Williams Company, The Valspar Corporation, Axalta Coating Systems and many others.
What is our report scope?
The report incorporates in-depth assessment of the competitive landscape, product market sizing, product benchmarking, market trends, product developments, financial analysis, strategic analysis and so on to gauge the impact forces and potential opportunities of the market. Apart from this the report also includes a study of major developments in the market such as product launches, agreements, acquisitions, collaborations, mergers and so on to comprehend the prevailing market dynamics at present and its impact during the forecast period 2018-2024.
All our reports are customizable to your company needs to a certain extent, we do provide 20 free consulting hours along with purchase of each report, and this will allow you to request any additional data to customize the report to your needs.
Key Takeaways from this Report
- Evaluate market potential through analyzing growth rates (CAGR %), Volume (Units) and Value ($M) data given at country level – for product types, end use applications and by different industry verticals.
- Understand the different dynamics influencing the market – key driving factors, challenges and hidden opportunities.
- Get in-depth insights on your competitor performance – market shares, strategies, financial benchmarking, product benchmarking, SWOT and more.
- Analyze the sales and distribution channels across key geographies to improve top-line revenues.
- Understand the industry supply chain with a deep-dive on the value augmentation at each step, in order to optimize value and bring efficiencies in your processes.
- Get a quick outlook on the market entropy – M&A’s, deals, partnerships, product launches of all key players for the past 4 years.
- Evaluate the supply-demand gaps, import-export statistics and regulatory landscape for more than top 20 countries globally for the market.
1. Decorative Coatings Market - Overview
1.1. Definitions and Scope
2. Decorative Coatings Market - Executive summary
2.1. Market Revenue, Market Size and Key Trends by Company
2.2. Key Trends by type of Application
2.3. Key Trends segmented by Geography
3. Decorative Coatings Market
3.1. Comparative analysis
3.1.1. Product Benchmarking - Top 10 companies
3.1.2. Top 5 Financials Analysis
3.1.3. Market Value split by Top 10 companies
3.1.4. Patent Analysis - Top 10 companies
3.1.5. Pricing Analysis
4. Decorative Coatings Market – Startup companies Scenario Premium
4.1. Top 10 startup company Analysis by
4.1.1. Investment
4.1.2. Revenue
4.1.3. Market Shares
4.1.4. Market Size and Application Analysis
4.1.5. Venture Capital and Funding Scenario
5. Decorative Coatings Market – Industry Market Entry Scenario Premium
5.1. Regulatory Framework Overview
5.2. New Business and Ease of Doing business index
5.3. Case studies of successful ventures
5.4. Customer Analysis – Top 10 companies
6. Decorative Coatings Market Forces
6.1. Drivers
6.2. Constraints
6.3. Challenges
6.4. Porters five force model
6.4.1. Bargaining power of suppliers
6.4.2. Bargaining powers of customers
6.4.3. Threat of new entrants
6.4.4. Rivalry among existing players
6.4.5. Threat of substitutes
7. Decorative Coatings Market -Strategic analysis
7.1. Value chain analysis
7.2. Opportunities analysis
7.3. Product life cycle
7.4. Suppliers and distributors Market Share
8. Decorative Coatings Market – By Resin Type (Market Size -$Million / $Billion)
8.1. Market Size and Market Share Analysis
8.2. Application Revenue and Trend Research
8.3. Product Segment Analysis
8.3.1. Acrylic
8.3.2. Alkyd
8.3.3. Polyurethane
8.3.4. Epoxy
8.3.5. Polyester
8.3.6. Others
9. Decorative Coatings Market – By Formulation (Market Size -$Million / $Billion)
9.1. Water-Based Coatings
9.2. Solvent-Based Coatings
10. Decorative Coatings Market – By Substrate (Market Size -$Million / $Billion)
10.1. Introduction
10.2. Metal
10.3. Plastic
10.4. Glassi
10.5. Others
11. Decorative Coatings Market – By Coat Type (Market Size -$Million / $Billion)
11.1. Introduction
11.2. Top Coat
11.3. Base Coat
11.4. Others
12. Decorative Coatings Market – By Application (Market Size -$Million / $Billion)
12.1. Architectural Coatings
12.2. Automotive
12.2.1. Interiors & Exteriors
12.2.1.1. Door handles
12.2.1.2. Pushbuttons
12.2.1.3. Trim moldings
12.2.1.4. Wheels
12.2.1.5. Lighting And Reflectors
12.2.1.6. Others
12.3. Domestic Appliances
12.3.1. Home Equipment
12.3.1.1. Sanitary fixtures
12.3.1.2. Cabinets
12.3.1.3. Furniture
12.3.1.4. Exterior Siding
12.3.1.5. Faucets
12.3.1.6. Window And Door
12.3.1.7. Others
12.3.2. Electronic Appliances
12.3.2.1. Mobile phones
12.3.2.2. Medical gear
12.3.2.3. Headphones
12.3.2.4. Watches
12.3.2.5. Others
12.4. Medical
12.4.1. Electronic Implants
12.4.2. Surgical Tools
12.4.3. Orthopedics
12.4.4. Eyewear
12.5. Sporting Goods
12.6. Jewellery
12.7. Cosmetics
12.8. Aerospace
12.9. Others (Door Handles, Watches, Jewellary)
13. Decorative Coatings - By Geography (Market Size -$Million / $Billion)
13.1. Decorative Coatings Market - North America Segment Research
13.2. North America Market Research (Million / $Billion)
13.2.1. Segment type Size and Market Size Analysis
13.2.2. Revenue and Trends
13.2.3. Application Revenue and Trends by type of Application
13.2.4. Company Revenue and Product Analysis
13.2.5. North America Product type and Application Market Size
13.2.5.1. U.S.
13.2.5.2. Canada
13.2.5.3. Mexico
13.2.5.4. Rest of North America
13.3. Decorative Coatings - South America Segment Research
13.4. South America Market Research (Market Size -$Million / $Billion)
13.4.1. Segment type Size and Market Size Analysis
13.4.2. Revenue and Trends
13.4.3. Application Revenue and Trends by type of Application
13.4.4. Company Revenue and Product Analysis
13.4.5. South America Product type and Application Market Size
13.4.5.1. Brazil
13.4.5.2. Venezuela
13.4.5.3. Argentina
13.4.5.4. Ecuador
13.4.5.5. Peru
13.4.5.6. Colombia
13.4.5.7. Costa Rica
13.4.5.8. Rest of South America
13.5. Decorative Coatings - Europe Segment Research
13.6. Europe Market Research (Market Size -$Million / $Billion)
13.6.1. Segment type Size and Market Size Analysis
13.6.2. Revenue and Trends
13.6.3. Application Revenue and Trends by type of Application
13.6.4. Company Revenue and Product Analysis
13.6.5. Europe Segment Product type and Application Market Size
13.6.5.1. U.K
13.6.5.2. Germany
13.6.5.3. Italy
13.6.5.4. France
13.6.5.5. Netherlands
13.6.5.6. Belgium
13.6.5.7. Spain
13.6.5.8. Denmark
13.6.5.9. Rest of Europe
13.7. Decorative Coatings – APAC Segment Research
13.8. APAC Market Research (Market Size -$Million / $Billion)
13.8.1. Segment type Size and Market Size Analysis
13.8.2. Revenue and Trends
13.8.3. Application Revenue and Trends by type of Application
13.8.4. Company Revenue and Product Analysis
13.8.5. APAC Segment – Product type and Application Market Size
13.8.5.1. China
13.8.5.2. Australia
13.8.5.3. Japan
13.8.5.4. South Korea
13.8.5.5. India
13.8.5.6. Taiwan
13.8.5.7. Malaysia
14. Decorative Coatings Market - Entropy
14.1. New product launches
14.2. M&A's, collaborations, JVs and partnerships
15. Decorative Coatings Market – Industry / Segment Competition landscape Premium
15.1. Market Share Analysis
15.1.1. Market Share by Country- Top companies
15.1.2. Market Share by Region- Top 10 companies
15.1.3. Market Share by type of Application – Top 10 companies
15.1.4. Market Share by type of Product / Product category- Top 10 companies
15.1.5. Market Share at global level- Top 10 companies
15.1.6. Best Practises for companies
16. Decorative Coatings Market – Key Company List by Country Premium
17. Decorative Coatings Market Company Analysis
17.1. Market Share, Company Revenue, Products, M&A, Developments
17.2. PPG Industries, Inc
17.3. Akzo Nobel N.V
17.4. The Sherwin-Williams Company
17.5. The Valspar Corporation
17.6. Axalta Coating Systems
17.7. Company 6
17.8. Company 7
17.9. Company 8
17.10. Company 9
17.11. Company 10 and more
"*Financials would be provided on a best efforts basis for private companies"
18. Decorative Coatings Market -Appendix
18.1. Abbreviations
18.2. Sources
19. Decorative Coatings Market -Methodology Premium
19.1. Research Methodology
19.1.1. Company Expert Interviews
19.1.2. Industry Databases
19.1.3. Associations
19.1.4. Company News
19.1.5. Company Annual Reports
19.1.6. Application Trends
19.1.7. New Products and Product database
19.1.8. Company Transcripts
19.1.9. R&D Trends
19.1.10. Key Opinion Leaders Interviews
19.1.11. Supply and Demand Trends
List of Tables
Table 1 Decorative Coatings Market Overview 2023-2030
Table 2 Decorative Coatings Market Leader Analysis 2023-2024 (US$)
Table 3 Decorative Coatings Market Product Analysis 2023-2024 (US$)
Table 4 Decorative Coatings Market End User Analysis 2023-2024 (US$)
Table 5 Decorative Coatings Market Patent Analysis 2021-2023* (US$)
Table 6 Decorative Coatings Market Financial Analysis 2023-2024 (US$)
Table 7 Decorative Coatings Market Driver Analysis 2023-2024 (US$)
Table 8 Decorative Coatings Market Challenges Analysis 2023-2024 (US$)
Table 9 Decorative Coatings Market Constraint Analysis 2023-2024 (US$)
Table 10 Decorative Coatings Market Supplier Bargaining Power Analysis 2023-2024 (US$)
Table 11 Decorative Coatings Market Buyer Bargaining Power Analysis 2023-2024 (US$)
Table 12 Decorative Coatings Market Threat of Substitutes Analysis 2023-2024 (US$)
Table 13 Decorative Coatings Market Threat of New Entrants Analysis 2023-2024 (US$)
Table 14 Decorative Coatings Market Degree of Competition Analysis 2023-2024 (US$)
Table 15 Decorative Coatings Market Value Chain Analysis 2023-2024 (US$)
Table 16 Decorative Coatings Market Pricing Analysis 2023-2030 (US$)
Table 17 Decorative Coatings Market Opportunities Analysis 2023-2030 (US$)
Table 18 Decorative Coatings Market Product Life Cycle Analysis 2023-2030 (US$)
Table 19 Decorative Coatings Market Supplier Analysis 2023-2024 (US$)
Table 20 Decorative Coatings Market Distributor Analysis 2023-2024 (US$)
Table 21 Decorative Coatings Market Trend Analysis 2023-2024 (US$)
Table 22 Decorative Coatings Market Size 2023 (US$)
Table 23 Decorative Coatings Market Forecast Analysis 2023-2030 (US$)
Table 24 Decorative Coatings Market Sales Forecast Analysis 2023-2030 (Units)
Table 25 Decorative Coatings Market, Revenue & Volume,By Resin Type, 2023-2030 ($)
Table 26 Decorative Coatings Market By Resin Type, Revenue & Volume,By Acrylic, 2023-2030 ($)
Table 27 Decorative Coatings Market By Resin Type, Revenue & Volume,By Alkyd, 2023-2030 ($)
Table 28 Decorative Coatings Market By Resin Type, Revenue & Volume,By Polyurethanes, 2023-2030 ($)
Table 29 Decorative Coatings Market, Revenue & Volume,By Application, 2023-2030 ($)
Table 30 Decorative Coatings Market By Application, Revenue & Volume,By Architectural Coatings, 2023-2030 ($)
Table 31 Decorative Coatings Market By Application, Revenue & Volume,By Residential, 2023-2030 ($)
Table 32 Decorative Coatings Market By Application, Revenue & Volume,By Commercial, 2023-2030 ($)
Table 33 Decorative Coatings Market By Application, Revenue & Volume,By Automotive, 2023-2030 ($)
Table 34 Decorative Coatings Market By Application, Revenue & Volume,By Domestic Appliances, 2023-2030 ($)
Table 35 North America Decorative Coatings Market, Revenue & Volume,By Resin Type, 2023-2030 ($)
Table 36 North America Decorative Coatings Market, Revenue & Volume,By Application, 2023-2030 ($)
Table 37 South america Decorative Coatings Market, Revenue & Volume,By Resin Type, 2023-2030 ($)
Table 38 South america Decorative Coatings Market, Revenue & Volume,By Application, 2023-2030 ($)
Table 39 Europe Decorative Coatings Market, Revenue & Volume,By Resin Type, 2023-2030 ($)
Table 40 Europe Decorative Coatings Market, Revenue & Volume,By Application, 2023-2030 ($)
Table 41 APAC Decorative Coatings Market, Revenue & Volume,By Resin Type, 2023-2030 ($)
Table 42 APAC Decorative Coatings Market, Revenue & Volume,By Application, 2023-2030 ($)
Table 43 Middle East & Africa Decorative Coatings Market, Revenue & Volume,By Resin Type, 2023-2030 ($)
Table 44 Middle East & Africa Decorative Coatings Market, Revenue & Volume,By Application, 2023-2030 ($)
Table 45 Russia Decorative Coatings Market, Revenue & Volume,By Resin Type, 2023-2030 ($)
Table 46 Russia Decorative Coatings Market, Revenue & Volume,By Application, 2023-2030 ($)
Table 47 Israel Decorative Coatings Market, Revenue & Volume,By Resin Type, 2023-2030 ($)
Table 48 Israel Decorative Coatings Market, Revenue & Volume,By Application, 2023-2030 ($)
Table 49 Top Companies 2023 (US$)Decorative Coatings Market, Revenue & Volume,
Table 50 Product Launch 2023-2024Decorative Coatings Market, Revenue & Volume,
Table 51 Mergers & Acquistions 2023-2024Decorative Coatings Market, Revenue & Volume,
List of Figures
Figure 1 Overview of Decorative Coatings Market 2023-2030
Figure 2 Market Share Analysis for Decorative Coatings Market 2023 (US$)
Figure 3 Product Comparison in Decorative Coatings Market 2023-2024 (US$)
Figure 4 End User Profile for Decorative Coatings Market 2023-2024 (US$)
Figure 5 Patent Application and Grant in Decorative Coatings Market 2021-2023* (US$)
Figure 6 Top 5 Companies Financial Analysis in Decorative Coatings Market 2023-2024 (US$)
Figure 7 Market Entry Strategy in Decorative Coatings Market 2023-2024
Figure 8 Ecosystem Analysis in Decorative Coatings Market 2023
Figure 9 Average Selling Price in Decorative Coatings Market 2023-2030
Figure 10 Top Opportunites in Decorative Coatings Market 2023-2024
Figure 11 Market Life Cycle Analysis in Decorative Coatings Market
Figure 12 GlobalBy Resin TypeDecorative Coatings Market Revenue, 2023-2030 ($)
Figure 13 GlobalBy ApplicationDecorative Coatings Market Revenue, 2023-2030 ($)
Figure 14 Global Decorative Coatings Market - By Geography
Figure 15 Global Decorative Coatings Market Value & Volume, By Geography, 2023-2030 ($)
Figure 16 Global Decorative Coatings Market CAGR, By Geography, 2023-2030 (%)
Figure 17 North America Decorative Coatings Market Value & Volume, 2023-2030 ($)
Figure 18 US Decorative Coatings Market Value & Volume, 2023-2030 ($)
Figure 19 US GDP and Population, 2023-2024 ($)
Figure 20 US GDP – Composition of 2023, By Sector of Origin
Figure 21 US Export and Import Value & Volume, 2023-2024 ($)
Figure 22 Canada Decorative Coatings Market Value & Volume, 2023-2030 ($)
Figure 23 Canada GDP and Population, 2023-2024 ($)
Figure 24 Canada GDP – Composition of 2023, By Sector of Origin
Figure 25 Canada Export and Import Value & Volume, 2023-2024 ($)
Figure 26 Mexico Decorative Coatings Market Value & Volume, 2023-2030 ($)
Figure 27 Mexico GDP and Population, 2023-2024 ($)
Figure 28 Mexico GDP – Composition of 2023, By Sector of Origin
Figure 29 Mexico Export and Import Value & Volume, 2023-2024 ($)
Figure 30 South America Decorative Coatings Market Value & Volume, 2023-2030 ($)
Figure 31 Brazil Decorative Coatings Market Value & Volume, 2023-2030 ($)
Figure 32 Brazil GDP and Population, 2023-2024 ($)
Figure 33 Brazil GDP – Composition of 2023, By Sector of Origin
Figure 34 Brazil Export and Import Value & Volume, 2023-2024 ($)
Figure 35 Venezuela Decorative Coatings Market Value & Volume, 2023-2030 ($)
Figure 36 Venezuela GDP and Population, 2023-2024 ($)
Figure 37 Venezuela GDP – Composition of 2023, By Sector of Origin
Figure 38 Venezuela Export and Import Value & Volume, 2023-2024 ($)
Figure 39 Argentina Decorative Coatings Market Value & Volume, 2023-2030 ($)
Figure 40 Argentina GDP and Population, 2023-2024 ($)
Figure 41 Argentina GDP – Composition of 2023, By Sector of Origin
Figure 42 Argentina Export and Import Value & Volume, 2023-2024 ($)
Figure 43 Ecuador Decorative Coatings Market Value & Volume, 2023-2030 ($)
Figure 44 Ecuador GDP and Population, 2023-2024 ($)
Figure 45 Ecuador GDP – Composition of 2023, By Sector of Origin
Figure 46 Ecuador Export and Import Value & Volume, 2023-2024 ($)
Figure 47 Peru Decorative Coatings Market Value & Volume, 2023-2030 ($)
Figure 48 Peru GDP and Population, 2023-2024 ($)
Figure 49 Peru GDP – Composition of 2023, By Sector of Origin
Figure 50 Peru Export and Import Value & Volume, 2023-2024 ($)
Figure 51 Colombia Decorative Coatings Market Value & Volume, 2023-2030 ($)
Figure 52 Colombia GDP and Population, 2023-2024 ($)
Figure 53 Colombia GDP – Composition of 2023, By Sector of Origin
Figure 54 Colombia Export and Import Value & Volume, 2023-2024 ($)
Figure 55 Costa Rica Decorative Coatings Market Value & Volume, 2023-2030 ($)
Figure 56 Costa Rica GDP and Population, 2023-2024 ($)
Figure 57 Costa Rica GDP – Composition of 2023, By Sector of Origin
Figure 58 Costa Rica Export and Import Value & Volume, 2023-2024 ($)
Figure 59 Europe Decorative Coatings Market Value & Volume, 2023-2030 ($)
Figure 60 U.K Decorative Coatings Market Value & Volume, 2023-2030 ($)
Figure 61 U.K GDP and Population, 2023-2024 ($)
Figure 62 U.K GDP – Composition of 2023, By Sector of Origin
Figure 63 U.K Export and Import Value & Volume, 2023-2024 ($)
Figure 64 Germany Decorative Coatings Market Value & Volume, 2023-2030 ($)
Figure 65 Germany GDP and Population, 2023-2024 ($)
Figure 66 Germany GDP – Composition of 2023, By Sector of Origin
Figure 67 Germany Export and Import Value & Volume, 2023-2024 ($)
Figure 68 Italy Decorative Coatings Market Value & Volume, 2023-2030 ($)
Figure 69 Italy GDP and Population, 2023-2024 ($)
Figure 70 Italy GDP – Composition of 2023, By Sector of Origin
Figure 71 Italy Export and Import Value & Volume, 2023-2024 ($)
Figure 72 France Decorative Coatings Market Value & Volume, 2023-2030 ($)
Figure 73 France GDP and Population, 2023-2024 ($)
Figure 74 France GDP – Composition of 2023, By Sector of Origin
Figure 75 France Export and Import Value & Volume, 2023-2024 ($)
Figure 76 Netherlands Decorative Coatings Market Value & Volume, 2023-2030 ($)
Figure 77 Netherlands GDP and Population, 2023-2024 ($)
Figure 78 Netherlands GDP – Composition of 2023, By Sector of Origin
Figure 79 Netherlands Export and Import Value & Volume, 2023-2024 ($)
Figure 80 Belgium Decorative Coatings Market Value & Volume, 2023-2030 ($)
Figure 81 Belgium GDP and Population, 2023-2024 ($)
Figure 82 Belgium GDP – Composition of 2023, By Sector of Origin
Figure 83 Belgium Export and Import Value & Volume, 2023-2024 ($)
Figure 84 Spain Decorative Coatings Market Value & Volume, 2023-2030 ($)
Figure 85 Spain GDP and Population, 2023-2024 ($)
Figure 86 Spain GDP – Composition of 2023, By Sector of Origin
Figure 87 Spain Export and Import Value & Volume, 2023-2024 ($)
Figure 88 Denmark Decorative Coatings Market Value & Volume, 2023-2030 ($)
Figure 89 Denmark GDP and Population, 2023-2024 ($)
Figure 90 Denmark GDP – Composition of 2023, By Sector of Origin
Figure 91 Denmark Export and Import Value & Volume, 2023-2024 ($)
Figure 92 APAC Decorative Coatings Market Value & Volume, 2023-2030 ($)
Figure 93 China Decorative Coatings Market Value & Volume, 2023-2030
Figure 94 China GDP and Population, 2023-2024 ($)
Figure 95 China GDP – Composition of 2023, By Sector of Origin
Figure 96 China Export and Import Value & Volume, 2023-2024 ($)Decorative Coatings Market China Export and Import Value & Volume, 2023-2024 ($)
Figure 97 Australia Decorative Coatings Market Value & Volume, 2023-2030 ($)
Figure 98 Australia GDP and Population, 2023-2024 ($)
Figure 99 Australia GDP – Composition of 2023, By Sector of Origin
Figure 100 Australia Export and Import Value & Volume, 2023-2024 ($)
Figure 101 South Korea Decorative Coatings Market Value & Volume, 2023-2030 ($)
Figure 102 South Korea GDP and Population, 2023-2024 ($)
Figure 103 South Korea GDP – Composition of 2023, By Sector of Origin
Figure 104 South Korea Export and Import Value & Volume, 2023-2024 ($)
Figure 105 India Decorative Coatings Market Value & Volume, 2023-2030 ($)
Figure 106 India GDP and Population, 2023-2024 ($)
Figure 107 India GDP – Composition of 2023, By Sector of Origin
Figure 108 India Export and Import Value & Volume, 2023-2024 ($)
Figure 109 Taiwan Decorative Coatings Market Value & Volume, 2023-2030 ($)
Figure 110 Taiwan GDP and Population, 2023-2024 ($)
Figure 111 Taiwan GDP – Composition of 2023, By Sector of Origin
Figure 112 Taiwan Export and Import Value & Volume, 2023-2024 ($)
Figure 113 Malaysia Decorative Coatings Market Value & Volume, 2023-2030 ($)
Figure 114 Malaysia GDP and Population, 2023-2024 ($)
Figure 115 Malaysia GDP – Composition of 2023, By Sector of Origin
Figure 116 Malaysia Export and Import Value & Volume, 2023-2024 ($)
Figure 117 Hong Kong Decorative Coatings Market Value & Volume, 2023-2030 ($)
Figure 118 Hong Kong GDP and Population, 2023-2024 ($)
Figure 119 Hong Kong GDP – Composition of 2023, By Sector of Origin
Figure 120 Hong Kong Export and Import Value & Volume, 2023-2024 ($)
Figure 121 Middle East & Africa Decorative Coatings Market Middle East & Africa 3D Printing Market Value & Volume, 2023-2030 ($)
Figure 122 Russia Decorative Coatings Market Value & Volume, 2023-2030 ($)
Figure 123 Russia GDP and Population, 2023-2024 ($)
Figure 124 Russia GDP – Composition of 2023, By Sector of Origin
Figure 125 Russia Export and Import Value & Volume, 2023-2024 ($)
Figure 126 Israel Decorative Coatings Market Value & Volume, 2023-2030 ($)
Figure 127 Israel GDP and Population, 2023-2024 ($)
Figure 128 Israel GDP – Composition of 2023, By Sector of Origin
Figure 129 Israel Export and Import Value & Volume, 2023-2024 ($)
Figure 130 Entropy Share, By Strategies, 2023-2024* (%)Decorative Coatings Market
Figure 131 Developments, 2023-2024*Decorative Coatings Market
Figure 132 Company 1 Decorative Coatings Market Net Revenue, By Years, 2023-2024* ($)
Figure 133 Company 1 Decorative Coatings Market Net Revenue Share, By Business segments, 2023 (%)
Figure 134 Company 1 Decorative Coatings Market Net Sales Share, By Geography, 2023 (%)
Figure 135 Company 2 Decorative Coatings Market Net Revenue, By Years, 2023-2024* ($)
Figure 136 Company 2 Decorative Coatings Market Net Revenue Share, By Business segments, 2023 (%)
Figure 137 Company 2 Decorative Coatings Market Net Sales Share, By Geography, 2023 (%)
Figure 138 Company 3Decorative Coatings Market Net Revenue, By Years, 2023-2024* ($)
Figure 139 Company 3Decorative Coatings Market Net Revenue Share, By Business segments, 2023 (%)
Figure 140 Company 3Decorative Coatings Market Net Sales Share, By Geography, 2023 (%)
Figure 141 Company 4 Decorative Coatings Market Net Revenue, By Years, 2023-2024* ($)
Figure 142 Company 4 Decorative Coatings Market Net Revenue Share, By Business segments, 2023 (%)
Figure 143 Company 4 Decorative Coatings Market Net Sales Share, By Geography, 2023 (%)
Figure 144 Company 5 Decorative Coatings Market Net Revenue, By Years, 2023-2024* ($)
Figure 145 Company 5 Decorative Coatings Market Net Revenue Share, By Business segments, 2023 (%)
Figure 146 Company 5 Decorative Coatings Market Net Sales Share, By Geography, 2023 (%)
Figure 147 Company 6 Decorative Coatings Market Net Revenue, By Years, 2023-2024* ($)
Figure 148 Company 6 Decorative Coatings Market Net Revenue Share, By Business segments, 2023 (%)
Figure 149 Company 6 Decorative Coatings Market Net Sales Share, By Geography, 2023 (%)
Figure 150 Company 7 Decorative Coatings Market Net Revenue, By Years, 2023-2024* ($)
Figure 151 Company 7 Decorative Coatings Market Net Revenue Share, By Business segments, 2023 (%)
Figure 152 Company 7 Decorative Coatings Market Net Sales Share, By Geography, 2023 (%)
Figure 153 Company 8 Decorative Coatings Market Net Revenue, By Years, 2023-2024* ($)
Figure 154 Company 8 Decorative Coatings Market Net Revenue Share, By Business segments, 2023 (%)
Figure 155 Company 8 Decorative Coatings Market Net Sales Share, By Geography, 2023 (%)
Figure 156 Company 9 Decorative Coatings Market Net Revenue, By Years, 2023-2024* ($)
Figure 157 Company 9 Decorative Coatings Market Net Revenue Share, By Business segments, 2023 (%)
Figure 158 Company 9 Decorative Coatings Market Net Sales Share, By Geography, 2023 (%)
Figure 159 Company 10 Decorative Coatings Market Net Revenue, By Years, 2023-2024* ($)
Figure 160 Company 10 Decorative Coatings Market Net Revenue Share, By Business segments, 2023 (%)
Figure 161 Company 10 Decorative Coatings Market Net Sales Share, By Geography, 2023 (%)
Figure 162 Company 11 Decorative Coatings Market Net Revenue, By Years, 2023-2024* ($)
Figure 163 Company 11 Decorative Coatings Market Net Revenue Share, By Business segments, 2023 (%)
Figure 164 Company 11 Decorative Coatings Market Net Sales Share, By Geography, 2023 (%)
Figure 165 Company 12 Decorative Coatings Market Net Revenue, By Years, 2023-2024* ($)
Figure 166 Company 12 Decorative Coatings Market Net Revenue Share, By Business segments, 2023 (%)
Figure 167 Company 12 Decorative Coatings Market Net Sales Share, By Geography, 2023 (%)
Figure 168 Company 13Decorative Coatings Market Net Revenue, By Years, 2023-2024* ($)
Figure 169 Company 13Decorative Coatings Market Net Revenue Share, By Business segments, 2023 (%)
Figure 170 Company 13Decorative Coatings Market Net Sales Share, By Geography, 2023 (%)
Figure 171 Company 14 Decorative Coatings Market Net Revenue, By Years, 2023-2024* ($)
Figure 172 Company 14 Decorative Coatings Market Net Revenue Share, By Business segments, 2023 (%)
Figure 173 Company 14 Decorative Coatings Market Net Sales Share, By Geography, 2023 (%)
Figure 174 Company 15 Decorative Coatings Market Net Revenue, By Years, 2023-2024* ($)
Figure 175 Company 15 Decorative Coatings Market Net Revenue Share, By Business segments, 2023 (%)
Figure 176 Company 15 Decorative Coatings Market Net Sales Share, By Geography, 2023 (%)