 Email
Email Print
Print


Plasticizers Market - Industry Analysis, Market Size, Share, Trends, Application Analysis, Growth And Forecast 2024-2030
Plasticizers Market Overview:
Market Snapshot:

Plasticizers Market - Report Coverage:
COVID-19 / Ukraine Crisis - Impact Analysis:
- The COVID-19 pandemic has had a mixed impact on the plasticizers market. Initially, there was a disruption in supply chains and manufacturing activities due to lockdowns and restrictions, leading to a temporary slowdown in demand. However, as the pandemic progressed, there was an increased demand for plasticizers in essential sectors like healthcare, packaging, and sanitation products. The surge in e-commerce and online deliveries also boosted the demand for packaging materials, driving the plasticizers market. Additionally, the focus on hygiene and sanitation further stimulated demand for PVC-based products, thereby positively impacting the plasticizers market amidst the pandemic's challenges.
- The Russia-Ukraine crisis can impact the plasticizers market through several channels. Disruption in the supply of raw materials such as ethylene and propylene, which are essential for plasticizer production, may occur due to geopolitical tensions affecting trade routes and logistics. Fluctuations in energy prices, as Russia is a major supplier of natural gas, can also influence production costs. Moreover, economic uncertainty stemming from the crisis may dampen consumer demand and investment, affecting downstream industries like construction and automotive, key consumers of plasticizers. Overall, the crisis may lead to supply chain disruptions, cost volatility, and reduced market growth potential for plasticizers.
Key Takeaways:
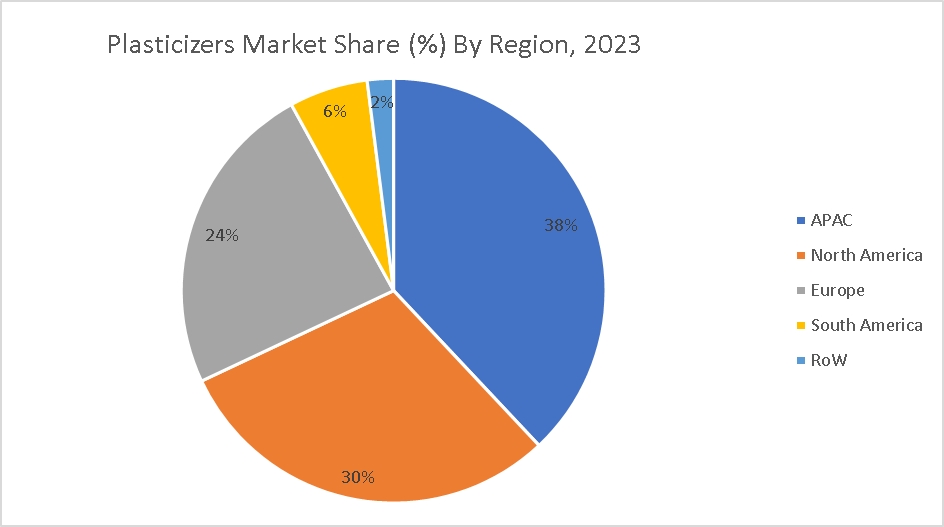
- Asia Pacific stands out as the highest growing geographic market in the plasticizers industry due to rapid industrialization, urbanization, and increasing construction activities across countries like China, India, and Southeast Asian nations. Additionally, rising disposable incomes and evolving consumer preferences fuel demand for plasticized products in diverse sectors such as automotive, construction, and consumer goods, propelling market expansion in the region.
- Non-phthalate plasticizers are experiencing rapid growth due to regulatory concerns over phthalates' health risks. Industries are shifting towards safer alternatives, driving innovation and demand for non-phthalate plasticizers in various applications worldwide.
- Electrical & Electronics emerges as the highest growing end-use industry in the plasticizers market due to the growing demand for flexible PVC insulation and cable materials, driven by advancements in technology, increased connectivity, and expansion of the electronics manufacturing sector.
Plasticizers Market Segment Analysis – By Type
Plasticizers Market Segment Analysis – By Application
Plasticizers Market Segment Analysis – By End Use Industry
Plasticizers Market Segment Analysis – By Geography
Plasticizers Market Drivers
Growth in Food Packaging Industry
Growth of Cosmetics and Personal Care Industry
Plasticizers Market Challenges
Regulative Restriction due to Harmful Health Effects
Market Landscape
Developments:
- BASF continues to innovate in agriculture. In 2023, they launched Liberty® ULTRA herbicide, a new seed treatment (Poncho® Votivo® Precise), and xarvio® SeedSelect technology for improved yield. They also unveiled ONE SMART SPRAY, their smart farming tech brand, and received approvals for new cotton traits.
- Mitsubishi Chemical Group recently launched Green KTF™, a mostly plant-based film in March 202, and DURABIO™, a bio-based engineering plastic in February 2022. They've also developed a high heat-resistant ceramic material.
List of Tables
Table 1: Plasticizers Market Overview 2023-2030
Table 2: Plasticizers Market Leader Analysis 2023-2024 (US$)
Table 3: Plasticizers Market Product Analysis 2023-2024 (US$)
Table 4: Plasticizers Market End User Analysis 2023-2024 (US$)
Table 5: Plasticizers Market Patent Analysis 2021-2023* (US$)
Table 6: Plasticizers Market Financial Analysis 2023-2024 (US$)
Table 7: Plasticizers Market Driver Analysis 2023-2024 (US$)
Table 8: Plasticizers Market Challenges Analysis 2023-2024 (US$)
Table 9: Plasticizers Market Constraint Analysis 2023-2024 (US$)
Table 10: Plasticizers Market Supplier Bargaining Power Analysis 2023-2024 (US$)
Table 11: Plasticizers Market Buyer Bargaining Power Analysis 2023-2024 (US$)
Table 12: Plasticizers Market Threat of Substitutes Analysis 2023-2024 (US$)
Table 13: Plasticizers Market Threat of New Entrants Analysis 2023-2024 (US$)
Table 14: Plasticizers Market Degree of Competition Analysis 2023-2024 (US$)
Table 15: Plasticizers Market Value Chain Analysis 2023-2024 (US$)
Table 16: Plasticizers Market Pricing Analysis 2023-2030 (US$)
Table 17: Plasticizers Market Opportunities Analysis 2023-2030 (US$)
Table 18: Plasticizers Market Product Life Cycle Analysis 2023-2030 (US$)
Table 19: Plasticizers Market Supplier Analysis 2023-2024 (US$)
Table 20: Plasticizers Market Distributor Analysis 2023-2024 (US$)
Table 21: Plasticizers Market Trend Analysis 2023-2024 (US$)
Table 22: Plasticizers Market Size 2023 (US$)
Table 23: Plasticizers Market Forecast Analysis 2023-2030 (US$)
Table 24: Plasticizers Market Sales Forecast Analysis 2023-2030 (Units)
Table 25: Plasticizers Market, Revenue & Volume, By Type, 2023-2030 ($)
Table 26: Plasticizers Market By Type, Revenue & Volume, By Phthalates, 2023-2030 ($)
Table 27: Plasticizers Market By Type, Revenue & Volume, By Non-Phthalates, 2023-2030 ($)
Table 28: Plasticizers Market, Revenue & Volume, By Application, 2023-2030 ($)
Table 29: Plasticizers Market By Application, Revenue & Volume, By Automobile Industry, 2023-2030 ($)
Table 30: Plasticizers Market By Application, Revenue & Volume, By Building and Construction, 2023-2030 ($)
Table 31: Plasticizers Market By Application, Revenue & Volume, By Electrical and Cable Industry, 2023-2030 ($)
Table 32: Plasticizers Market By Application, Revenue & Volume, By Food and Beverage Industry, 2023-2030 ($)
Table 33: Plasticizers Market By Application, Revenue & Volume, By Furniture, 2023-2030 ($)
Table 34: North America Plasticizers Market, Revenue & Volume, By Type, 2023-2030 ($)
Table 35: North America Plasticizers Market, Revenue & Volume, By Application, 2023-2030 ($)
Table 36: South america Plasticizers Market, Revenue & Volume, By Type, 2023-2030 ($)
Table 37: South america Plasticizers Market, Revenue & Volume, By Application, 2023-2030 ($)
Table 38: Europe Plasticizers Market, Revenue & Volume, By Type, 2023-2030 ($)
Table 39: Europe Plasticizers Market, Revenue & Volume, By Application, 2023-2030 ($)
Table 40: APAC Plasticizers Market, Revenue & Volume, By Type, 2023-2030 ($)
Table 41: APAC Plasticizers Market, Revenue & Volume, By Application, 2023-2030 ($)
Table 42: Middle East & Africa Plasticizers Market, Revenue & Volume, By Type, 2023-2030 ($)
Table 43: Middle East & Africa Plasticizers Market, Revenue & Volume, By Application, 2023-2030 ($)
Table 44: Russia Plasticizers Market, Revenue & Volume, By Type, 2023-2030 ($)
Table 45: Russia Plasticizers Market, Revenue & Volume, By Application, 2023-2030 ($)
Table 46: Israel Plasticizers Market, Revenue & Volume, By Type, 2023-2030 ($)
Table 47: Israel Plasticizers Market, Revenue & Volume, By Application, 2023-2030 ($)
Table 48: Top Companies 2023 (US$)Plasticizers Market, Revenue & Volume
Table 49: Product Launch 2023-2024Plasticizers Market, Revenue & Volume
Table 50: Mergers & Acquistions 2023-2024Plasticizers Market, Revenue & Volume
List of Figures
Figure 1: Overview of Plasticizers Market 2023-2030
Figure 2: Market Share Analysis for Plasticizers Market 2023 (US$)
Figure 3: Product Comparison in Plasticizers Market 2023-2024 (US$)
Figure 4: End User Profile for Plasticizers Market 2023-2024 (US$)
Figure 5: Patent Application and Grant in Plasticizers Market 2021-2023* (US$)
Figure 6: Top 5 Companies Financial Analysis in Plasticizers Market 2023-2024 (US$)
Figure 7: Market Entry Strategy in Plasticizers Market 2023-2024
Figure 8: Ecosystem Analysis in Plasticizers Market 2023
Figure 9: Average Selling Price in Plasticizers Market 2023-2030
Figure 10: Top Opportunites in Plasticizers Market 2023-2024
Figure 11: Market Life Cycle Analysis in Plasticizers Market
Figure 12: GlobalBy TypePlasticizers Market Revenue, 2023-2030 ($)
Figure 13: GlobalBy ApplicationPlasticizers Market Revenue, 2023-2030 ($)
Figure 14: Global Plasticizers Market - By Geography
Figure 15: Global Plasticizers Market Value & Volume, By Geography, 2023-2030 ($)
Figure 16: Global Plasticizers Market CAGR, By Geography, 2023-2030 (%)
Figure 17: North America Plasticizers Market Value & Volume, 2023-2030 ($)
Figure 18: US Plasticizers Market Value & Volume, 2023-2030 ($)
Figure 19: US GDP and Population, 2023-2024 ($)
Figure 20: US GDP – Composition of 2023, By Sector of Origin
Figure 21: US Export and Import Value & Volume, 2023-2024 ($)
Figure 22: Canada Plasticizers Market Value & Volume, 2023-2030 ($)
Figure 23: Canada GDP and Population, 2023-2024 ($)
Figure 24: Canada GDP – Composition of 2023, By Sector of Origin
Figure 25: Canada Export and Import Value & Volume, 2023-2024 ($)
Figure 26: Mexico Plasticizers Market Value & Volume, 2023-2030 ($)
Figure 27: Mexico GDP and Population, 2023-2024 ($)
Figure 28: Mexico GDP – Composition of 2023, By Sector of Origin
Figure 29: Mexico Export and Import Value & Volume, 2023-2024 ($)
Figure 30: South America Plasticizers Market Value & Volume, 2023-2030 ($)
Figure 31: Brazil Plasticizers Market Value & Volume, 2023-2030 ($)
Figure 32: Brazil GDP and Population, 2023-2024 ($)
Figure 33: Brazil GDP – Composition of 2023, By Sector of Origin
Figure 34: Brazil Export and Import Value & Volume, 2023-2024 ($)
Figure 35: Venezuela Plasticizers Market Value & Volume, 2023-2030 ($)
Figure 36: Venezuela GDP and Population, 2023-2024 ($)
Figure 37: Venezuela GDP – Composition of 2023, By Sector of Origin
Figure 38: Venezuela Export and Import Value & Volume, 2023-2024 ($)
Figure 39: Argentina Plasticizers Market Value & Volume, 2023-2030 ($)
Figure 40: Argentina GDP and Population, 2023-2024 ($)
Figure 41: Argentina GDP – Composition of 2023, By Sector of Origin
Figure 42: Argentina Export and Import Value & Volume, 2023-2024 ($)
Figure 43: Ecuador Plasticizers Market Value & Volume, 2023-2030 ($)
Figure 44: Ecuador GDP and Population, 2023-2024 ($)
Figure 45: Ecuador GDP – Composition of 2023, By Sector of Origin
Figure 46: Ecuador Export and Import Value & Volume, 2023-2024 ($)
Figure 47: Peru Plasticizers Market Value & Volume, 2023-2030 ($)
Figure 48: Peru GDP and Population, 2023-2024 ($)
Figure 49: Peru GDP – Composition of 2023, By Sector of Origin
Figure 50: Peru Export and Import Value & Volume, 2023-2024 ($)
Figure 51: Colombia Plasticizers Market Value & Volume, 2023-2030 ($)
Figure 52: Colombia GDP and Population, 2023-2024 ($)
Figure 53: Colombia GDP – Composition of 2023, By Sector of Origin
Figure 54: Colombia Export and Import Value & Volume, 2023-2024 ($)
Figure 55: Costa Rica Plasticizers Market Value & Volume, 2023-2030 ($)
Figure 56: Costa Rica GDP and Population, 2023-2024 ($)
Figure 57: Costa Rica GDP – Composition of 2023, By Sector of Origin
Figure 58: Costa Rica Export and Import Value & Volume, 2023-2024 ($)
Figure 59: Europe Plasticizers Market Value & Volume, 2023-2030 ($)
Figure 60: U.K Plasticizers Market Value & Volume, 2023-2030 ($)
Figure 61: U.K GDP and Population, 2023-2024 ($)
Figure 62: U.K GDP – Composition of 2023, By Sector of Origin
Figure 63: U.K Export and Import Value & Volume, 2023-2024 ($)
Figure 64: Germany Plasticizers Market Value & Volume, 2023-2030 ($)
Figure 65: Germany GDP and Population, 2023-2024 ($)
Figure 66: Germany GDP – Composition of 2023, By Sector of Origin
Figure 67: Germany Export and Import Value & Volume, 2023-2024 ($)
Figure 68: Italy Plasticizers Market Value & Volume, 2023-2030 ($)
Figure 69: Italy GDP and Population, 2023-2024 ($)
Figure 70: Italy GDP – Composition of 2023, By Sector of Origin
Figure 71: Italy Export and Import Value & Volume, 2023-2024 ($)
Figure 72: France Plasticizers Market Value & Volume, 2023-2030 ($)
Figure 73: France GDP and Population, 2023-2024 ($)
Figure 74: France GDP – Composition of 2023, By Sector of Origin
Figure 75: France Export and Import Value & Volume, 2023-2024 ($)
Figure 76: Netherlands Plasticizers Market Value & Volume, 2023-2030 ($)
Figure 77: Netherlands GDP and Population, 2023-2024 ($)
Figure 78: Netherlands GDP – Composition of 2023, By Sector of Origin
Figure 79: Netherlands Export and Import Value & Volume, 2023-2024 ($)
Figure 80: Belgium Plasticizers Market Value & Volume, 2023-2030 ($)
Figure 81: Belgium GDP and Population, 2023-2024 ($)
Figure 82: Belgium GDP – Composition of 2023, By Sector of Origin
Figure 83: Belgium Export and Import Value & Volume, 2023-2024 ($)
Figure 84: Spain Plasticizers Market Value & Volume, 2023-2030 ($)
Figure 85: Spain GDP and Population, 2023-2024 ($)
Figure 86: Spain GDP – Composition of 2023, By Sector of Origin
Figure 87: Spain Export and Import Value & Volume, 2023-2024 ($)
Figure 88: Denmark Plasticizers Market Value & Volume, 2023-2030 ($)
Figure 89: Denmark GDP and Population, 2023-2024 ($)
Figure 90: Denmark GDP – Composition of 2023, By Sector of Origin
Figure 91: Denmark Export and Import Value & Volume, 2023-2024 ($)
Figure 92: APAC Plasticizers Market Value & Volume, 2023-2030 ($)
Figure 93: China Plasticizers Market Value & Volume, 2023-2030
Figure 94: China GDP and Population, 2023-2024 ($)
Figure 95: China GDP – Composition of 2023, By Sector of Origin
Figure 96: China Export and Import Value & Volume, 2023-2024 ($)Plasticizers Market China Export and Import Value & Volume, 2023-2024 ($)
Figure 97: Australia Plasticizers Market Value & Volume, 2023-2030 ($)
Figure 98: Australia GDP and Population, 2023-2024 ($)
Figure 99: Australia GDP – Composition of 2023, By Sector of Origin
Figure 100: Australia Export and Import Value & Volume, 2023-2024 ($)
Figure 101: South Korea Plasticizers Market Value & Volume, 2023-2030 ($)
Figure 102: South Korea GDP and Population, 2023-2024 ($)
Figure 103: South Korea GDP – Composition of 2023, By Sector of Origin
Figure 104: South Korea Export and Import Value & Volume, 2023-2024 ($)
Figure 105: India Plasticizers Market Value & Volume, 2023-2030 ($)
Figure 106: India GDP and Population, 2023-2024 ($)
Figure 107: India GDP – Composition of 2023, By Sector of Origin
Figure 108: India Export and Import Value & Volume, 2023-2024 ($)
Figure 109: Taiwan Plasticizers Market Value & Volume, 2023-2030 ($)
Figure 110: Taiwan GDP and Population, 2023-2024 ($)
Figure 111: Taiwan GDP – Composition of 2023, By Sector of Origin
Figure 112: Taiwan Export and Import Value & Volume, 2023-2024 ($)
Figure 113: Malaysia Plasticizers Market Value & Volume, 2023-2030 ($)
Figure 114: Malaysia GDP and Population, 2023-2024 ($)
Figure 115: Malaysia GDP – Composition of 2023, By Sector of Origin
Figure 116: Malaysia Export and Import Value & Volume, 2023-2024 ($)
Figure 117: Hong Kong Plasticizers Market Value & Volume, 2023-2030 ($)
Figure 118: Hong Kong GDP and Population, 2023-2024 ($)
Figure 119: Hong Kong GDP – Composition of 2023, By Sector of Origin
Figure 120: Hong Kong Export and Import Value & Volume, 2023-2024 ($)
Figure 121: Middle East & Africa Plasticizers Market Middle East & Africa 3D Printing Market Value & Volume, 2023-2030 ($)
Figure 122: Russia Plasticizers Market Value & Volume, 2023-2030 ($)
Figure 123: Russia GDP and Population, 2023-2024 ($)
Figure 124: Russia GDP – Composition of 2023, By Sector of Origin
Figure 125: Russia Export and Import Value & Volume, 2023-2024 ($)
Figure 126: Israel Plasticizers Market Value & Volume, 2023-2030 ($)
Figure 127: Israel GDP and Population, 2023-2024 ($)
Figure 128: Israel GDP – Composition of 2023, By Sector of Origin
Figure 129: Israel Export and Import Value & Volume, 2023-2024 ($)
Figure 130: Entropy Share, By Strategies, 2023-2024* (%)Plasticizers Market
Figure 131: Developments, 2023-2024*Plasticizers Market
Figure 132: Company 1 Plasticizers Market Net Revenue, By Years, 2023-2024* ($)
Figure 133: Company 1 Plasticizers Market Net Revenue Share, By Business segments, 2023 (%)
Figure 134: Company 1 Plasticizers Market Net Sales Share, By Geography, 2023 (%)
Figure 135: Company 2 Plasticizers Market Net Revenue, By Years, 2023-2024* ($)
Figure 136: Company 2 Plasticizers Market Net Revenue Share, By Business segments, 2023 (%)
Figure 137: Company 2 Plasticizers Market Net Sales Share, By Geography, 2023 (%)
Figure 138: Company 3 Plasticizers Market Net Revenue, By Years, 2023-2024* ($)
Figure 139: Company 3 Plasticizers Market Net Revenue Share, By Business segments, 2023 (%)
Figure 140: Company 3 Plasticizers Market Net Sales Share, By Geography, 2023 (%)
Figure 141: Company 4 Plasticizers Market Net Revenue, By Years, 2023-2024* ($)
Figure 142: Company 4 Plasticizers Market Net Revenue Share, By Business segments, 2023 (%)
Figure 143: Company 4 Plasticizers Market Net Sales Share, By Geography, 2023 (%)
Figure 144: Company 5 Plasticizers Market Net Revenue, By Years, 2023-2024* ($)
Figure 145: Company 5 Plasticizers Market Net Revenue Share, By Business segments, 2023 (%)
Figure 146: Company 5 Plasticizers Market Net Sales Share, By Geography, 2023 (%)
Figure 147: Company 6 Plasticizers Market Net Revenue, By Years, 2023-2024* ($)
Figure 148: Company 6 Plasticizers Market Net Revenue Share, By Business segments, 2023 (%)
Figure 149: Company 6 Plasticizers Market Net Sales Share, By Geography, 2023 (%)
Figure 150: Company 7 Plasticizers Market Net Revenue, By Years, 2023-2024* ($)
Figure 151: Company 7 Plasticizers Market Net Revenue Share, By Business segments, 2023 (%)
Figure 152: Company 7 Plasticizers Market Net Sales Share, By Geography, 2023 (%)
Figure 153: Company 8 Plasticizers Market Net Revenue, By Years, 2023-2024* ($)
Figure 154: Company 8 Plasticizers Market Net Revenue Share, By Business segments, 2023 (%)
Figure 155: Company 8 Plasticizers Market Net Sales Share, By Geography, 2023 (%)
Figure 156: Company 9 Plasticizers Market Net Revenue, By Years, 2023-2024* ($)
Figure 157: Company 9 Plasticizers Market Net Revenue Share, By Business segments, 2023 (%)
Figure 158: Company 9 Plasticizers Market Net Sales Share, By Geography, 2023 (%)
Figure 159: Company 10 Plasticizers Market Net Revenue, By Years, 2023-2024* ($)
Figure 160: Company 10 Plasticizers Market Net Revenue Share, By Business segments, 2023 (%)
Figure 161: Company 10 Plasticizers Market Net Sales Share, By Geography, 2023 (%)
Figure 162: Company 11 Plasticizers Market Net Revenue, By Years, 2023-2024* ($)
Figure 163: Company 11 Plasticizers Market Net Revenue Share, By Business segments, 2023 (%)
Figure 164: Company 11 Plasticizers Market Net Sales Share, By Geography, 2023 (%)
Figure 165: Company 12 Plasticizers Market Net Revenue, By Years, 2023-2024* ($)
Figure 166: Company 12 Plasticizers Market Net Revenue Share, By Business segments, 2023 (%)
Figure 167: Company 12 Plasticizers Market Net Sales Share, By Geography, 2023 (%)
Figure 168: Company 13 Plasticizers Market Net Revenue, By Years, 2023-2024* ($)
Figure 169: Company 13 Plasticizers Market Net Revenue Share, By Business segments, 2023 (%)
Figure 170: Company 13 Plasticizers Market Net Sales Share, By Geography, 2023 (%)
Figure 171: Company 14 Plasticizers Market Net Revenue, By Years, 2023-2024* ($)
Figure 172: Company 14 Plasticizers Market Net Revenue Share, By Business segments, 2023 (%)
Figure 173: Company 14 Plasticizers Market Net Sales Share, By Geography, 2023 (%)
Figure 174: Company 15 Plasticizers Market Net Revenue, By Years, 2023-2024* ($)
Figure 175: Company 15 Plasticizers Market Net Revenue Share, By Business segments, 2023 (%)
Figure 176: Company 15 Plasticizers Market Net Sales Share, By Geography, 2023 (%)