 Email
Email Print
Print


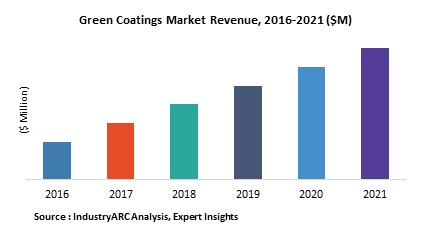
The Global Green Coatings market was $ 9,648.55 million in 2017 and is estimated grow with CAGR of 8.12% till 2023. Green Coatings are majorly used in architectural segment with water-based formulation so as to reduce environmental footprint. The emerging trend that have a direct impact on the dynamics of green coatings industry is the increasing use of UV coatings along with high solids formulation which has increased its usage over aerospace sectors.
Asia-Pacific will remain as the fastest growing market during the forecast period due to its immense opportunities in both architecture and automotive sectors with Europe being the most mature and largest markets owing to its strict rules and regulations laid down by various environmental protection bodies.
UV coatings are the highly priced green coatings in the market till date costing more than $18000/ ton. Since this type of coatings is quite recently developed the pricing of this type of coatings will not degrade when compared to others. On the other hand water borne coatings is the most used formulation out of all these formulations and is minimum in price and the price will decrease in future due to enough production and easy hassle free manufacturing of raw materials.
What is Green Coatings?
Green coatings are nothing but normal day to day coatings that have low VOC content which have less environment footprint. The importance of developing sustainable products remains as one of the major concern for coatings as well as paints manufacturers. From OEM equipment manufacturers to DIY consumers, low VOC coatings are preferred all over. Due to the stringent laws and regulations coatings manufacturers have recognized the importance to deliver low and zero VOC products. Manufacturers are working even harder to develop high performance low VOC coatings that have specific application and are durable enough for extreme conditions. In February 2003, in response to the organizations like Leadership in Energy and Environmental Design (LEED) and Energy Star the first restriction on VOC emission was introduced which was termed as Restriction of Hazardous Substances Directive (RoHS) and was set up for Europe. Since then coatings manufacturers have been working tirelessly to produce more and more green coatings adhering to all laws and regulations.
What are the major applications of Green Coatings?
The applications which are taken into account are architectural, industrial, automotive, and aerospace and others which are based on the importance and usage of green and low VOC coatings
Market Research and Market Trends of Green Coatings
- Rise in architectural sector in developing countries such as China, Japan and so on have also made the market strong enough in Asia-Pacific.
- The world population is set to reach 8.5 billion by 2030, according to UN reports which means there will be tremendous growth in architectural sector in developed as well as developing nations have made the market of low VOC as well as green coatings mature enough comparatively at a short time span.
- The use of conventional solvent coatings have reduced significantly in architectural sectors due to its ill effects on environment as well as human beings
- The market of coatings as a whole is mature enough and has simultaneously led the market of green coatings to grow.
- The global coatings market is more than $100 bn. Such a mature market always provides an advantage to substitutes when the conventional one is limited due to any reasons such as laws and regulations in this case.
Who are the Major Players in Green Coatings Market?
The companies referred in the market research report include Jotun, Axalta, Valsapar, PPG Industries Inc., and others
What is our report scope?
The report incorporates in-depth assessment of the competitive landscape, product market sizing, product benchmarking, market trends, product developments, financial analysis, strategic analysis and so on to gauge the impact forces and potential opportunities of the market. Apart from this the report also includes a study of major developments in the market such as product launches, agreements, acquisitions, collaborations, mergers and so on to comprehend the prevailing market dynamics at present and its impact during the forecast period 2018-2024.
All our reports are customizable to your company needs to a certain extent, we do provide 20 free consulting hours along with purchase of each report, and this will allow you to request any additional data to customize the report to your needs.
Key Takeaways from this Report
- Evaluate market potential through analyzing growth rates (CAGR %), Volume (Units) and Value ($M) data given at country level – for product types, end use applications and by different industry verticals.
- Understand the different dynamics influencing the market – key driving factors, challenges and hidden opportunities.
- Get in-depth insights on your competitor performance – market shares, strategies, financial benchmarking, product benchmarking, SWOT and more.
- Analyze the sales and distribution channels across key geographies to improve top-line revenues.
- Understand the industry supply chain with a deep-dive on the value augmentation at each step, in order to optimize value and bring efficiencies in your processes.
- Get a quick outlook on the market entropy – M&A’s, deals, partnerships, product launches of all key players for the past 4 years.
- Evaluate the supply-demand gaps, import-export statistics and regulatory landscape for more than top 20 countries globally for the market.
1. Green Coatings Market Overview
2. Executive Summary
3. Green Coatings Market Landscape
3.1. Market Share Analysis
3.2. Comparative Analysis
3.2.1. Product Benchmarking
3.2.2. End User profiling
3.2.3. Patent Analysis
3.2.4. Top 5 Financials Analysis
4. Green Coatings Market Forces
4.1. Market Drivers
4.2. Market Constraints
4.3. Market Challenges
4.4. Attractiveness of the Industry
4.4.1. Power of Suppliers
4.4.2. Power of Customers
4.4.3. Threat of New entrants
4.4.4. Threat of Substitution
4.4.5. Degree of Competition
5. Green Coatings Market – Strategic Analysis
5.1. Value Chain Analysis
5.2. Pricing Analysis
5.3. Opportunities Analysis
5.4. Product/Market Life Cycle Analysis
5.5. Suppliers and Distributors
6. Green Coatings Market - By Formulation
6.1. Introduction
6.2. Water-Borne
6.3. Powder
6.4. High Solids
6.5. Ultra-Violet
6.6. Solar Reflective
6.7. Chrome-Free
6.8. Bio Renewable
6.9. Others
7. Green Coatings Market - By Source
7.1. Introduction
7.2. Vegetable Oil
7.3. Soy Bean
7.4. Castor Oil
7.5. Clay
7.6. Others
8. Green Coatings Market - By Applications
8.1. Introduction
8.2. Construction
8.2.1. Curtain Wall
8.2.2. Wall And Roof Panels
8.2.3. Window, Door Frames
8.2.4. Store Fronts
8.2.5. Interior Extrusions and Panels
8.3. Consumer Goods
8.3.1. Oven Components
8.3.2. Dryer Drums
8.3.3. Rooftop HVAC Units
8.3.4. Large Air Ventilation Systems
8.3.5. Electronic Boxes
8.3.6. Furniture and Fixtures
8.3.7. Others
8.4. Automotive
8.4.1. Truck Chassis Components
8.4.2. Bus Floors
8.4.3. Automotive Engine Components
8.4.4. Other Automotive Non-Body-In-White Applications
8.4.5. Others
8.5. Oil & Gas
8.6. Mining
8.7. Aerospace
8.8. Marine
8.9. Others
9. Green Coatings Market - By Geography
9.1. Introduction
9.2. North America
9.2.1. U.S.
9.2.2. Canada
9.2.3. Mexico
9.3. South America
9.3.1. Brazil
9.3.2. Venezuela
9.3.3. Argentina
9.3.4. Ecuador
9.3.5. Peru
9.3.6. Colombia
9.3.7. Costa Rica
9.4. Europe
9.4.1. U.K
9.4.2. Germany
9.4.3. Italy
9.4.4. France
9.4.5. Netherlands
9.4.6. Belgium
9.4.7. Spain
9.4.8. Denmark
9.4.9. Rest of Europe
9.5. APAC
9.5.1. China
9.5.2. Australia
9.5.3. South Korea
9.5.4. India
9.5.5. Taiwan
9.5.6. Malaysia
9.5.7. Hong Kong
9.5.8. Rest of APAC
9.5.9. Middle East& Africa
9.5.10. Israel
9.5.11. South Africa
9.5.12. Saudi Arabia
9.6. Rest of Middle East and Africa
10. Market Entropy
10.1. New Product Launches
10.2. M&As, Collaborations, JVs, Partnership
11. Company Profiles (Overview, Financials, SWOT Analysis, Developments, Product Portfolio)
11.1. Jotun
11.2. Axalta
11.3. Valsapar
11.4. PPG Industries Inc.
11.5. Company 5
11.6. Company 6
11.7. Company 7
11.8. Company 8
11.9. Company 9
*More than 20 Companies are profiled in this Research Report*
"*Financials would be provided on a best efforts basis for private companies"
12. Appendix
12.1. Abbreviations
12.2. Sources
12.3. Research Methodology
12.4. Bibliography
12.5. Compilation of Expert Insights
12.6. Disclaimer
List of Tables:
Table 1: Green Coatings Market Overview 2023-2030
Table 2: Green Coatings Market Leader Analysis 2023-2024 (US$)
Table 3: Green Coatings Market Product Analysis 2023-2024 (US$)
Table 4: Green Coatings Market End User Analysis 2023-2024 (US$)
Table 5: Green Coatings Market Patent Analysis 2021-2023* (US$)
Table 6: Green Coatings Market Financial Analysis 2023-2024 (US$)
Table 7: Green Coatings Market Driver Analysis 2023-2024 (US$)
Table 8: Green Coatings Market Challenges Analysis 2023-2024 (US$)
Table 9: Green Coatings Market Constraint Analysis 2023-2024 (US$)
Table 10: Green Coatings Market Supplier Bargaining Power Analysis 2023-2024 (US$)
Table 11: Green Coatings Market Buyer Bargaining Power Analysis 2023-2024 (US$)
Table 12: Green Coatings Market Threat of Substitutes Analysis 2023-2024 (US$)
Table 13: Green Coatings Market Threat of New Entrants Analysis 2023-2024 (US$)
Table 14: Green Coatings Market Degree of Competition Analysis 2023-2024 (US$)
Table 15: Green Coatings Market Value Chain Analysis 2023-2024 (US$)
Table 16: Green Coatings Market Pricing Analysis 2023-2030 (US$)
Table 17: Green Coatings Market Opportunities Analysis 2023-2030 (US$)
Table 18: Green Coatings Market Product Life Cycle Analysis 2023-2030 (US$)
Table 19: Green Coatings Market Supplier Analysis 2023-2024 (US$)
Table 20: Green Coatings Market Distributor Analysis 2023-2024 (US$)
Table 21: Green Coatings Market Trend Analysis 2023-2024 (US$)
Table 22: Green Coatings Market Size 2023 (US$)
Table 23: Green Coatings Market Forecast Analysis 2023-2030 (US$)
Table 24: Green Coatings Market Sales Forecast Analysis 2023-2030 (Units)
Table 25: Green Coatings Market, Revenue & Volume, By Type of Formulation, 2023-2030 ($)
Table 26: Green Coatings Market By Type of Formulation, Revenue & Volume, By Water-Borne, 2023-2030 ($)
Table 27: Green Coatings Market By Type of Formulation, Revenue & Volume, By Powder, 2023-2030 ($)
Table 28: Green Coatings Market By Type of Formulation, Revenue & Volume, By High Solids, 2023-2030 ($)
Table 29: Green Coatings Market By Type of Formulation, Revenue & Volume, By Ultra-Violet, 2023-2030 ($)
Table 30: Green Coatings Market, Revenue & Volume, By Application, 2023-2030 ($)
Table 31: Green Coatings Market By Application, Revenue & Volume, By Architectural, 2023-2030 ($)
Table 32: Green Coatings Market By Application, Revenue & Volume, By Automotive, 2023-2030 ($)
Table 33: Green Coatings Market By Application, Revenue & Volume, By Industrial, 2023-2030 ($)
Table 34: Green Coatings Market By Application, Revenue & Volume, By Aerospace, 2023-2030 ($)
Table 35: North America Green Coatings Market, Revenue & Volume, By Type of Formulation, 2023-2030 ($)
Table 36: North America Green Coatings Market, Revenue & Volume, By Application, 2023-2030 ($)
Table 37: South america Green Coatings Market, Revenue & Volume, By Type of Formulation, 2023-2030 ($)
Table 38: South america Green Coatings Market, Revenue & Volume, By Application, 2023-2030 ($)
Table 39: Europe Green Coatings Market, Revenue & Volume, By Type of Formulation, 2023-2030 ($)
Table 40: Europe Green Coatings Market, Revenue & Volume, By Application, 2023-2030 ($)
Table 41: APAC Green Coatings Market, Revenue & Volume, By Type of Formulation, 2023-2030 ($)
Table 42: APAC Green Coatings Market, Revenue & Volume, By Application, 2023-2030 ($)
Table 43: Middle East & Africa Green Coatings Market, Revenue & Volume, By Type of Formulation, 2023-2030 ($)
Table 44: Middle East & Africa Green Coatings Market, Revenue & Volume, By Application, 2023-2030 ($)
Table 45: Russia Green Coatings Market, Revenue & Volume, By Type of Formulation, 2023-2030 ($)
Table 46: Russia Green Coatings Market, Revenue & Volume, By Application, 2023-2030 ($)
Table 47: Israel Green Coatings Market, Revenue & Volume, By Type of Formulation, 2023-2030 ($)
Table 48: Israel Green Coatings Market, Revenue & Volume, By Application, 2023-2030 ($)
Table 49: Top Companies 2023 (US$) Green Coatings Market, Revenue & Volume
Table 50: Product Launch 2023-2024 Green Coatings Market, Revenue & Volume
Table 51: Mergers & Acquistions 2023-2024 Green Coatings Market, Revenue & Volume
List of Figures:
Figure 1: Overview of Green Coatings Market 2023-2030
Figure 2: Market Share Analysis for Green Coatings Market 2023 (US$)
Figure 3: Product Comparison in Green Coatings Market 2023-2024 (US$)
Figure 4: End User Profile for Green Coatings Market 2023-2024 (US$)
Figure 5: Patent Application and Grant in Green Coatings Market 2021-2023* (US$)
Figure 6: Top 5 Companies Financial Analysis in Green Coatings Market 2023-2024 (US$)
Figure 7: Market Entry Strategy in Green Coatings Market 2023-2024
Figure 8: Ecosystem Analysis in Green Coatings Market 2023
Figure 9: Average Selling Price in Green Coatings Market 2023-2030
Figure 10: Top Opportunites in Green Coatings Market 2023-2024
Figure 11: Market Life Cycle Analysis in Green Coatings Market
Figure 12: GlobalBy Type of Formulation Green Coatings Market Revenue, 2023-2030 ($)
Figure 13: GlobalBy Application Green Coatings Market Revenue, 2023-2030 ($)
Figure 14: Global Green Coatings Market - By Geography
Figure 15: Global Green Coatings Market Value & Volume, By Geography, 2023-2030 ($)
Figure 16: Global Green Coatings Market CAGR, By Geography, 2023-2030 (%)
Figure 17: North America Green Coatings Market Value & Volume, 2023-2030 ($)
Figure 18: US Green Coatings Market Value & Volume, 2023-2030 ($)
Figure 19: US GDP and Population, 2023-2024 ($)
Figure 20: US GDP – Composition of 2023, By Sector of Origin
Figure 21: US Export and Import Value & Volume, 2023-2024 ($)
Figure 22: Canada Green Coatings Market Value & Volume, 2023-2030 ($)
Figure 23: Canada GDP and Population, 2023-2024 ($)
Figure 24: Canada GDP – Composition of 2023, By Sector of Origin
Figure 25: Canada Export and Import Value & Volume, 2023-2024 ($)
Figure 26: Mexico Green Coatings Market Value & Volume, 2023-2030 ($)
Figure 27: Mexico GDP and Population, 2023-2024 ($)
Figure 28: Mexico GDP – Composition of 2023, By Sector of Origin
Figure 29: Mexico Export and Import Value & Volume, 2023-2024 ($)
Figure 30: South America Green Coatings Market Value & Volume, 2023-2030 ($)
Figure 31: Brazil Green Coatings Market Value & Volume, 2023-2030 ($)
Figure 32: Brazil GDP and Population, 2023-2024 ($)
Figure 33: Brazil GDP – Composition of 2023, By Sector of Origin
Figure 34: Brazil Export and Import Value & Volume, 2023-2024 ($)
Figure 35: Venezuela Green Coatings Market Value & Volume, 2023-2030 ($)
Figure 36: Venezuela GDP and Population, 2023-2024 ($)
Figure 37: Venezuela GDP – Composition of 2023, By Sector of Origin
Figure 38: Venezuela Export and Import Value & Volume, 2023-2024 ($)
Figure 39: Argentina Green Coatings Market Value & Volume, 2023-2030 ($)
Figure 40: Argentina GDP and Population, 2023-2024 ($)
Figure 41: Argentina GDP – Composition of 2023, By Sector of Origin
Figure 42: Argentina Export and Import Value & Volume, 2023-2024 ($)
Figure 43: Ecuador Green Coatings Market Value & Volume, 2023-2030 ($)
Figure 44: Ecuador GDP and Population, 2023-2024 ($)
Figure 45: Ecuador GDP – Composition of 2023, By Sector of Origin
Figure 46: Ecuador Export and Import Value & Volume, 2023-2024 ($)
Figure 47: Peru Green Coatings Market Value & Volume, 2023-2030 ($)
Figure 48: Peru GDP and Population, 2023-2024 ($)
Figure 49: Peru GDP – Composition of 2023, By Sector of Origin
Figure 50: Peru Export and Import Value & Volume, 2023-2024 ($)
Figure 51: Colombia Green Coatings Market Value & Volume, 2023-2030 ($)
Figure 52: Colombia GDP and Population, 2023-2024 ($)
Figure 53: Colombia GDP – Composition of 2023, By Sector of Origin
Figure 54: Colombia Export and Import Value & Volume, 2023-2024 ($)
Figure 55: Costa Rica Green Coatings Market Value & Volume, 2023-2030 ($)
Figure 56: Costa Rica GDP and Population, 2023-2024 ($)
Figure 57: Costa Rica GDP – Composition of 2023, By Sector of Origin
Figure 58: Costa Rica Export and Import Value & Volume, 2023-2024 ($)
Figure 59: Europe Green Coatings Market Value & Volume, 2023-2030 ($)
Figure 60: U.K Green Coatings Market Value & Volume, 2023-2030 ($)
Figure 61: U.K GDP and Population, 2023-2024 ($)
Figure 62: U.K GDP – Composition of 2023, By Sector of Origin
Figure 63: U.K Export and Import Value & Volume, 2023-2024 ($)
Figure 64: Germany Green Coatings Market Value & Volume, 2023-2030 ($)
Figure 65: Germany GDP and Population, 2023-2024 ($)
Figure 66: Germany GDP – Composition of 2023, By Sector of Origin
Figure 67: Germany Export and Import Value & Volume, 2023-2024 ($)
Figure 68: Italy Green Coatings Market Value & Volume, 2023-2030 ($)
Figure 69: Italy GDP and Population, 2023-2024 ($)
Figure 70: Italy GDP – Composition of 2023, By Sector of Origin
Figure 71: Italy Export and Import Value & Volume, 2023-2024 ($)
Figure 72: France Green Coatings Market Value & Volume, 2023-2030 ($)
Figure 73: France GDP and Population, 2023-2024 ($)
Figure 74: France GDP – Composition of 2023, By Sector of Origin
Figure 75: France Export and Import Value & Volume, 2023-2024 ($)
Figure 76: Netherlands Green Coatings Market Value & Volume, 2023-2030 ($)
Figure 77: Netherlands GDP and Population, 2023-2024 ($)
Figure 78: Netherlands GDP – Composition of 2023, By Sector of Origin
Figure 79: Netherlands Export and Import Value & Volume, 2023-2024 ($)
Figure 80: Belgium Green Coatings Market Value & Volume, 2023-2030 ($)
Figure 81: Belgium GDP and Population, 2023-2024 ($)
Figure 82: Belgium GDP – Composition of 2023, By Sector of Origin
Figure 83: Belgium Export and Import Value & Volume, 2023-2024 ($)
Figure 84: Spain Green Coatings Market Value & Volume, 2023-2030 ($)
Figure 85: Spain GDP and Population, 2023-2024 ($)
Figure 86: Spain GDP – Composition of 2023, By Sector of Origin
Figure 87: Spain Export and Import Value & Volume, 2023-2024 ($)
Figure 88: Denmark Green Coatings Market Value & Volume, 2023-2030 ($)
Figure 89: Denmark GDP and Population, 2023-2024 ($)
Figure 90: Denmark GDP – Composition of 2023, By Sector of Origin
Figure 91: Denmark Export and Import Value & Volume, 2023-2024 ($)
Figure 92: APAC Green Coatings Market Value & Volume, 2023-2030 ($)
Figure 93: China Green Coatings Market Value & Volume, 2023-2030
Figure 94: China GDP and Population, 2023-2024 ($)
Figure 95: China GDP – Composition of 2023, By Sector of Origin
Figure 96: China Export and Import Value & Volume, 2023-2024 ($) Green Coatings Market China Export and Import Value & Volume, 2023-2024 ($)
Figure 97: Australia Green Coatings Market Value & Volume, 2023-2030 ($)
Figure 98: Australia GDP and Population, 2023-2024 ($)
Figure 99: Australia GDP – Composition of 2023, By Sector of Origin
Figure 100: Australia Export and Import Value & Volume, 2023-2024 ($)
Figure 101: South Korea Green Coatings Market Value & Volume, 2023-2030 ($)
Figure 102: South Korea GDP and Population, 2023-2024 ($)
Figure 103: South Korea GDP – Composition of 2023, By Sector of Origin
Figure 104: South Korea Export and Import Value & Volume, 2023-2024 ($)
Figure 105: India Green Coatings Market Value & Volume, 2023-2030 ($)
Figure 106: India GDP and Population, 2023-2024 ($)
Figure 107: India GDP – Composition of 2023, By Sector of Origin
Figure 108: India Export and Import Value & Volume, 2023-2024 ($)
Figure 109: Taiwan Green Coatings Market Value & Volume, 2023-2030 ($)
Figure 110: Taiwan GDP and Population, 2023-2024 ($)
Figure 111: Taiwan GDP – Composition of 2023, By Sector of Origin
Figure 112: Taiwan Export and Import Value & Volume, 2023-2024 ($)
Figure 113: Malaysia Green Coatings Market Value & Volume, 2023-2030 ($)
Figure 114: Malaysia GDP and Population, 2023-2024 ($)
Figure 115: Malaysia GDP – Composition of 2023, By Sector of Origin
Figure 116: Malaysia Export and Import Value & Volume, 2023-2024 ($)
Figure 117: Hong Kong Green Coatings Market Value & Volume, 2023-2030 ($)
Figure 118: Hong Kong GDP and Population, 2023-2024 ($)
Figure 119: Hong Kong GDP – Composition of 2023, By Sector of Origin
Figure 120: Hong Kong Export and Import Value & Volume, 2023-2024 ($)
Figure 121: Middle East & Africa Green Coatings Market Middle East & Africa 3D Printing Market Value & Volume, 2023-2030 ($)
Figure 122: Russia Green Coatings Market Value & Volume, 2023-2030 ($)
Figure 123: Russia GDP and Population, 2023-2024 ($)
Figure 124: Russia GDP – Composition of 2023, By Sector of Origin
Figure 125: Russia Export and Import Value & Volume, 2023-2024 ($)
Figure 126: Israel Green Coatings Market Value & Volume, 2023-2030 ($)
Figure 127: Israel GDP and Population, 2023-2024 ($)
Figure 128: Israel GDP – Composition of 2023, By Sector of Origin
Figure 129: Israel Export and Import Value & Volume, 2023-2024 ($)
Figure 130: Entropy Share, By Strategies, 2023-2024* (%) Green Coatings Market
Figure 131: Developments, 2023-2024* Green Coatings Market
Figure 132: Company 1 Green Coatings Market Net Revenue, By Years, 2023-2024* ($)
Figure 133: Company 1 Green Coatings Market Net Revenue Share, By Business segments, 2023 (%)
Figure 134: Company 1 Green Coatings Market Net Sales Share, By Geography, 2023 (%)
Figure 135: Company 2 Green Coatings Market Net Revenue, By Years, 2023-2024* ($)
Figure 136: Company 2 Green Coatings Market Net Revenue Share, By Business segments, 2023 (%)
Figure 137: Company 2 Green Coatings Market Net Sales Share, By Geography, 2023 (%)
Figure 138: Company 3 Green Coatings Market Net Revenue, By Years, 2023-2024* ($)
Figure 139: Company 3 Green Coatings Market Net Revenue Share, By Business segments, 2023 (%)
Figure 140: Company 3 Green Coatings Market Net Sales Share, By Geography, 2023 (%)
Figure 141: Company 4 Green Coatings Market Net Revenue, By Years, 2023-2024* ($)
Figure 142: Company 4 Green Coatings Market Net Revenue Share, By Business segments, 2023 (%)
Figure 143: Company 4 Green Coatings Market Net Sales Share, By Geography, 2023 (%)
Figure 144: Company 5 Green Coatings Market Net Revenue, By Years, 2023-2024* ($)
Figure 145: Company 5 Green Coatings Market Net Revenue Share, By Business segments, 2023 (%)
Figure 146: Company 5 Green Coatings Market Net Sales Share, By Geography, 2023 (%)
Figure 147: Company 6 Green Coatings Market Net Revenue, By Years, 2023-2024* ($)
Figure 148: Company 6 Green Coatings Market Net Revenue Share, By Business segments, 2023 (%)
Figure 149: Company 6 Green Coatings Market Net Sales Share, By Geography, 2023 (%)
Figure 150: Company 7 Green Coatings Market Net Revenue, By Years, 2023-2024* ($)
Figure 151: Company 7 Green Coatings Market Net Revenue Share, By Business segments, 2023 (%)
Figure 152: Company 7 Green Coatings Market Net Sales Share, By Geography, 2023 (%)
Figure 153: Company 8 Green Coatings Market Net Revenue, By Years, 2023-2024* ($)
Figure 154: Company 8 Green Coatings Market Net Revenue Share, By Business segments, 2023 (%)
Figure 155: Company 8 Green Coatings Market Net Sales Share, By Geography, 2023 (%)
Figure 156: Company 9 Green Coatings Market Net Revenue, By Years, 2023-2024* ($)
Figure 157: Company 9 Green Coatings Market Net Revenue Share, By Business segments, 2023 (%)
Figure 158: Company 9 Green Coatings Market Net Sales Share, By Geography, 2023 (%)
Figure 159: Company 10 Green Coatings Market Net Revenue, By Years, 2023-2024* ($)
Figure 160: Company 10 Green Coatings Market Net Revenue Share, By Business segments, 2023 (%)
Figure 161: Company 10 Green Coatings Market Net Sales Share, By Geography, 2023 (%)
Figure 162: Company 11 Green Coatings Market Net Revenue, By Years, 2023-2024* ($)
Figure 163: Company 11 Green Coatings Market Net Revenue Share, By Business segments, 2023 (%)
Figure 164: Company 11 Green Coatings Market Net Sales Share, By Geography, 2023 (%)
Figure 165: Company 12 Green Coatings Market Net Revenue, By Years, 2023-2024* ($)
Figure 166: Company 12 Green Coatings Market Net Revenue Share, By Business segments, 2023 (%)
Figure 167: Company 12 Green Coatings Market Net Sales Share, By Geography, 2023 (%)
Figure 168: Company 13 Green Coatings Market Net Revenue, By Years, 2023-2024* ($)
Figure 169: Company 13 Green Coatings Market Net Revenue Share, By Business segments, 2023 (%)
Figure 170: Company 13 Green Coatings Market Net Sales Share, By Geography, 2023 (%)
Figure 171: Company 14 Green Coatings Market Net Revenue, By Years, 2023-2024* ($)
Figure 172: Company 14 Green Coatings Market Net Revenue Share, By Business segments, 2023 (%)
Figure 173: Company 14 Green Coatings Market Net Sales Share, By Geography, 2023 (%)
Figure 174: Company 15 Green Coatings Market Net Revenue, By Years, 2023-2024* ($)
Figure 175: Company 15 Green Coatings Market Net Revenue Share, By Business segments, 2023 (%)
Figure 176: Company 15 Green Coatings Market Net Sales Share, By Geography, 2023 (%)