 Email
Email Print
Print


Solenoid Valves Market - Industry Analysis, Market Size, Share, Trends, Application Analysis, Growth And Forecast 2024-2030
Solenoid Valve Market Overview
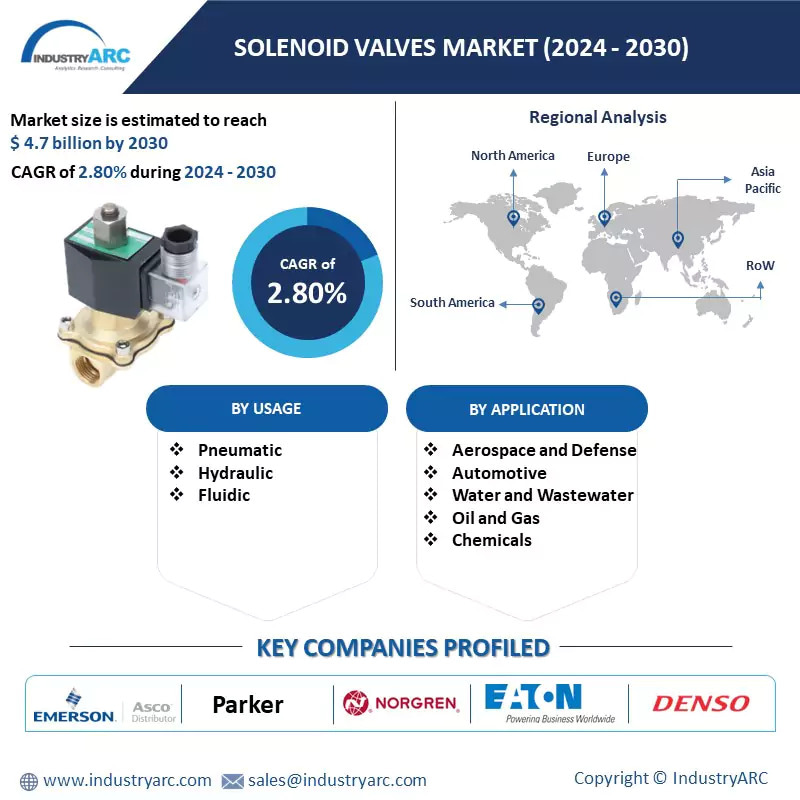
The Solenoid Valve market is estimated to surpass $4.7 billion by 2030 driven by the transportation sector growing at a CAGR of 2.8% over 2024-2030. The industry is also majorly driven by the rapid adoption of fluid automation processes in industries such as water supply, oil and gas, and agriculture. The global demand for solenoid valves has expanded steadily over the last few years. The solenoid valves are mainly driven by their Simple system, low price, and Quick action such as opening and closing within milliseconds. APAC is projected to hold the second largest market share for Solenoid Valve due to its automation control systems. The two major factors driving the adoption for solenoid valves is the water treatment and beverage industries and renewable energy-based projects. Several solenoid valve companies such as Emerson Electric Co, ABB of General Electric and others have significantly increased the automation solution for industries by offering advanced technology for solenoid valves. These valves perform multiple tasks such as releasing, turning on or off, and mixing or distributing fluids and gases.
Market Snapshot:
Report Coverage
The report: “Solenoid Valve Market Report– Forecast (2024-2030)”, by IndustryARC covers an in-depth analysis of the following segments of the Solenoid Valve market
By Usage: Pneumatic, Hydraulic, Fluidic
By Application: Aerospace & Defense, Automotive, Oil & Gas, Chemical, Water & Waste Water, Metal and Mining, Paper & Pulp, Transportation & Logistica, F&B , Power Generation, Consumer Goods, Medical & Health care, Infrastructure, Agriculture, General Manufacturing, Others
By Geography: North America (U.S, Canada, Mexico), Europe (Germany, UK, France, Italy, Spain, Russia and Others), APAC (China, Japan India, SK, Australia and Others), South America (Brazil, Argentina and others), and RoW (Middle East and Africa)
Key Takeaways
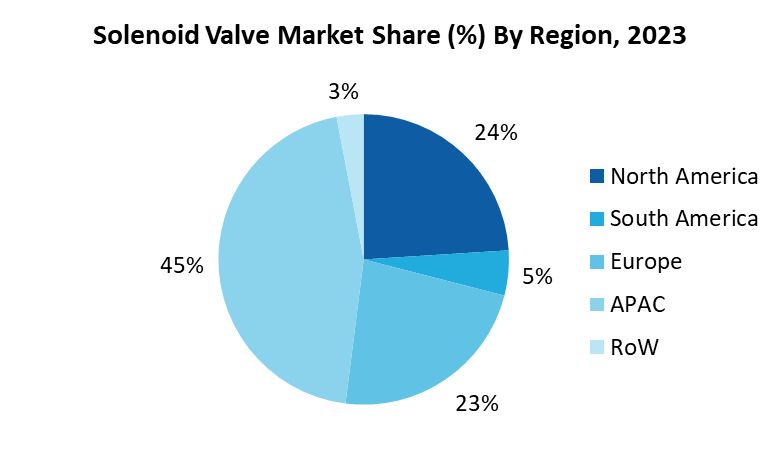
• North America dominated the global solenoid valve market over the forecast period. APAC is projected to grow at the highest CAGR over the forecasted period.
• The adoption of automation solution among many industries, especially in the water supply management, food and beverages, chemical are highly increasing. Thus this attributes to boost growth of the solenoid valves market.
• As compared to other types of operation, direct acting solenoid valves are made suitable even for negative pressure circuits with offering both open and closed versions. High deployments of direct acting solenoid valves in hazardous location applications is contributing towards a major market growth.
Solenoid Valve Market Segment Analysis - By Usage
In a hydraulic system, a hydraulic solenoid valve is a solenoid-controlled valve that opens, shuts, or adjusts the direction of liquid flow. Various chambers, also known as ports, make up the valve. The solenoid opens and shuts the ports by moving the spool inside the valve. Directional control valves, pressure control valves, and flow control valves are the different categories of hydraulic valves. The flow in the hydraulic system is directed in a specific direction by directional control valves. They have the opportunity to disrupt or restart fluid flow. Inside a hydraulic circuit, directional control valves may adjust the flow path of a fluid. When the fluid flows through the system, pressure reduction valves reduce/relieve the pressure. They make sure that the fluid pressure remains below the fixed level, avoiding potentially risky scenarios. They can be found in a variety of circuit components. In hydraulic systems, flow control valves regulate the rate at which fluids flow. This is done by using a tapered orifice to open and close. Higher or lower flow rates occur as a result of this. Flow control valves with compensating and non-compensating functions are generally deployed. Non-compensating flow control valves respond to changes in inlet and outlet pressure, while compensating flow control valves do not adjust to variations in the pressure. Hydraulic solenoid valves are widely used in industries like manufacturing, aerospace, construction and many others that require hydraulic systems.
Solenoid Valve Market Segment Analysis - By Application
Automotive sector market is estimated at $432 million in 2023 and is projected to grow at 2.1% CAGR through 2030. In automotive industries, solenoid valves are used in air intake systems, fuel injection and ignition systems, exhaust systems, HVAC body, body controls, locking and safety systems, engine control, cooling, lubrication, steering, suspension, transmission systems. In addition to these, they are also used in security systems, automatic gearbox drive selectors, air conditioning controls, and so on. For instance, the solenoid valves plays an active role in starting system of the automobiles like cars and trucks. The current is passed from the battery of the vehicle to the solenoid valve, when the user turns on the ignition switch of the automobile. This pushes the solenoid valve to close the heavy pair of contacts that enables the flow of the current to the starter motor of the vehicle. The starter motor brings about the initial motion of the piston inside the cylinder before the piston achieves self-actuating motion due to burning of the fuel inside the cylinder. Once the engine starts, the user stops the further motion of the ignition switch, due to which the flow of the current to the solenoid valve and therefore the starter motor is stopped. If the current flow to the solenoid is not sufficient then the contacts are not closed and the vehicle fails to start. Generally, this happens when the battery is low or damaged or if there is any problems in the cables. The automotive industry is growing at a healthy rate globally with demand coming primarily from the emerging countries, and the production shifting to these areas. Global automotive industry has been enjoying a period of relatively strong growth and profitability, and in few regions the annual sales have reached prerecession levels.
Solenoid Valve Market Segment Analysis - By Geography
North America dominated the global solenoid valve market over the forecast period. APAC is projected to grow at the highest CAGR of 4.1% over the forecasted period 2024-2030. The adoption of automation solution among many industries, especially in the water supply management, food and beverages, chemical is highly increasing. Thus, this attributes to boost growth of the solenoid valves market. Rising Water and Waste Water, oil and gas industries, automotive, and more in the country has been driving the solenoid valve market in this region. Several benefits offered by Solenoid valve, help industries mainly to control machines, dose, mix, or restrict the flow of liquids or gases. Moreover, in automatic systems, solenoid valves are utilized to control the flow of fluid and produce movements in the process by the industries. Increasing need for clean and hygienic water supply is growing the demand for water treatment plants in the country which in turn increasing the demand for growth of the solenoid valves market. Further growing industries and their need for automation of process such as flow of liquid or gases and others is set to propel the demand for solenoid valve in the country.
Solenoid Valve Market Drivers
Shift to Direct Acting Valves
Direct acting solenoid valves are finding huge applications in the market due to no use of diaphragm which ensures that the valves remains closed even at times of no applied pressure. Since the valves operate on simple working principles, it is used in many industrial sectors. Moreover, direct acting or direct operated valves offer a cost effective solution in demanding applications for neutral and clean liquids, gases and vapours. These solenoid valves are capable of deployment in a variety of applications ranging from shut off, filling, dosing as well as ventilation. The lightweight compact design along with being cost efficient has been helping in boosting the market growth for these valves. Since these valves offer features like high shifting forces, fast consistent response times as well as longer life, thus causing higher deployments in automotive applications. Along with a longer service life, these solenoid valves have increased switching cycles helping in further market growth. As compared to other types of operation, direct acting solenoid valves are made suitable even for negative pressure circuits with offering both open and closed versions. High deployments of direct acting solenoid valves in hazardous location applications is contributing towards a major market growth.
Rising Demand in Transportation and Logistics Sector
Logistics, Warehouse and transportation industry refers to the storage of goods, products and transportations of products to respective industries by cargos, ships, trains, trucks and other means of transportation. In warehouse industries, mostly picking, packing and placing operations have been performed. These are usually done by the robots that are meant for pick and place applications. These valves are mounted in robotic arms. In the recent years, the use of robots in warehouse applications has been increasing and it is expected that manual work in warehouse and logistics industries is replaced by robotic work in the near future. With the increase in use of robots in these industries, there is simultaneous increase in solenoid valves market as solenoid valves play a crucial role in the manufacturing of robots.
Solenoid Valve Market Challenges
Shutdown of Oil Rigs
In Oil and gas industries, solenoid valves are used in upstream, midstream, downstream activities of oil and gas industries. The upstream consists of activities such as exploration and extraction of crude oil, whereas downstream consists of activities such as filtering and purification of oil and gas. Solenoid valves are one of the key resources required in the Oil & Gas industry. They are used in wide range of applications ranging from drilling an oil well to extraction and transmission of crude oil such as in heating systems, control systems, safety systems, fractional distillation, catalytic cracking and so on. Thus, they have witnessed significant adoption. However, the potential decline of the demand for fossil fuels and oil has led to an economic downturn for the sector including the shutting down of a number of oil rigs. Although this slowdown has reduced, the demand will continue to decline over the forecast period thereby resulting in low growth in the solenoid valves market.
Solenoid Valve Market Landscape
Product launches, acquisitions, Partnerships and R&D activities are key strategies adopted by players in the Solenoid Valve market. Solenoid Valve top 10 companies include:
- Asco (Emerson)
- Parker
- IMI PLC (Norgren)
- Eaton
- Denso Corp.
- Bosch Rexroth
- Danfoss A/S
- Burkert Fluid Control Systems
- ITT Inc
- Curtiss-Wright.
For more Automation and Instrumentation Market reports, please click here
1. Solenoid Valve - Overview
1.1. Definitions and Scope
2. Solenoid Valve - Executive Summary
3. Solenoid Valve - Comparative Analysis
3.1. Company Benchmarking - Key Companies
3.2. Global Financial Analysis - Key Companies
3.3. Market Share Analysis - Key Companies
3.4. Patent Analysis
3.5. Pricing Analysis
4. Solenoid Valve - Start-up Companies Scenario
4.1. Key Start-up Company Analysis by
4.1.1. Investment
4.1.2. Revenue
4.1.3. Venture Capital and Funding Scenario
5. Solenoid Valve – Market Entry Scenario Premium
5.1. Regulatory Framework Overview
5.2. New Business and Ease of Doing Business Index
5.3. Case Studies of Successful Ventures
6. Solenoid Valve - Forces
6.1. Market Drivers
6.2. Market Constraints
6.3. Market Challenges
6.4. Porter's Five Force Model
6.4.1. Bargaining Power of Suppliers
6.4.2. Bargaining Powers of Customers
6.4.3. Threat of New Entrants
6.4.4. Rivalry Among Existing Players
6.4.5. Threat of Substitutes
7. Solenoid Valve – Strategic Analysis
7.1. Value Chain Analysis
7.2. Opportunities Analysis
7.3. Market Life Cycle
8. Solenoid Valve – by Test Type (Market Size – $Million/$Billion)
8.1. Pneumatic
8.2. Hydraulic
8.3. Fluidic
9. Solenoid Valve – By Application (Market Size – $Million/$Billion)
9.1. Aerospace & Defense
9.2. Automotive
9.3. Oil & Gas
9.4. Chemical
9.5. Water & Waste Water
9.6. Metal and Mining
9.7. Paper & Pulp
9.8. Transportation & Logistica
9.9. F&B
9.10. Power Generation
9.11. Consumer Goods
9.12. Medical & Health care
9.13. Infrastructure
9.14. Agriculture
9.15. General Manufacturing
9.16. Others
10. Solenoid Valve – by Geography (Market Size – $Million/$Billion)
10.1. North America
10.1.1. The U.S.
10.1.2. Canada
10.1.3. Mexico
10.2. Europe
10.2.1. UK
10.2.2. Germany
10.2.3. France
10.2.4. Italy
10.2.5. Spain
10.2.6. Belgium
10.2.7. Denmark
10.2.8. Rest of Europe
10.3. Asia-Pacific
10.3.1. China
10.3.2. India
10.3.3. Japan
10.3.4. South Korea
10.3.5. Australia
10.3.6. Taiwan
10.3.7. Malaysia
10.3.8. Rest of Asia-Pacific
10.4. South America
10.4.1. Brazil
10.4.2. Argentina
10.4.3. Venezuela
10.4.4. Ecuador
10.4.5. Peru
10.4.6. Colombia
10.4.7. Costa Rica
10.4.8. Rest of South America
10.5. Rest of the World
10.5.1. Middle East
10.5.2. Africa
11. Solenoid Valve – Entropy
12. Solenoid Valve – Industry/Segment Competition Landscape
12.1. Market Share Analysis
12.1.1. Market Share by Product Type – Key Companies
12.1.2. Market Share by Region – Key Companies
12.1.3. Market Share by Country – Key Companies
12.2. Competition Matrix
12.3. Best Practices for Companies
13. Solenoid Valve – Key Company List by Country Premium
14. Solenoid Valve - Company Analysis
14.1. Asco (Emerson)
14.2. Parker
14.3. IMI PLC (Norgren)
14.4. Eaton
14.5. Denso Corp.,
14.6. Bosch Rexroth
14.7. Danfoss A/S
14.8. Burkert Fluid Control Systems
14.9. ITT Inc.
14.10. Curtiss-Wright.
"Financials to the Private Companies would be provided on best-effort basis."
Connect with our experts to get customized reports that best suit your requirements. Our
reports include global-level data, niche markets and competitive landscape.
List of Tables
Table 1: Solenoid Valves Market Overview 2023-2030
Table 2: Solenoid Valves Market Leader Analysis 2023-2024 (US$)
Table 3: Solenoid Valves Market Product Analysis 2023-2024 (US$)
Table 4: Solenoid Valves Market End User Analysis 2023-2024 (US$)
Table 5: Solenoid Valves Market Patent Analysis 2021-2023* (US$)
Table 6: Solenoid Valves Market Financial Analysis 2023-2024 (US$)
Table 7: Solenoid Valves Market Driver Analysis 2023-2024 (US$)
Table 8: Solenoid Valves Market Challenges Analysis 2023-2024 (US$)
Table 9: Solenoid Valves Market Constraint Analysis 2023-2024 (US$)
Table 10: Solenoid Valves Market Supplier Bargaining Power Analysis 2023-2024 (US$)
Table 11: Solenoid Valves Market Buyer Bargaining Power Analysis 2023-2024 (US$)
Table 12: Solenoid Valves Market Threat of Substitutes Analysis 2023-2024 (US$)
Table 13: Solenoid Valves Market Threat of New Entrants Analysis 2023-2024 (US$)
Table 14: Solenoid Valves Market Degree of Competition Analysis 2023-2024 (US$)
Table 15: Solenoid Valves Market Value Chain Analysis 2023-2024 (US$)
Table 16: Solenoid Valves Market Pricing Analysis 2023-2030 (US$)
Table 17: Solenoid Valves Market Opportunities Analysis 2023-2030 (US$)
Table 18: Solenoid Valves Market Product Life Cycle Analysis 2023-2030 (US$)
Table 19: Solenoid Valves Market Supplier Analysis 2023-2024 (US$)
Table 20: Solenoid Valves Market Distributor Analysis 2023-2024 (US$)
Table 21: Solenoid Valves Market Trend Analysis 2023-2024 (US$)
Table 22: Solenoid Valves Market Size 2023 (US$)
Table 23: Solenoid Valves Market Forecast Analysis 2023-2030 (US$)
Table 24: Solenoid Valves Market Sales Forecast Analysis 2023-2030 (Units)
Table 25: Solenoid Valves Market, Revenue & Volume, By Type, 2023-2030 ($)
Table 26: Solenoid Valves Market By Type, Revenue & Volume, By Two way Valves, 2023-2030 ($)
Table 27: Solenoid Valves Market By Type, Revenue & Volume, By Three way Valves, 2023-2030 ($)
Table 28: Solenoid Valves Market By Type, Revenue & Volume, By Four way Valves, 2023-2030 ($)
Table 29: Solenoid Valves Market, Revenue & Volume, By Seal, 2023-2030 ($)
Table 30: Solenoid Valves Market By Seal, Revenue & Volume, By Nitrile Rubber (NBR), 2023-2030 ($)
Table 31: Solenoid Valves Market By Seal, Revenue & Volume, By Ethylene Propylene Diene monomer (EPDM), 2023-2030 ($)
Table 32: Solenoid Valves Market By Seal, Revenue & Volume, By Fluroelastomer, 2023-2030 ($)
Table 33: Solenoid Valves Market By Seal, Revenue & Volume, By Ruby, 2023-2030 ($)
Table 34: Solenoid Valves Market By Seal, Revenue & Volume, By PUR, 2023-2030 ($)
Table 35: Solenoid Valves Market, Revenue & Volume, By Operation, 2023-2030 ($)
Table 36: Solenoid Valves Market By Operation, Revenue & Volume, By Direct Acting Valves, 2023-2030 ($)
Table 37: Solenoid Valves Market By Operation, Revenue & Volume, By Pilot Operated valves, 2023-2030 ($)
Table 38: Solenoid Valves Market By Operation, Revenue & Volume, By Manual Reset valves, 2023-2030 ($)
Table 39: Solenoid Valves Market, Revenue & Volume, By Industry, 2023-2030 ($)
Table 40: Solenoid Valves Market By Industry, Revenue & Volume, By Aerospace and Defense, 2023-2030 ($)
Table 41: Solenoid Valves Market By Industry, Revenue & Volume, By Automobile, 2023-2030 ($)
Table 42: Solenoid Valves Market By Industry, Revenue & Volume, By Oil & Gas, 2023-2030 ($)
Table 43: Solenoid Valves Market By Industry, Revenue & Volume, By Mining, 2023-2030 ($)
Table 44: Solenoid Valves Market By Industry, Revenue & Volume, By Steel, 2023-2030 ($)
Table 45: North America Solenoid Valves Market, Revenue & Volume, By Type, 2023-2030 ($)
Table 46: North America Solenoid Valves Market, Revenue & Volume, By Seal, 2023-2030 ($)
Table 47: North America Solenoid Valves Market, Revenue & Volume, By Operation, 2023-2030 ($)
Table 48: North America Solenoid Valves Market, Revenue & Volume, By Industry, 2023-2030 ($)
Table 49: South america Solenoid Valves Market, Revenue & Volume, By Type, 2023-2030 ($)
Table 50: South america Solenoid Valves Market, Revenue & Volume, By Seal, 2023-2030 ($)
Table 51: South america Solenoid Valves Market, Revenue & Volume, By Operation, 2023-2030 ($)
Table 52: South america Solenoid Valves Market, Revenue & Volume, By Industry, 2023-2030 ($)
Table 53: Europe Solenoid Valves Market, Revenue & Volume, By Type, 2023-2030 ($)
Table 54: Europe Solenoid Valves Market, Revenue & Volume, By Seal, 2023-2030 ($)
Table 55: Europe Solenoid Valves Market, Revenue & Volume, By Operation, 2023-2030 ($)
Table 56: Europe Solenoid Valves Market, Revenue & Volume, By Industry, 2023-2030 ($)
Table 57: APAC Solenoid Valves Market, Revenue & Volume, By Type, 2023-2030 ($)
Table 58: APAC Solenoid Valves Market, Revenue & Volume, By Seal, 2023-2030 ($)
Table 59: APAC Solenoid Valves Market, Revenue & Volume, By Operation, 2023-2030 ($)
Table 60: APAC Solenoid Valves Market, Revenue & Volume, By Industry, 2023-2030 ($)
Table 61: Middle East & Africa Solenoid Valves Market, Revenue & Volume, By Type, 2023-2030 ($)
Table 62: Middle East & Africa Solenoid Valves Market, Revenue & Volume, By Seal, 2023-2030 ($)
Table 63: Middle East & Africa Solenoid Valves Market, Revenue & Volume, By Operation, 2023-2030 ($)
Table 64: Middle East & Africa Solenoid Valves Market, Revenue & Volume, By Industry, 2023-2030 ($)
Table 65: Russia Solenoid Valves Market, Revenue & Volume, By Type, 2023-2030 ($)
Table 66: Russia Solenoid Valves Market, Revenue & Volume, By Seal, 2023-2030 ($)
Table 67: Russia Solenoid Valves Market, Revenue & Volume, By Operation, 2023-2030 ($)
Table 68: Russia Solenoid Valves Market, Revenue & Volume, By Industry, 2023-2030 ($)
Table 69: Israel Solenoid Valves Market, Revenue & Volume, By Type, 2023-2030 ($)
Table 70: Israel Solenoid Valves Market, Revenue & Volume, By Seal, 2023-2030 ($)
Table 71: Israel Solenoid Valves Market, Revenue & Volume, By Operation, 2023-2030 ($)
Table 72: Israel Solenoid Valves Market, Revenue & Volume, By Industry, 2023-2030 ($)
Table 73: Top Companies 2023 (US$)Solenoid Valves Market, Revenue & Volume
Table 74: Product Launch 2023-2024Solenoid Valves Market, Revenue & Volume
Table 75: Mergers & Acquistions 2023-2024Solenoid Valves Market, Revenue & Volume
List of Figures
Figure 1: Overview of Solenoid Valves Market 2023-2030
Figure 2: Market Share Analysis for Solenoid Valves Market 2023 (US$)
Figure 3: Product Comparison in Solenoid Valves Market 2023-2024 (US$)
Figure 4: End User Profile for Solenoid Valves Market 2023-2024 (US$)
Figure 5: Patent Application and Grant in Solenoid Valves Market 2021-2023* (US$)
Figure 6: Top 5 Companies Financial Analysis in Solenoid Valves Market 2023-2024 (US$)
Figure 7: Market Entry Strategy in Solenoid Valves Market 2023-2024
Figure 8: Ecosystem Analysis in Solenoid Valves Market 2023
Figure 9: Average Selling Price in Solenoid Valves Market 2023-2030
Figure 10: Top Opportunites in Solenoid Valves Market 2023-2024
Figure 11: Market Life Cycle Analysis in Solenoid Valves Market
Figure 12: GlobalBy TypeSolenoid Valves Market Revenue, 2023-2030 ($)
Figure 13: GlobalBy SealSolenoid Valves Market Revenue, 2023-2030 ($)
Figure 14: GlobalBy OperationSolenoid Valves Market Revenue, 2023-2030 ($)
Figure 15: GlobalBy IndustrySolenoid Valves Market Revenue, 2023-2030 ($)
Figure 16: Global Solenoid Valves Market - By Geography
Figure 17: Global Solenoid Valves Market Value & Volume, By Geography, 2023-2030 ($)
Figure 18: Global Solenoid Valves Market CAGR, By Geography, 2023-2030 (%)
Figure 19: North America Solenoid Valves Market Value & Volume, 2023-2030 ($)
Figure 20: US Solenoid Valves Market Value & Volume, 2023-2030 ($)
Figure 21: US GDP and Population, 2023-2024 ($)
Figure 22: US GDP – Composition of 2023, By Sector of Origin
Figure 23: US Export and Import Value & Volume, 2023-2024 ($)
Figure 24: Canada Solenoid Valves Market Value & Volume, 2023-2030 ($)
Figure 25: Canada GDP and Population, 2023-2024 ($)
Figure 26: Canada GDP – Composition of 2023, By Sector of Origin
Figure 27: Canada Export and Import Value & Volume, 2023-2024 ($)
Figure 28: Mexico Solenoid Valves Market Value & Volume, 2023-2030 ($)
Figure 29: Mexico GDP and Population, 2023-2024 ($)
Figure 30: Mexico GDP – Composition of 2023, By Sector of Origin
Figure 31: Mexico Export and Import Value & Volume, 2023-2024 ($)
Figure 32: South America Solenoid Valves Market Value & Volume, 2023-2030 ($)
Figure 33: Brazil Solenoid Valves Market Value & Volume, 2023-2030 ($)
Figure 34: Brazil GDP and Population, 2023-2024 ($)
Figure 35: Brazil GDP – Composition of 2023, By Sector of Origin
Figure 36: Brazil Export and Import Value & Volume, 2023-2024 ($)
Figure 37: Venezuela Solenoid Valves Market Value & Volume, 2023-2030 ($)
Figure 38: Venezuela GDP and Population, 2023-2024 ($)
Figure 39: Venezuela GDP – Composition of 2023, By Sector of Origin
Figure 40: Venezuela Export and Import Value & Volume, 2023-2024 ($)
Figure 41: Argentina Solenoid Valves Market Value & Volume, 2023-2030 ($)
Figure 42: Argentina GDP and Population, 2023-2024 ($)
Figure 43: Argentina GDP – Composition of 2023, By Sector of Origin
Figure 44: Argentina Export and Import Value & Volume, 2023-2024 ($)
Figure 45: Ecuador Solenoid Valves Market Value & Volume, 2023-2030 ($)
Figure 46: Ecuador GDP and Population, 2023-2024 ($)
Figure 47: Ecuador GDP – Composition of 2023, By Sector of Origin
Figure 48: Ecuador Export and Import Value & Volume, 2023-2024 ($)
Figure 49: Peru Solenoid Valves Market Value & Volume, 2023-2030 ($)
Figure 50: Peru GDP and Population, 2023-2024 ($)
Figure 51: Peru GDP – Composition of 2023, By Sector of Origin
Figure 52: Peru Export and Import Value & Volume, 2023-2024 ($)
Figure 53: Colombia Solenoid Valves Market Value & Volume, 2023-2030 ($)
Figure 54: Colombia GDP and Population, 2023-2024 ($)
Figure 55: Colombia GDP – Composition of 2023, By Sector of Origin
Figure 56: Colombia Export and Import Value & Volume, 2023-2024 ($)
Figure 57: Costa Rica Solenoid Valves Market Value & Volume, 2023-2030 ($)
Figure 58: Costa Rica GDP and Population, 2023-2024 ($)
Figure 59: Costa Rica GDP – Composition of 2023, By Sector of Origin
Figure 60: Costa Rica Export and Import Value & Volume, 2023-2024 ($)
Figure 61: Europe Solenoid Valves Market Value & Volume, 2023-2030 ($)
Figure 62: U.K Solenoid Valves Market Value & Volume, 2023-2030 ($)
Figure 63: U.K GDP and Population, 2023-2024 ($)
Figure 64: U.K GDP – Composition of 2023, By Sector of Origin
Figure 65: U.K Export and Import Value & Volume, 2023-2024 ($)
Figure 66: Germany Solenoid Valves Market Value & Volume, 2023-2030 ($)
Figure 67: Germany GDP and Population, 2023-2024 ($)
Figure 68: Germany GDP – Composition of 2023, By Sector of Origin
Figure 69: Germany Export and Import Value & Volume, 2023-2024 ($)
Figure 70: Italy Solenoid Valves Market Value & Volume, 2023-2030 ($)
Figure 71: Italy GDP and Population, 2023-2024 ($)
Figure 72: Italy GDP – Composition of 2023, By Sector of Origin
Figure 73: Italy Export and Import Value & Volume, 2023-2024 ($)
Figure 74: France Solenoid Valves Market Value & Volume, 2023-2030 ($)
Figure 75: France GDP and Population, 2023-2024 ($)
Figure 76: France GDP – Composition of 2023, By Sector of Origin
Figure 77: France Export and Import Value & Volume, 2023-2024 ($)
Figure 78: Netherlands Solenoid Valves Market Value & Volume, 2023-2030 ($)
Figure 79: Netherlands GDP and Population, 2023-2024 ($)
Figure 80: Netherlands GDP – Composition of 2023, By Sector of Origin
Figure 81: Netherlands Export and Import Value & Volume, 2023-2024 ($)
Figure 82: Belgium Solenoid Valves Market Value & Volume, 2023-2030 ($)
Figure 83: Belgium GDP and Population, 2023-2024 ($)
Figure 84: Belgium GDP – Composition of 2023, By Sector of Origin
Figure 85: Belgium Export and Import Value & Volume, 2023-2024 ($)
Figure 86: Spain Solenoid Valves Market Value & Volume, 2023-2030 ($)
Figure 87: Spain GDP and Population, 2023-2024 ($)
Figure 88: Spain GDP – Composition of 2023, By Sector of Origin
Figure 89: Spain Export and Import Value & Volume, 2023-2024 ($)
Figure 90: Denmark Solenoid Valves Market Value & Volume, 2023-2030 ($)
Figure 91: Denmark GDP and Population, 2023-2024 ($)
Figure 92: Denmark GDP – Composition of 2023, By Sector of Origin
Figure 93: Denmark Export and Import Value & Volume, 2023-2024 ($)
Figure 94: APAC Solenoid Valves Market Value & Volume, 2023-2030 ($)
Figure 95: China Solenoid Valves Market Value & Volume, 2023-2030
Figure 96: China GDP and Population, 2023-2024 ($)
Figure 97: China GDP – Composition of 2023, By Sector of Origin
Figure 98: China Export and Import Value & Volume, 2023-2024 ($)Solenoid Valves Market China Export and Import Value & Volume, 2023-2024 ($)
Figure 99: Australia Solenoid Valves Market Value & Volume, 2023-2030 ($)
Figure 100: Australia GDP and Population, 2023-2024 ($)
Figure 101: Australia GDP – Composition of 2023, By Sector of Origin
Figure 102: Australia Export and Import Value & Volume, 2023-2024 ($)
Figure 103: South Korea Solenoid Valves Market Value & Volume, 2023-2030 ($)
Figure 104: South Korea GDP and Population, 2023-2024 ($)
Figure 105: South Korea GDP – Composition of 2023, By Sector of Origin
Figure 106: South Korea Export and Import Value & Volume, 2023-2024 ($)
Figure 107: India Solenoid Valves Market Value & Volume, 2023-2030 ($)
Figure 108: India GDP and Population, 2023-2024 ($)
Figure 109: India GDP – Composition of 2023, By Sector of Origin
Figure 110: India Export and Import Value & Volume, 2023-2024 ($)
Figure 111: Taiwan Solenoid Valves Market Value & Volume, 2023-2030 ($)
Figure 112: Taiwan GDP and Population, 2023-2024 ($)
Figure 113: Taiwan GDP – Composition of 2023, By Sector of Origin
Figure 114: Taiwan Export and Import Value & Volume, 2023-2024 ($)
Figure 115: Malaysia Solenoid Valves Market Value & Volume, 2023-2030 ($)
Figure 116: Malaysia GDP and Population, 2023-2024 ($)
Figure 117: Malaysia GDP – Composition of 2023, By Sector of Origin
Figure 118: Malaysia Export and Import Value & Volume, 2023-2024 ($)
Figure 119: Hong Kong Solenoid Valves Market Value & Volume, 2023-2030 ($)
Figure 120: Hong Kong GDP and Population, 2023-2024 ($)
Figure 121: Hong Kong GDP – Composition of 2023, By Sector of Origin
Figure 122: Hong Kong Export and Import Value & Volume, 2023-2024 ($)
Figure 123: Middle East & Africa Solenoid Valves Market Middle East & Africa 3D Printing Market Value & Volume, 2023-2030 ($)
Figure 124: Russia Solenoid Valves Market Value & Volume, 2023-2030 ($)
Figure 125: Russia GDP and Population, 2023-2024 ($)
Figure 126: Russia GDP – Composition of 2023, By Sector of Origin
Figure 127: Russia Export and Import Value & Volume, 2023-2024 ($)
Figure 128: Israel Solenoid Valves Market Value & Volume, 2023-2030 ($)
Figure 129: Israel GDP and Population, 2023-2024 ($)
Figure 130: Israel GDP – Composition of 2023, By Sector of Origin
Figure 131: Israel Export and Import Value & Volume, 2023-2024 ($)
Figure 132: Entropy Share, By Strategies, 2023-2024* (%)Solenoid Valves Market
Figure 133: Developments, 2023-2024*Solenoid Valves Market
Figure 134: Company 1 Solenoid Valves Market Net Revenue, By Years, 2023-2024* ($)
Figure 135: Company 1 Solenoid Valves Market Net Revenue Share, By Business segments, 2023 (%)
Figure 136: Company 1 Solenoid Valves Market Net Sales Share, By Geography, 2023 (%)
Figure 137: Company 2 Solenoid Valves Market Net Revenue, By Years, 2023-2024* ($)
Figure 138: Company 2 Solenoid Valves Market Net Revenue Share, By Business segments, 2023 (%)
Figure 139: Company 2 Solenoid Valves Market Net Sales Share, By Geography, 2023 (%)
Figure 140: Company 3 Solenoid Valves Market Net Revenue, By Years, 2023-2024* ($)
Figure 141: Company 3 Solenoid Valves Market Net Revenue Share, By Business segments, 2023 (%)
Figure 142: Company 3 Solenoid Valves Market Net Sales Share, By Geography, 2023 (%)
Figure 143: Company 4 Solenoid Valves Market Net Revenue, By Years, 2023-2024* ($)
Figure 144: Company 4 Solenoid Valves Market Net Revenue Share, By Business segments, 2023 (%)
Figure 145: Company 4 Solenoid Valves Market Net Sales Share, By Geography, 2023 (%)
Figure 146: Company 5 Solenoid Valves Market Net Revenue, By Years, 2023-2024* ($)
Figure 147: Company 5 Solenoid Valves Market Net Revenue Share, By Business segments, 2023 (%)
Figure 148: Company 5 Solenoid Valves Market Net Sales Share, By Geography, 2023 (%)
Figure 149: Company 6 Solenoid Valves Market Net Revenue, By Years, 2023-2024* ($)
Figure 150: Company 6 Solenoid Valves Market Net Revenue Share, By Business segments, 2023 (%)
Figure 151: Company 6 Solenoid Valves Market Net Sales Share, By Geography, 2023 (%)
Figure 152: Company 7 Solenoid Valves Market Net Revenue, By Years, 2023-2024* ($)
Figure 153: Company 7 Solenoid Valves Market Net Revenue Share, By Business segments, 2023 (%)
Figure 154: Company 7 Solenoid Valves Market Net Sales Share, By Geography, 2023 (%)
Figure 155: Company 8 Solenoid Valves Market Net Revenue, By Years, 2023-2024* ($)
Figure 156: Company 8 Solenoid Valves Market Net Revenue Share, By Business segments, 2023 (%)
Figure 157: Company 8 Solenoid Valves Market Net Sales Share, By Geography, 2023 (%)
Figure 158: Company 9 Solenoid Valves Market Net Revenue, By Years, 2023-2024* ($)
Figure 159: Company 9 Solenoid Valves Market Net Revenue Share, By Business segments, 2023 (%)
Figure 160: Company 9 Solenoid Valves Market Net Sales Share, By Geography, 2023 (%)
Figure 161: Company 10 Solenoid Valves Market Net Revenue, By Years, 2023-2024* ($)
Figure 162: Company 10 Solenoid Valves Market Net Revenue Share, By Business segments, 2023 (%)
Figure 163: Company 10 Solenoid Valves Market Net Sales Share, By Geography, 2023 (%)
Figure 164: Company 11 Solenoid Valves Market Net Revenue, By Years, 2023-2024* ($)
Figure 165: Company 11 Solenoid Valves Market Net Revenue Share, By Business segments, 2023 (%)
Figure 166: Company 11 Solenoid Valves Market Net Sales Share, By Geography, 2023 (%)
Figure 167: Company 12 Solenoid Valves Market Net Revenue, By Years, 2023-2024* ($)
Figure 168: Company 12 Solenoid Valves Market Net Revenue Share, By Business segments, 2023 (%)
Figure 169: Company 12 Solenoid Valves Market Net Sales Share, By Geography, 2023 (%)
Figure 170: Company 13 Solenoid Valves Market Net Revenue, By Years, 2023-2024* ($)
Figure 171: Company 13 Solenoid Valves Market Net Revenue Share, By Business segments, 2023 (%)
Figure 172: Company 13 Solenoid Valves Market Net Sales Share, By Geography, 2023 (%)
Figure 173: Company 14 Solenoid Valves Market Net Revenue, By Years, 2023-2024* ($)
Figure 174: Company 14 Solenoid Valves Market Net Revenue Share, By Business segments, 2023 (%)
Figure 175: Company 14 Solenoid Valves Market Net Sales Share, By Geography, 2023 (%)
Figure 176: Company 15 Solenoid Valves Market Net Revenue, By Years, 2023-2024* ($)
Figure 177: Company 15 Solenoid Valves Market Net Revenue Share, By Business segments, 2023 (%)
Figure 178: Company 15 Solenoid Valves Market Net Sales Share, By Geography, 2023 (%)