 Email
Email Print
Print


Defoamers Market Overview:
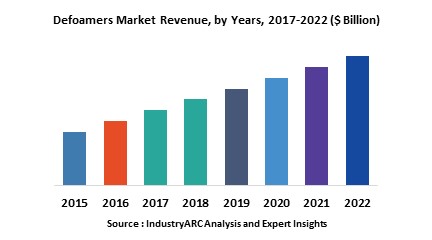
APAC is the major producer and consumer of defoamers worldwide. The most dominating country is china followed by Japan, Indonesia, Malayasia and Thailand. China is the major pulp and defoamers when we look into revenue and volume. The global defoamers market volume is forecast to grow by 3.5% between 2015 and 2020. The revenue was $2.76 billion in 2014 and is estimated to grow at a CAGR of 4.1% from 2015 to 2020
Defoamers Market Outlook:
Silicone based defoamers are generating the topmost revenue in the market and thus is dominating the market. They are mostly used in myriad applications. The application includes manufacturing of paints & coatings, construction, pharmaceutical, petroleum processing.
Defoamers Market Growth drivers:
The necessary demand from the end users is growing the defoamers market. They are used as the most important chemical in all the major end users such as paints & coatings, pulp & paper, oil & gas and others. As an example, in oil & gas drilling fluid is used when an oil well is being drilled. The fluid balance the borehole. At times drilling fluid generate foam as it reaches the surface. Foam at this stage due to drilling fluid can be difficult to pump and clean up. So defoamers are added in the fluids.
Defoamers Market Challenges:
High volatile organic compound (VOC) content is hazardous to the environment. Silicone defoamers have VOC content in them. Companies are focusing on manufacturing VOC content free products. But there are companies who is still continuing with the production of old silicone defoamer that might emit gases which is dangerous for environment as well as human health. It is a challenge for many companies to produce low VOC content defoamer products.
Defoamers MarketResearch Scope:
The base year of the study is 2017, with forecast done up to 2023. The study presents a thorough analysis of the competitive landscape, taking into account the market shares of the leading companies. It also provides information on unit shipments. These provide the key market participants with the necessary business intelligence and help them understand the future of the Defoamers Market. The assessment includes the forecast, an overview of the competitive structure, the market shares of the competitors, as well as the market trends, market demands, market drivers, market challenges, and product analysis. The market drivers and restraints have been assessed to fathom their impact over the forecast period. This report further identifies the key opportunities for growth while also detailing the key challenges and possible threats. The key areas of focus include the types of plastics in the electric vehicle market, and their specific applications in different types of vehicles.
Defoamers Market Report: Industry Coverage
By Type: Silicone Defoamer, Non-silicone Defoamer
By Application: Pulp& Paper, Paints, Ink & Coatings, Oil & gas, Industrial cleaning and detergents, Pharmaceutical, Textile Processing, Food & Beverages, Others
Defoamers Marketreport also analyzes the major geographic regions for the market as well as the major countries for the market in these regions. The regions and countries covered in the study include:
- North America: The U.S., Canada, Mexico
- South America: Brazil, Venezuela, Argentina, Ecuador, Peru, Colombia, Costa Rica
- Europe: The U.K., Germany, Italy, France, The Netherlands, Belgium, Spain, Denmark
- APAC: China, Japan, Australia, South Korea, India, Taiwan, Malaysia, Hong Kong
- Middle East and Africa: Israel, South Africa, Saudi Arabia
Defoamers Market Key Players Perspective:
Some of the Key players in this market include: Dow Chemical Company, Air products & Chemicals, Bluestar silicones, Evonik Group, KemiraW
Market Research and Market Trends of Defoamers Market
- The end user industry is the most important factor for the defoamers market. Defoamers are used in extensive applications such as oil & gas, paint & coatings, detergents and so on. The fluctuations in the end user industry will have a negative impact in these industries since it is connected with the production of end user industry.
- Kemira opened a new chemical plant in china in the year 2014 so that they can manufacture a broad range of specialty chemicals that are mostly used in paper industry. They also produces polyacrylic ester, defoamers, deinking agent and polyacrylamide emulsion that are used mostly in the manufacturing of paper.
1. Defoamers Market- Overview
1.1. Definitions and Scope
2. Defoamers Market- Executive summary
2.1. Market Revenue, Market Size and Key Trends by Company
2.2. Key Trends by type of Application
2.3. Key Trends segmented by Geography
3. Defoamers Market-Comparative analysis
3.1.1. Product Benchmarking - Top 10 companies
3.1.2. Top 5 Financials Analysis
3.1.3. Market Value split by Top 10 companies
3.1.4. Patent Analysis - Top 10 companies
3.1.5. Pricing Analysis
4. Defoamers Market– Startup companies Scenario Premium
4.1. Top 10 startup company Analysis by
4.1.1. Investment
4.1.2. Revenue
4.1.3. Market Shares
4.1.4. Market Size and Application Analysis
4.1.5. Venture Capital and Funding Scenario
5. Defoamers Market– Industry Market Entry Scenario Premium
5.1. Regulatory Framework Overview
5.2. New Business and Ease of Doing business index
5.3. Case studies of successful ventures
5.4. Customer Analysis – Top 10 companies
6. Defoamers Market- Market Forces
6.1. Drivers
6.2. Constraints
6.3. Challenges
6.4. Porters five force model
6.4.1. Bargaining power of suppliers
6.4.2. Bargaining powers of customers
6.4.3. Threat of new entrants
6.4.4. Rivalry among existing players
6.4.5. Threat of substitutes
7. Defoamers Market-Strategic analysis
7.1. Value chain analysis
7.2. Opportunities analysis
7.3. Product life cycle
8. Defoamers Market– By Type (Market Size -$Million / $Billion)
8.1. Segment type Size and Market Share Analysis
8.2. Application Revenue and Trends by Type
8.3. Application Segment Analysis by Type
8.3.1. Silicone Defoamer
8.3.1.1. Polydimethylsiloxane Base Defoamer
8.3.1.2. Modified Silicone Defoamer
8.3.2. Non-Silicone Defoamer
8.3.2.1. Pulp & Paper
8.3.2.2. Paints, Inks & Coatings
8.3.2.3. Oil & Gas
8.3.2.4. Industrial cleaning & Detergents
8.3.2.5. Pharmaceutical
8.3.2.6. Textile Processing
8.3.2.7. Food & Beverages
8.3.2.8. Others
9. Defoamers Market Market – By Application (Market Size -$Million / $Billion)
9.1. Films & Tapes
9.2. Injection Molding
9.3. Extrusion
9.4. Decking
9.5. Floor Coating
9.6. Others
10. Defoamers Market - By Geography (Market Size -$Million / $Billion)
10.1. Defoamers Market Market - North America Segment Research
10.2. North America Market Research (Million / $Billion)
10.2.1. Segment type Size and Market Size Analysis
10.2.2. Revenue and Trends
10.2.3. Application Revenue and Trends by type of Application
10.2.4. Company Revenue and Product Analysis
10.2.5. North America Product type and Application Market Size
10.2.5.1. U.S.
10.2.5.2. Canada
10.2.5.3. Mexico
10.2.5.4. Rest of North America
10.3. Defoamers Market - South America Segment Research
10.4. South America Market Research (Market Size -$Million / $Billion)
10.4.1. Segment type Size and Market Size Analysis
10.4.2. Revenue and Trends
10.4.3. Application Revenue and Trends by type of Application
10.4.4. Company Revenue and Product Analysis
10.4.5. South America Product type and Application Market Size
10.4.5.1. Brazil
10.4.5.2. Venezuela
10.4.5.3. Argentina
10.4.5.4. Ecuador
10.4.5.5. Peru
10.4.5.6. Colombia
10.4.5.7. Costa Rica
10.4.5.8. Rest of South America
10.5. Defoamers Market - Europe Segment Research
10.6. Europe Market Research (Market Size -$Million / $Billion)
10.6.1. Segment type Size and Market Size Analysis
10.6.2. Revenue and Trends
10.6.3. Application Revenue and Trends by type of Application
10.6.4. Company Revenue and Product Analysis
10.6.5. Europe Segment Product type and Application Market Size
10.6.5.1. U.K
10.6.5.2. Germany
10.6.5.3. Italy
10.6.5.4. France
10.6.5.5. Netherlands
10.6.5.6. Belgium
10.6.5.7. Spain
10.6.5.8. Denmark
10.6.5.9. Rest of Europe
10.7. Defoamers Market – APAC Segment Research
10.8. APAC Market Research (Market Size -$Million / $Billion)
10.8.1. Segment type Size and Market Size Analysis
10.8.2. Revenue and Trends
10.8.3. Application Revenue and Trends by type of Application
10.8.4. Company Revenue and Product Analysis
10.8.5. APAC Segment – Product type and Application Market Size
10.8.5.1. China
10.8.5.2. Australia
10.8.5.3. Japan
10.8.5.4. South Korea
10.8.5.5. India
10.8.5.6. Taiwan
10.8.5.7. Malaysia
11. Defoamers Market - Entropy
11.1. New product launches
11.2. M&A's, collaborations, JVs and partnerships
12. Defoamers Market – Industry / Segment Competition landscape Premium
12.1. Market Share Analysis
12.1.1. Market Share by Country- Top companies
12.1.2. Market Share by Region- Top 10 companies
12.1.3. Market Share by type of Application – Top 10 companies
12.1.4. Market Share by type of Product / Product category- Top 10 companies
12.1.5. Market Share at global level- Top 10 companies
12.1.6. Best Practices for companies
13. Defoamers Market – Key Company List by Country Premium
14. Defoamers Market Company Analysis
14.1. Market Share, Company Revenue, Products, M&A, Developments
14.2. Dow Chemical Company
14.3. Air products & Chemicals
14.4. Bluestar silicones
14.5. Evonik Group
14.6. KemiraW
14.7. Company 6
14.8. Company 7
14.9. Company 8
14.10. Company 9
14.11. Company 10 and more
"*Financials would be provided on a best efforts basis for private companies"
15. Defoamers Market -Appendix
15.1. Abbreviations
15.2. Sources
16. Defoamers Market -Methodology Premium
16.1. Research Methodology
16.1.1. Company Expert Interviews
16.1.2. Industry Databases
16.1.3. Associations
16.1.4. Company News
16.1.5. Company Annual Reports
16.1.6. Application Trends
16.1.7. New Products and Product database
16.1.8. Company Transcripts
16.1.9. R&D Trends
16.1.10. Key Opinion Leaders Interviews
16.1.11. Supply and Demand Trends
List of Tables
Table 1: Defoamers Market Overview 2023-2030
Table 2: Defoamers Market Leader Analysis 2023-2024 (US$)
Table 3: Defoamers Market Product Analysis 2023-2024 (US$)
Table 4: Defoamers Market End User Analysis 2023-2024 (US$)
Table 5: Defoamers Market Patent Analysis 2021-2023* (US$)
Table 6: Defoamers Market Financial Analysis 2023-2024 (US$)
Table 7: Defoamers Market Driver Analysis 2023-2024 (US$)
Table 8: Defoamers Market Challenges Analysis 2023-2024 (US$)
Table 9: Defoamers Market Constraint Analysis 2023-2024 (US$)
Table 10: Defoamers Market Supplier Bargaining Power Analysis 2023-2024 (US$)
Table 11: Defoamers Market Buyer Bargaining Power Analysis 2023-2024 (US$)
Table 12: Defoamers Market Threat of Substitutes Analysis 2023-2024 (US$)
Table 13: Defoamers Market Threat of New Entrants Analysis 2023-2024 (US$)
Table 14: Defoamers Market Degree of Competition Analysis 2023-2024 (US$)
Table 15: Defoamers Market Value Chain Analysis 2023-2024 (US$)
Table 16: Defoamers Market Pricing Analysis 2023-2030 (US$)
Table 17: Defoamers Market Opportunities Analysis 2023-2030 (US$)
Table 18: Defoamers Market Product Life Cycle Analysis 2023-2030 (US$)
Table 19: Defoamers Market Supplier Analysis 2023-2024 (US$)
Table 20: Defoamers Market Distributor Analysis 2023-2024 (US$)
Table 21: Defoamers Market Trend Analysis 2023-2024 (US$)
Table 22: Defoamers Market Size 2023 (US$)
Table 23: Defoamers Market Forecast Analysis 2023-2030 (US$)
Table 24: Defoamers Market Sales Forecast Analysis 2023-2030 (Units)
Table 25: Defoamers Market, Revenue & Volume, By Type, 2023-2030 ($)
Table 26: Defoamers Market By Type, Revenue & Volume, By Introduction, 2023-2030 ($)
Table 27: Defoamers Market By Type, Revenue & Volume, By Silicone Defoamers, 2023-2030 ($)
Table 28: Defoamers Market By Type, Revenue & Volume, By Non-Silicone Defoamers, 2023-2030 ($)
Table 29: Defoamers Market By Type, Revenue & Volume, By Mineral Oil Defoamers, 2023-2030 ($)
Table 30: Defoamers Market By Type, Revenue & Volume, By Powder Defoamers, 2023-2030 ($)
Table 31: Defoamers Market, Revenue & Volume, By Application, 2023-2030 ($)
Table 32: Defoamers Market By Application, Revenue & Volume, By Introduction, 2023-2030 ($)
Table 33: Defoamers Market By Application, Revenue & Volume, By Pulp and Paper, 2023-2030 ($)
Table 34: Defoamers Market By Application, Revenue & Volume, By Paints and Coatings, 2023-2030 ($)
Table 35: Defoamers Market By Application, Revenue & Volume, By Food and Beverage Industry, 2023-2030 ($)
Table 36: Defoamers Market By Application, Revenue & Volume, By Oil and Gas, 2023-2030 ($)
Table 37: North America Defoamers Market, Revenue & Volume, By Type, 2023-2030 ($)
Table 38: North America Defoamers Market, Revenue & Volume, By Application, 2023-2030 ($)
Table 39: South america Defoamers Market, Revenue & Volume, By Type, 2023-2030 ($)
Table 40: South america Defoamers Market, Revenue & Volume, By Application, 2023-2030 ($)
Table 41: Europe Defoamers Market, Revenue & Volume, By Type, 2023-2030 ($)
Table 42: Europe Defoamers Market, Revenue & Volume, By Application, 2023-2030 ($)
Table 43: APAC Defoamers Market, Revenue & Volume, By Type, 2023-2030 ($)
Table 44: APAC Defoamers Market, Revenue & Volume, By Application, 2023-2030 ($)
Table 45: Middle East & Africa Defoamers Market, Revenue & Volume, By Type, 2023-2030 ($)
Table 46: Middle East & Africa Defoamers Market, Revenue & Volume, By Application, 2023-2030 ($)
Table 47: Russia Defoamers Market, Revenue & Volume, By Type, 2023-2030 ($)
Table 48: Russia Defoamers Market, Revenue & Volume, By Application, 2023-2030 ($)
Table 49: Israel Defoamers Market, Revenue & Volume, By Type, 2023-2030 ($)
Table 50: Israel Defoamers Market, Revenue & Volume, By Application, 2023-2030 ($)
Table 51: Top Companies 2023 (US$)Defoamers Market, Revenue & Volume
Table 52: Product Launch 2023-2024Defoamers Market, Revenue & Volume
Table 53: Mergers & Acquistions 2023-2024Defoamers Market, Revenue & Volume
List of Figures
Figure 1: Overview of Defoamers Market 2023-2030
Figure 2: Market Share Analysis for Defoamers Market 2023 (US$)
Figure 3: Product Comparison in Defoamers Market 2023-2024 (US$)
Figure 4: End User Profile for Defoamers Market 2023-2024 (US$)
Figure 5: Patent Application and Grant in Defoamers Market 2021-2023* (US$)
Figure 6: Top 5 Companies Financial Analysis in Defoamers Market 2023-2024 (US$)
Figure 7: Market Entry Strategy in Defoamers Market 2023-2024
Figure 8: Ecosystem Analysis in Defoamers Market 2023
Figure 9: Average Selling Price in Defoamers Market 2023-2030
Figure 10: Top Opportunites in Defoamers Market 2023-2024
Figure 11: Market Life Cycle Analysis in Defoamers Market
Figure 12: GlobalBy TypeDefoamers Market Revenue, 2023-2030 ($)
Figure 13: GlobalBy ApplicationDefoamers Market Revenue, 2023-2030 ($)
Figure 14: Global Defoamers Market - By Geography
Figure 15: Global Defoamers Market Value & Volume, By Geography, 2023-2030 ($)
Figure 16: Global Defoamers Market CAGR, By Geography, 2023-2030 (%)
Figure 17: North America Defoamers Market Value & Volume, 2023-2030 ($)
Figure 18: US Defoamers Market Value & Volume, 2023-2030 ($)
Figure 19: US GDP and Population, 2023-2024 ($)
Figure 20: US GDP – Composition of 2023, By Sector of Origin
Figure 21: US Export and Import Value & Volume, 2023-2024 ($)
Figure 22: Canada Defoamers Market Value & Volume, 2023-2030 ($)
Figure 23: Canada GDP and Population, 2023-2024 ($)
Figure 24: Canada GDP – Composition of 2023, By Sector of Origin
Figure 25: Canada Export and Import Value & Volume, 2023-2024 ($)
Figure 26: Mexico Defoamers Market Value & Volume, 2023-2030 ($)
Figure 27: Mexico GDP and Population, 2023-2024 ($)
Figure 28: Mexico GDP – Composition of 2023, By Sector of Origin
Figure 29: Mexico Export and Import Value & Volume, 2023-2024 ($)
Figure 30: South America Defoamers Market Value & Volume, 2023-2030 ($)
Figure 31: Brazil Defoamers Market Value & Volume, 2023-2030 ($)
Figure 32: Brazil GDP and Population, 2023-2024 ($)
Figure 33: Brazil GDP – Composition of 2023, By Sector of Origin
Figure 34: Brazil Export and Import Value & Volume, 2023-2024 ($)
Figure 35: Venezuela Defoamers Market Value & Volume, 2023-2030 ($)
Figure 36: Venezuela GDP and Population, 2023-2024 ($)
Figure 37: Venezuela GDP – Composition of 2023, By Sector of Origin
Figure 38: Venezuela Export and Import Value & Volume, 2023-2024 ($)
Figure 39: Argentina Defoamers Market Value & Volume, 2023-2030 ($)
Figure 40: Argentina GDP and Population, 2023-2024 ($)
Figure 41: Argentina GDP – Composition of 2023, By Sector of Origin
Figure 42: Argentina Export and Import Value & Volume, 2023-2024 ($)
Figure 43: Ecuador Defoamers Market Value & Volume, 2023-2030 ($)
Figure 44: Ecuador GDP and Population, 2023-2024 ($)
Figure 45: Ecuador GDP – Composition of 2023, By Sector of Origin
Figure 46: Ecuador Export and Import Value & Volume, 2023-2024 ($)
Figure 47: Peru Defoamers Market Value & Volume, 2023-2030 ($)
Figure 48: Peru GDP and Population, 2023-2024 ($)
Figure 49: Peru GDP – Composition of 2023, By Sector of Origin
Figure 50: Peru Export and Import Value & Volume, 2023-2024 ($)
Figure 51: Colombia Defoamers Market Value & Volume, 2023-2030 ($)
Figure 52: Colombia GDP and Population, 2023-2024 ($)
Figure 53: Colombia GDP – Composition of 2023, By Sector of Origin
Figure 54: Colombia Export and Import Value & Volume, 2023-2024 ($)
Figure 55: Costa Rica Defoamers Market Value & Volume, 2023-2030 ($)
Figure 56: Costa Rica GDP and Population, 2023-2024 ($)
Figure 57: Costa Rica GDP – Composition of 2023, By Sector of Origin
Figure 58: Costa Rica Export and Import Value & Volume, 2023-2024 ($)
Figure 59: Europe Defoamers Market Value & Volume, 2023-2030 ($)
Figure 60: U.K Defoamers Market Value & Volume, 2023-2030 ($)
Figure 61: U.K GDP and Population, 2023-2024 ($)
Figure 62: U.K GDP – Composition of 2023, By Sector of Origin
Figure 63: U.K Export and Import Value & Volume, 2023-2024 ($)
Figure 64: Germany Defoamers Market Value & Volume, 2023-2030 ($)
Figure 65: Germany GDP and Population, 2023-2024 ($)
Figure 66: Germany GDP – Composition of 2023, By Sector of Origin
Figure 67: Germany Export and Import Value & Volume, 2023-2024 ($)
Figure 68: Italy Defoamers Market Value & Volume, 2023-2030 ($)
Figure 69: Italy GDP and Population, 2023-2024 ($)
Figure 70: Italy GDP – Composition of 2023, By Sector of Origin
Figure 71: Italy Export and Import Value & Volume, 2023-2024 ($)
Figure 72: France Defoamers Market Value & Volume, 2023-2030 ($)
Figure 73: France GDP and Population, 2023-2024 ($)
Figure 74: France GDP – Composition of 2023, By Sector of Origin
Figure 75: France Export and Import Value & Volume, 2023-2024 ($)
Figure 76: Netherlands Defoamers Market Value & Volume, 2023-2030 ($)
Figure 77: Netherlands GDP and Population, 2023-2024 ($)
Figure 78: Netherlands GDP – Composition of 2023, By Sector of Origin
Figure 79: Netherlands Export and Import Value & Volume, 2023-2024 ($)
Figure 80: Belgium Defoamers Market Value & Volume, 2023-2030 ($)
Figure 81: Belgium GDP and Population, 2023-2024 ($)
Figure 82: Belgium GDP – Composition of 2023, By Sector of Origin
Figure 83: Belgium Export and Import Value & Volume, 2023-2024 ($)
Figure 84: Spain Defoamers Market Value & Volume, 2023-2030 ($)
Figure 85: Spain GDP and Population, 2023-2024 ($)
Figure 86: Spain GDP – Composition of 2023, By Sector of Origin
Figure 87: Spain Export and Import Value & Volume, 2023-2024 ($)
Figure 88: Denmark Defoamers Market Value & Volume, 2023-2030 ($)
Figure 89: Denmark GDP and Population, 2023-2024 ($)
Figure 90: Denmark GDP – Composition of 2023, By Sector of Origin
Figure 91: Denmark Export and Import Value & Volume, 2023-2024 ($)
Figure 92: APAC Defoamers Market Value & Volume, 2023-2030 ($)
Figure 93: China Defoamers Market Value & Volume, 2023-2030
Figure 94: China GDP and Population, 2023-2024 ($)
Figure 95: China GDP – Composition of 2023, By Sector of Origin
Figure 96: China Export and Import Value & Volume, 2023-2024 ($)Defoamers Market China Export and Import Value & Volume, 2023-2024 ($)
Figure 97: Australia Defoamers Market Value & Volume, 2023-2030 ($)
Figure 98: Australia GDP and Population, 2023-2024 ($)
Figure 99: Australia GDP – Composition of 2023, By Sector of Origin
Figure 100: Australia Export and Import Value & Volume, 2023-2024 ($)
Figure 101: South Korea Defoamers Market Value & Volume, 2023-2030 ($)
Figure 102: South Korea GDP and Population, 2023-2024 ($)
Figure 103: South Korea GDP – Composition of 2023, By Sector of Origin
Figure 104: South Korea Export and Import Value & Volume, 2023-2024 ($)
Figure 105: India Defoamers Market Value & Volume, 2023-2030 ($)
Figure 106: India GDP and Population, 2023-2024 ($)
Figure 107: India GDP – Composition of 2023, By Sector of Origin
Figure 108: India Export and Import Value & Volume, 2023-2024 ($)
Figure 109: Taiwan Defoamers Market Value & Volume, 2023-2030 ($)
Figure 110: Taiwan GDP and Population, 2023-2024 ($)
Figure 111: Taiwan GDP – Composition of 2023, By Sector of Origin
Figure 112: Taiwan Export and Import Value & Volume, 2023-2024 ($)
Figure 113: Malaysia Defoamers Market Value & Volume, 2023-2030 ($)
Figure 114: Malaysia GDP and Population, 2023-2024 ($)
Figure 115: Malaysia GDP – Composition of 2023, By Sector of Origin
Figure 116: Malaysia Export and Import Value & Volume, 2023-2024 ($)
Figure 117: Hong Kong Defoamers Market Value & Volume, 2023-2030 ($)
Figure 118: Hong Kong GDP and Population, 2023-2024 ($)
Figure 119: Hong Kong GDP – Composition of 2023, By Sector of Origin
Figure 120: Hong Kong Export and Import Value & Volume, 2023-2024 ($)
Figure 121: Middle East & Africa Defoamers Market Middle East & Africa 3D Printing Market Value & Volume, 2023-2030 ($)
Figure 122: Russia Defoamers Market Value & Volume, 2023-2030 ($)
Figure 123: Russia GDP and Population, 2023-2024 ($)
Figure 124: Russia GDP – Composition of 2023, By Sector of Origin
Figure 125: Russia Export and Import Value & Volume, 2023-2024 ($)
Figure 126: Israel Defoamers Market Value & Volume, 2023-2030 ($)
Figure 127: Israel GDP and Population, 2023-2024 ($)
Figure 128: Israel GDP – Composition of 2023, By Sector of Origin
Figure 129: Israel Export and Import Value & Volume, 2023-2024 ($)
Figure 130: Entropy Share, By Strategies, 2023-2024* (%)Defoamers Market
Figure 131: Developments, 2023-2024*Defoamers Market
Figure 132: Company 1 Defoamers Market Net Revenue, By Years, 2023-2024* ($)
Figure 133: Company 1 Defoamers Market Net Revenue Share, By Business segments, 2023 (%)
Figure 134: Company 1 Defoamers Market Net Sales Share, By Geography, 2023 (%)
Figure 135: Company 2 Defoamers Market Net Revenue, By Years, 2023-2024* ($)
Figure 136: Company 2 Defoamers Market Net Revenue Share, By Business segments, 2023 (%)
Figure 137: Company 2 Defoamers Market Net Sales Share, By Geography, 2023 (%)
Figure 138: Company 3 Defoamers Market Net Revenue, By Years, 2023-2024* ($)
Figure 139: Company 3 Defoamers Market Net Revenue Share, By Business segments, 2023 (%)
Figure 140: Company 3 Defoamers Market Net Sales Share, By Geography, 2023 (%)
Figure 141: Company 4 Defoamers Market Net Revenue, By Years, 2023-2024* ($)
Figure 142: Company 4 Defoamers Market Net Revenue Share, By Business segments, 2023 (%)
Figure 143: Company 4 Defoamers Market Net Sales Share, By Geography, 2023 (%)
Figure 144: Company 5 Defoamers Market Net Revenue, By Years, 2023-2024* ($)
Figure 145: Company 5 Defoamers Market Net Revenue Share, By Business segments, 2023 (%)
Figure 146: Company 5 Defoamers Market Net Sales Share, By Geography, 2023 (%)
Figure 147: Company 6 Defoamers Market Net Revenue, By Years, 2023-2024* ($)
Figure 148: Company 6 Defoamers Market Net Revenue Share, By Business segments, 2023 (%)
Figure 149: Company 6 Defoamers Market Net Sales Share, By Geography, 2023 (%)
Figure 150: Company 7 Defoamers Market Net Revenue, By Years, 2023-2024* ($)
Figure 151: Company 7 Defoamers Market Net Revenue Share, By Business segments, 2023 (%)
Figure 152: Company 7 Defoamers Market Net Sales Share, By Geography, 2023 (%)
Figure 153: Company 8 Defoamers Market Net Revenue, By Years, 2023-2024* ($)
Figure 154: Company 8 Defoamers Market Net Revenue Share, By Business segments, 2023 (%)
Figure 155: Company 8 Defoamers Market Net Sales Share, By Geography, 2023 (%)
Figure 156: Company 9 Defoamers Market Net Revenue, By Years, 2023-2024* ($)
Figure 157: Company 9 Defoamers Market Net Revenue Share, By Business segments, 2023 (%)
Figure 158: Company 9 Defoamers Market Net Sales Share, By Geography, 2023 (%)
Figure 159: Company 10 Defoamers Market Net Revenue, By Years, 2023-2024* ($)
Figure 160: Company 10 Defoamers Market Net Revenue Share, By Business segments, 2023 (%)
Figure 161: Company 10 Defoamers Market Net Sales Share, By Geography, 2023 (%)
Figure 162: Company 11 Defoamers Market Net Revenue, By Years, 2023-2024* ($)
Figure 163: Company 11 Defoamers Market Net Revenue Share, By Business segments, 2023 (%)
Figure 164: Company 11 Defoamers Market Net Sales Share, By Geography, 2023 (%)
Figure 165: Company 12 Defoamers Market Net Revenue, By Years, 2023-2024* ($)
Figure 166: Company 12 Defoamers Market Net Revenue Share, By Business segments, 2023 (%)
Figure 167: Company 12 Defoamers Market Net Sales Share, By Geography, 2023 (%)
Figure 168: Company 13 Defoamers Market Net Revenue, By Years, 2023-2024* ($)
Figure 169: Company 13 Defoamers Market Net Revenue Share, By Business segments, 2023 (%)
Figure 170: Company 13 Defoamers Market Net Sales Share, By Geography, 2023 (%)
Figure 171: Company 14 Defoamers Market Net Revenue, By Years, 2023-2024* ($)
Figure 172: Company 14 Defoamers Market Net Revenue Share, By Business segments, 2023 (%)
Figure 173: Company 14 Defoamers Market Net Sales Share, By Geography, 2023 (%)
Figure 174: Company 15 Defoamers Market Net Revenue, By Years, 2023-2024* ($)
Figure 175: Company 15 Defoamers Market Net Revenue Share, By Business segments, 2023 (%)
Figure 176: Company 15 Defoamers Market Net Sales Share, By Geography, 2023 (%)