 Email
Email Print
Print


Polymers Market- By Type (Natural Polymers, Synthetic Polymers & Semi-synthetic Polymers), By Product , By Process , By Application , By End-use Industry , By Geograph - Global Opportunity Analysis & Industry Forecast, 2024-2030
Polymers Market Overview
Global Polymers Market size is forecast to reach around $1,233.6 billion by 2030, after growing at a CAGR of 5.1% during 2024-2030. Polymer is one of the widely used chemical products in almost all the sectors such a medical, aerospace, packaging, automotive, construction, electrical appliances, and medical sector, and consequently, the global polymers market is thriving. Polymers are used widely as a substitute of metal and mineral based products due to its high performance, cost-effectiveness, and low weight. Increase in the retail sector and prospering e-commerce industry is demanding for more packaging material that is influencing the significance of the polymers market. Whereas, the growing interest in renewable feedstock and biopolymers among the consumers have led to the development of several alternatives to traditional plastics that in turn drives the demand for Polymer during the forecast period. Furthermore, growing demand for polymer in the electronic industry for the manufacturing of different electrical parts such as switches and sockets are driving the Polymers Market.
Sustainable and biodegradable polymers are witnessing increased demand due to a rising focus on eco-friendly materials. This trend aligns with environmental concerns, driving industries to seek polymers that minimize ecological impact. The emphasis on these materials reflects a global commitment to reducing environmental harm, fostering a market shift toward sustainable solutions and biodegradability, meeting consumer preferences for responsible and environmentally conscious products.
Continuous advancements in polymer processing, particularly in 3D printing and additive manufacturing, are reshaping production methodologies. These innovations facilitate tailored product designs and cost-efficient manufacturing, heralding a shift in traditional production paradigms. Leveraging cutting-edge technologies like 3D printing and additive manufacturing optimizes customization possibilities and operational efficiencies in manufacturing processes, presenting a competitive edge in delivering adaptable and economical solutions for businesses.
Report Coverage
The report: “Polymers Market – Forecast (2024-2030)”, by Industry ARC, covers an in-depth analysis of the following segments of
the Global Polymers Market.
By Type: Polypropylene, Polyethylene (HDPE, LDPE, LLDPE, and Others), Polyvinyl Chloride, Polystyrene (Expanded Polystyrene (EPS) and Extruded Polystyrene (XPS)), Polyurethane (Flexible Polyurethane Foam, Rigid Polyurethane Foam, Thermoplastic polyurethane (TPU), and Others), and Others.
By Process: Injection Molding, Extrusion, and Others.
By End-Use Industry: Packaging (Rigid and Flexible), Building and Construction (Roofing, Windows, Flooring, and Others), Automotive (Engine, Tires, Body Panel, and Others), Electrical and Electronics, Agriculture, Medical/Healthcare, and Others.
By Geography: North America, South America, Europe, APAC, and RoW.
Key Takeaways
- In the Latin America region, in 2023, Brazil is the major market for the Polymer owing to a rise in the purchasing power of consumers, growing consumer packaged goods market, and rise in corn, wheat, and sugarcane production and consumption across the country owing to the Bio-based plastic and polymers are gaining prominent growth.
- The polymers are observed to be the better substitutes than glass, and metals that is leveraging the polymers market. The increasing demand for specialty polymers are fueling the growth of the polymers market.
- Progression in 3D printing is improving the growth aspects of polymers and plastic manufacturing. The changing preference of consumers from metal 3D printing to plastic material 3D printing is leading to substantial growth in the polymers market.
- Fluctuation in international oil prices tend to force companies to search for an alternative stable source of the raw material for packaging, which further provides lucrative opportunities for the growth of Polymer industry.
- Evolution of the natural and environment-friendly polymers in the packaging sector for food packaging, cosmetics packaging and pharmaceutical packaging is driving the growth.
- Comparatively lower awareness about the biodegradable polymer in emerging nations like India, Thailand, South Africa and Qatar are hampering the market growth.
Polymers Market Segment Analysis - By Type
The Polyethylene segment is projected to witness the highest CAGR of 7.1% during the forecast period owing to the rising demand from various end-use industry. Whereas, growing uses of high-density polyethylene (HDPE) and Low-density polyethylene (LDPE) in food and beverage packaging like milk and fruit juices, crates, caps for food packaging, drums, and other liquid food packaging and industrial packaging applications drive the market growth. Construction industry is a major consumer of polyethylene which is used in the form of sheets, plates, films, foils, and strips that offer plastic protection to floors. Furthermore, polyethylene is also used in pipes and fittings which form an integral part of various industrial activities. Besides, consumer goods such as bowls, buckets, water bottles, drums, dustbins and plumbing pipes, are a few polyethylene products utilized on a daily basis. Increased sales of consumer goods offer opportunities to vendors in the polyethylene market, which in turn drive the growth of this market.
Polymers Market Segment Analysis - By Process
The injection molding segment is projected to witness the highest CAGR of 6.8% during the forecast period owing to its optical clarity and biocompatibility characteristics. In the injection molding process, large polymer moldings can be inexpensively manufactured in large quantities for direct usage. Furthermore, the growing complexity of technical biodegradable polymer/bioplastic moldings drives the demand for a multi-component injection molding process, which in turn propels the growth of this segment. Whereas, the growing demand for plastic components across numerous end-use industries like automotive, packaging, home appliances, electrical and electronics, and healthcare devices is expected to drive the market growth. Besides, various industries are shifting their focus towards injection-molded products in order to enhance their operations and produce products with better quality as per the customer’s requirements. For instance, the automotive industry is replacing steel with plastics to reduce a vehicle’s weight and improve fuel efficiency.
Polymers Market Segment Analysis - By End-Use Industry
The medical/healthcare segment is projected to witness the exponential growth in the global Polymers Market during the forecast period and a negative demand impact is expected to continue into 2023. This growth is attributed to the outbreak of COVID-19 and the exponential demand for Ventilators, masks, and personal protective equipment (PPE) globally. Whereas, the properties of polymers like versatility, sterile nature, safety for patients and providers, cost effectiveness, and ease of use makes the use of polymers for various medicals application such as disposable medical devices, including flexible fluid bags, tubing, oxygen, masks, surgical gloves, and face shields. Whereas, due to COVID-19 outbreak, at presently, plastics have revolutionized the medical industry and represent the largest group of materials used in medical technology.
Polymers Market Segment Analysis - By Geography
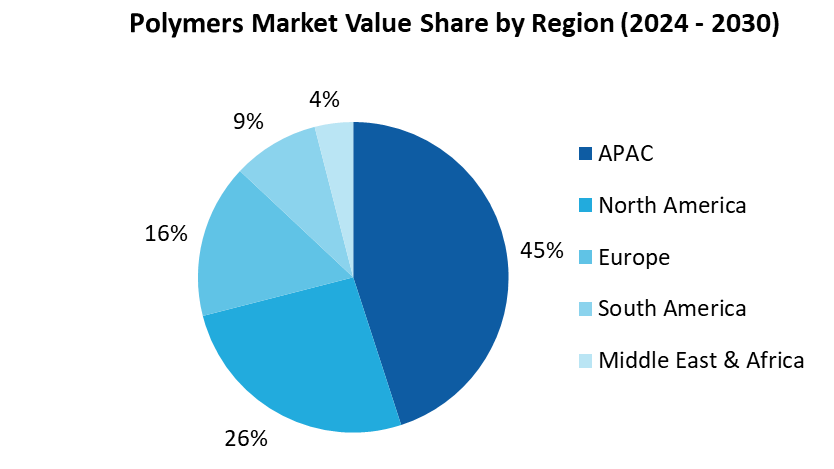
Among the regions, the APAC region hold the largest share of more than 45% in 2023 and is projected to witness the highest CAGR of around 7.9% in the global Polymers Market followed by North America and Europe during the forecast period. The growing economies of South East Asian countries, growing disposable income, easy availability of raw materials used to manufacture plastics, and rise in population propels the growth of this market in the APAC region. Furthermore, the growing demand for eco-friendly alternatives for traditional plastics from emerging nations like China and India and increased consumption of petrochemicals and plastics primarily used for packaging in F&B industries further drives the growth of this market across the country during the forecast period.
For more details on this report - Request for Sample
Polymers Market Drivers
Rising demand of Polymer across various end-use industries
Polymer has many useful properties which make it suitable for various end-use industry applications. It has low strength and hardness, but is very ductile and has good impact strength; it will stretch rather than break. Polymer based products has a good electric insulator, offering electric treeing resistance but can become electrostatically charged. Hence, owing to these properties the demand for Polymer is gaining momentum in various industries such as automotive, electrical and electronics, food and beverage, and consumer goods. The growing demand further projects the Polymers Market in good light and ensures its prospects in the coming years. In the automotive industry, manufactures are focusing on increasing the efficiency of vehicles by reducing the weight of the vehicles. Polymer material is preferred as it is light in weight, offers easy process ability, sealing and stiffness properties. In the food and beverage industry, consumption for Polymer is growing at a rapid pace due to the rising demand from production of packaging materials for food and beverage. The manufactures prefer effective packaging to reduce the possibility of food contamination and loss of quality. The use of Polymer in fashion, sports, and toys is growing due to its ability to resist physical stresses, durability, provide flexibility in packaging, and allow easy molding of products. In the agriculture industry, the application of Polymer is growing owing to increasing demand for drippers, micro tubes, nozzles, and emitting pipes at irrigation fields. Therefore, an increase in the application of Polymer automotive, electrical and electronics, food and beverage, and consumer goods industries is propelling the Polymers Market share.
Increasing demand for bio-based polymers
Bio-based plastics are made in whole or partially from renewable biological resources. For example, sugar cane is processed to produce ethylene, which can then be used to manufacture polyethylene. Starch can be processed to produce lactic acid and subsequently polylactic acid (PLA). Bio-based polymer is perfect to reduce the number of carbon emissions they create in the world, lower their overall energy consumption and protect the environment. So, many companies are now looking towards this fantastic plastic-alternative because it ends up being a win-win for both the consumer and for packaging companies. Additionally, it’s crucial to understand that bio-based plastics like bio-based polyethylene contains renewable carbon elements. This is one of the main reasons many manufacturers are making the switch to bio-based and not fossil-fuel based plastics. At the end of a bio-based plastic’s life cycle, it will return to the atmosphere, but will not add any elements of new carbon to the environment.
Polymers Market Challenges
Harmful effects of plastics on the environment
Plastics are lightweight, durable, and corrosion-resistant with high thermal and electrical insulation properties that can be used across various residential, commercial, and industrial applications. Furthermore, plastic products are inexpensive as compared to other metal products. Hence, form the last two decades the use of traditional plastic is growing worldwide. However, plastic is non-decomposable due to the presence of various harmful chemical ingredients in the plastic that limiting its use across various end-use applications. In addition, the presence of harmful chemicals has their negative impact on the environment, living organisms, and human health. Presently, the use of micro plastic becomes a bigger threat to plants and animals including humans who are based on land. According to the Plastic Soup Foundation The amount of plastic that is produced in the world every year has increased explosively in just a human lifetime. From 2 million tons in 1950 to over 470 million tons in 2022. The expectation is that the production will have quadrupled to about 1480 million tons by 2050. Thus, the growing environmental concern is resulting in more stringent regulations, which is hinder market growth.
Emergence of COVID-19 the Pandemic
The emergence of COVID-19, which is declared a pandemic by the World Health Organization, is having a noticeable impact on global economic growth. According to International Monetary Fund, the global GDP is expected to decline by 0.3% in 2020. According to World Trade Organization (WTO), global trade volumes are projected to decline between 13% and 32% in 2020 as a result of the economic impact of COVID-19. The pandemic is affecting operations of various industries such as automotive, oil and gas, construction, aerospace, and others, as most of countries have issued “stay at home guidance”. Moreover, it is expected that the outbreak of COVID-19 will be seen in the whole year of 2020, and a few months in 2021. As, polymer products are extensively used in these industries, the declining operations of these industries is directly affecting Polymers Market growth.
Market Landscape
Technology launches, acquisitions, and R&D activities are key strategies adopted by players in the Polymers Market report. In 2019, the market of Polymer top 10 companies accounting for xx% of the share. Major players in the Polymers Market industry the outlook is The Dow Chemical Company, LyondellBasell Industries N.V., Exxon Mobil Corporation, SABIC, BASF SE, INEOS AG, Eni S.p.A., Chevron Phillips Chemical Company LLC, and LANXESS, among others.
Acquisitions/Technology Launches
- In April 2023, Formerra has successfully finalized the acquisition of Total Polymer Solutions, strengthening its portfolio in precision engineering and tooling within the plastic injection molding industry. This strategic merger enhances Formerra's capabilities, expanding its offerings in high-precision plastic components and molds.
- In October 2022, Aurora Plastics, LLC, a leading manufacturer of polymer compounds, has merged with Enviroplas Inc. The merger propelled Aurora Plastics to launch an engineered polymers business segment, reinforcing customer-centricity.
- In May 2022, Ascend Performance Materials has completed its purchase of Formulated Polymers Limited. The acquisition establishes Ascend’s first production facility in South Asia.
For more Chemicals and Materials Market reports, please click here
1.1 Definitions and Scope
2. Polymers Market- Executive Summary
2.1 Market Revenue, Market Size and Key Trends by Company
2.2 Key Trends by Type
2.3 Key Trends by Process
2.4 Key Trends by End-Use Industry
2.5 Key Trends by Geography
3. Polymers Market- Landscape
3.1 Comparative analysis
3.1.1 Market Share Analysis- Top Companies
3.1.2 Product Benchmarking- Top Companies
3.1.3 Top 5 Financials Analysis
3.1.4 Patent Analysis- Top Companies
3.1.5 Pricing Analysis
4. Polymers Market- Startup companies Scenario Premium
4.1 Top startup company Analysis by
4.1.1 Investment
4.1.2 Revenue
4.1.3 Market Shares
4.1.4 Market Size and Application Analysis
4.1.5 Venture Capital and Funding Scenario
5. Polymers Market– Industry Market Entry Scenario Premium
5.1 Regulatory Framework Overview
5.2 New Business and Ease of Doing business index
5.3 Case studies of successful ventures
5.4 Customer Analysis - Top companies
6. Polymers Market- Market Forces
6.1 Market Drivers
6.2 Market Constraints
6.3 Market Opportunities
6.4 Porters Five Force Model
6.4.1 Bargaining power of suppliers
6.4.2 Bargaining powers of buyers
6.4.3 Threat of new entrants
6.4.4 Rivalry among existing players
6.4.5 Threat of substitutes
7. Polymers Market-Strategic analysis
7.1 Value chain analysis
7.2 Opportunities analysis
7.3 Market life cycle
7.4 Suppliers and distributors Analysis
8. Polymers Market– By Type (Market Size -$Million)
8.1 Polypropylene
8.2 Polyethylene
8.2.1 HDPE
8.2.2 LDPE
8.2.3 LLDPE
8.2.4 Others
8.3 Polyvinyl Chloride
8.4 Polystyrene
8.4.1 Expanded Polystyrene (EPS)
8.4.2 Extruded Polystyrene (XPS)
8.5 Polyurethane
8.5.1 Flexible Polyurethane Foam
8.5.2 Rigid Polyurethane Foam
8.5.3 Thermoplastic polyurethane (TPU)
8.5.4 Others
8.6 Others
9. Polymers Market– By Process (Market Size -$Million)
9.1 Injection Molding
9.2 Extrusion
9.3 Others
10. Polymers Market– By End-Use Industry (Market Size -$Million)
10.1 Packaging
10.1.1 Rigid
10.1.2 Flexible
10.2 Building and Construction
10.2.1 Roofing
10.2.2 Windows
10.2.3 Flooring
10.2.4 Others
10.3 Automotive
10.3.1 Engine
10.3.2 Tires
10.3.3 Body Panel
10.3.4 Others
10.4 Electrical and Electronics
10.5 Agriculture
10.6 Healthcare/Medical
10.7 Others
11. Polymers Market- By Geography (Market Size -$Million)
11.1 North America
11.1.1 U.S.
11.1.2 Canada
11.1.3 Mexico
11.2 South America
11.2.1 Brazil
11.2.2 Argentina
11.2.3 Chile
11.2.4 Colombia
11.2.5 Rest of South America
11.3 Europe
11.3.1 U.K
11.3.2 Germany
11.3.3 Italy
11.3.4 France
11.3.5 Spain
11.3.6 Netherlands
11.3.7 Russia
11.3.8 Rest of Europe
11.4 Asia-Pacific
11.4.1 China
11.4.2 India
11.4.3 Japan
11.4.4 Australia & New Zealand (ANZ)
11.4.5 South Korea
11.4.6 Indonesia
11.4.7 Malaysia
11.4.6 Rest of Asia-Pacific
11.5 Middle East & Africa
11.5.1 Middle East
11.5.2 Africa
12. Polymers Market- Entropy
12.1 New Product Launches
12.2 M&A’s, Collaborations, JVs and Partnerships
13. Market Share Analysis
13.1 Market Share by Country- Top companies
13.2 Market Share by Region- Top companies
13.3 Market Share by type of Product / Product category- Top companies
13.4 Market Share at global level- Top companies
13.5 Best Practices for companies
14. Polymers Market- List of Key Companies by Country
15. Polymers Market- Company Analysis
15.1 Market Share, Company Revenue, Products, M&A, Developments
15.2 The Dow Chemical Company
15.3 LyondellBasell Industries N.V.
15.4 Exxon Mobil Corporation
15.5 SABIC
15.6 BASF SE
15.7 INEOS AG
15.8 Eni S.p.A.
15.9 Chevron Phillips Chemical Company LLC
15.10 LANXESS
15.11 Huntsman Corporation
"*Financials would be provided on a best efforts basis for private companies
List of Tables
Table 1 Polymers Market In India Overview 2023-2030
Table 2 Polymers Market In India Leader Analysis 2023-2024 (US$)
Table 3 Polymers Market In IndiaProduct Analysis 2023-2024 (US$)
Table 4 Polymers Market In IndiaEnd User Analysis 2023-2024 (US$)
Table 5 Polymers Market In IndiaPatent Analysis 2021-2023* (US$)
Table 6 Polymers Market In IndiaFinancial Analysis 2023-2024 (US$)
Table 7 Polymers Market In India Driver Analysis 2023-2024 (US$)
Table 8 Polymers Market In IndiaChallenges Analysis 2023-2024 (US$)
Table 9 Polymers Market In IndiaConstraint Analysis 2023-2024 (US$)
Table 10 Polymers Market In India Supplier Bargaining Power Analysis 2023-2024 (US$)
Table 11 Polymers Market In India Buyer Bargaining Power Analysis 2023-2024 (US$)
Table 12 Polymers Market In India Threat of Substitutes Analysis 2023-2024 (US$)
Table 13 Polymers Market In India Threat of New Entrants Analysis 2023-2024 (US$)
Table 14 Polymers Market In India Degree of Competition Analysis 2023-2024 (US$)
Table 15 Polymers Market In IndiaValue Chain Analysis 2023-2024 (US$)
Table 16 Polymers Market In IndiaPricing Analysis 2023-2030 (US$)
Table 17 Polymers Market In IndiaOpportunities Analysis 2023-2030 (US$)
Table 18 Polymers Market In IndiaProduct Life Cycle Analysis 2023-2030 (US$)
Table 19 Polymers Market In IndiaSupplier Analysis 2023-2024 (US$)
Table 20 Polymers Market In IndiaDistributor Analysis 2023-2024 (US$)
Table 21 Polymers Market In India Trend Analysis 2023-2024 (US$)
Table 22 Polymers Market In India Size 2023 (US$)
Table 23 Polymers Market In India Forecast Analysis 2023-2030 (US$)
Table 24 Polymers Market In India Sales Forecast Analysis 2023-2030 (Units)
Table 25 Polymers Market In India, Revenue & Volume,By Type, 2023-2030 ($)
Table 26 Polymers Market In IndiaBy Type, Revenue & Volume,By Polyethylene, 2023-2030 ($)
Table 27 Polymers Market In IndiaBy Type, Revenue & Volume,By Polypropylene, 2023-2030 ($)
Table 28 Polymers Market In IndiaBy Type, Revenue & Volume,By Polyvinyl Chloride, 2023-2030 ($)
Table 29 Polymers Market In IndiaBy Type, Revenue & Volume,By Polystyrene, 2023-2030 ($)
Table 30 Polymers Market In IndiaBy Type, Revenue & Volume,By Abs Resin, 2023-2030 ($)
Table 31 Polymers Market In India, Revenue & Volume,By Application, 2023-2030 ($)
Table 32 Polymers Market In IndiaBy Application, Revenue & Volume,By Packaging, 2023-2030 ($)
Table 33 Polymers Market In IndiaBy Application, Revenue & Volume,By Building & Construction, 2023-2030 ($)
Table 34 Polymers Market In IndiaBy Application, Revenue & Volume,By Automotive, 2023-2030 ($)
Table 35 Polymers Market In IndiaBy Application, Revenue & Volume,By Consumer Products, 2023-2030 ($)
Table 36 North America Polymers Market In India, Revenue & Volume,By Type, 2023-2030 ($)
Table 37 North America Polymers Market In India, Revenue & Volume,By Application, 2023-2030 ($)
Table 38 South america Polymers Market In India, Revenue & Volume,By Type, 2023-2030 ($)
Table 39 South america Polymers Market In India, Revenue & Volume,By Application, 2023-2030 ($)
Table 40 Europe Polymers Market In India, Revenue & Volume,By Type, 2023-2030 ($)
Table 41 Europe Polymers Market In India, Revenue & Volume,By Application, 2023-2030 ($)
Table 42 APAC Polymers Market In India, Revenue & Volume,By Type, 2023-2030 ($)
Table 43 APAC Polymers Market In India, Revenue & Volume,By Application, 2023-2030 ($)
Table 44 Middle East & Africa Polymers Market In India, Revenue & Volume,By Type, 2023-2030 ($)
Table 45 Middle East & Africa Polymers Market In India, Revenue & Volume,By Application, 2023-2030 ($)
Table 46 Russia Polymers Market In India, Revenue & Volume,By Type, 2023-2030 ($)
Table 47 Russia Polymers Market In India, Revenue & Volume,By Application, 2023-2030 ($)
Table 48 Israel Polymers Market In India, Revenue & Volume,By Type, 2023-2030 ($)
Table 49 Israel Polymers Market In India, Revenue & Volume,By Application, 2023-2030 ($)
Table 50 Top Companies 2023 (US$)Polymers Market In India, Revenue & Volume,,
Table 51 Product Launch 2023-2024Polymers Market In India, Revenue & Volume,,
Table 52 Mergers & Acquistions 2023-2024Polymers Market In India, Revenue & Volume,,
List of Figures
Figure 1 Overview of Polymers Market In India 2023-2030
Figure 2 Market Share Analysis for Polymers Market In India 2023 (US$)
Figure 3 Product Comparison in Polymers Market In India 2023-2024 (US$)
Figure 4 End User Profile for Polymers Market In India 2023-2024 (US$)
Figure 5 Patent Application and Grant in Polymers Market In India 2021-2023* (US$)
Figure 6 Top 5 Companies Financial Analysis in Polymers Market In India 2023-2024 (US$)
Figure 7 Market Entry Strategy in Polymers Market In India 2023-2024
Figure 8 Ecosystem Analysis in Polymers Market In India2023
Figure 9 Average Selling Price in Polymers Market In India 2023-2030
Figure 10 Top Opportunites in Polymers Market In India 2023-2024
Figure 11 Market Life Cycle Analysis in Polymers Market In India
Figure 12 GlobalBy TypePolymers Market In India Revenue, 2023-2030 ($)
Figure 13 GlobalBy ApplicationPolymers Market In India Revenue, 2023-2030 ($)
Figure 14 Global Polymers Market In India - By Geography
Figure 15 Global Polymers Market In India Value & Volume, By Geography, 2023-2030 ($)
Figure 16 Global Polymers Market In India CAGR, By Geography, 2023-2030 (%)
Figure 17 North America Polymers Market In India Value & Volume, 2023-2030 ($)
Figure 18 US Polymers Market In India Value & Volume, 2023-2030 ($)
Figure 19 US GDP and Population, 2023-2024 ($)
Figure 20 US GDP – Composition of 2023, By Sector of Origin
Figure 21 US Export and Import Value & Volume, 2023-2024 ($)
Figure 22 Canada Polymers Market In India Value & Volume, 2023-2030 ($)
Figure 23 Canada GDP and Population, 2023-2024 ($)
Figure 24 Canada GDP – Composition of 2023, By Sector of Origin
Figure 25 Canada Export and Import Value & Volume, 2023-2024 ($)
Figure 26 Mexico Polymers Market In India Value & Volume, 2023-2030 ($)
Figure 27 Mexico GDP and Population, 2023-2024 ($)
Figure 28 Mexico GDP – Composition of 2023, By Sector of Origin
Figure 29 Mexico Export and Import Value & Volume, 2023-2024 ($)
Figure 30 South America Polymers Market In IndiaSouth America 3D Printing Market Value & Volume, 2023-2030 ($)
Figure 31 Brazil Polymers Market In India Value & Volume, 2023-2030 ($)
Figure 32 Brazil GDP and Population, 2023-2024 ($)
Figure 33 Brazil GDP – Composition of 2023, By Sector of Origin
Figure 34 Brazil Export and Import Value & Volume, 2023-2024 ($)
Figure 35 Venezuela Polymers Market In India Value & Volume, 2023-2030 ($)
Figure 36 Venezuela GDP and Population, 2023-2024 ($)
Figure 37 Venezuela GDP – Composition of 2023, By Sector of Origin
Figure 38 Venezuela Export and Import Value & Volume, 2023-2024 ($)
Figure 39 Argentina Polymers Market In India Value & Volume, 2023-2030 ($)
Figure 40 Argentina GDP and Population, 2023-2024 ($)
Figure 41 Argentina GDP – Composition of 2023, By Sector of Origin
Figure 42 Argentina Export and Import Value & Volume, 2023-2024 ($)
Figure 43 Ecuador Polymers Market In India Value & Volume, 2023-2030 ($)
Figure 44 Ecuador GDP and Population, 2023-2024 ($)
Figure 45 Ecuador GDP – Composition of 2023, By Sector of Origin
Figure 46 Ecuador Export and Import Value & Volume, 2023-2024 ($)
Figure 47 Peru Polymers Market In India Value & Volume, 2023-2030 ($)
Figure 48 Peru GDP and Population, 2023-2024 ($)
Figure 49 Peru GDP – Composition of 2023, By Sector of Origin
Figure 50 Peru Export and Import Value & Volume, 2023-2024 ($)
Figure 51 Colombia Polymers Market In India Value & Volume, 2023-2030 ($)
Figure 52 Colombia GDP and Population, 2023-2024 ($)
Figure 53 Colombia GDP – Composition of 2023, By Sector of Origin
Figure 54 Colombia Export and Import Value & Volume, 2023-2024 ($)
Figure 55 Costa Rica Polymers Market In IndiaCosta Rica 3D Printing Market Value & Volume, 2023-2030 ($)
Figure 56 Costa Rica GDP and Population, 2023-2024 ($)
Figure 57 Costa Rica GDP – Composition of 2023, By Sector of Origin
Figure 58 Costa Rica Export and Import Value & Volume, 2023-2024 ($)
Figure 59 Europe Polymers Market In India Value & Volume, 2023-2030 ($)
Figure 60 U.K Polymers Market In India Value & Volume, 2023-2030 ($)
Figure 61 U.K GDP and Population, 2023-2024 ($)
Figure 62 U.K GDP – Composition of 2023, By Sector of Origin
Figure 63 U.K Export and Import Value & Volume, 2023-2024 ($)
Figure 64 Germany Polymers Market In India Value & Volume, 2023-2030 ($)
Figure 65 Germany GDP and Population, 2023-2024 ($)
Figure 66 Germany GDP – Composition of 2023, By Sector of Origin
Figure 67 Germany Export and Import Value & Volume, 2023-2024 ($)
Figure 68 Italy Polymers Market In India Value & Volume, 2023-2030 ($)
Figure 69 Italy GDP and Population, 2023-2024 ($)
Figure 70 Italy GDP – Composition of 2023, By Sector of Origin
Figure 71 Italy Export and Import Value & Volume, 2023-2024 ($)
Figure 72 France Polymers Market In India Value & Volume, 2023-2030 ($)
Figure 73 France GDP and Population, 2023-2024 ($)
Figure 74 France GDP – Composition of 2023, By Sector of Origin
Figure 75 France Export and Import Value & Volume, 2023-2024 ($)
Figure 76 Netherlands Polymers Market In India Value & Volume, 2023-2030 ($)
Figure 77 Netherlands GDP and Population, 2023-2024 ($)
Figure 78 Netherlands GDP – Composition of 2023, By Sector of Origin
Figure 79 Netherlands Export and Import Value & Volume, 2023-2024 ($)
Figure 80 Belgium Polymers Market In India Value & Volume, 2023-2030 ($)
Figure 81 Belgium GDP and Population, 2023-2024 ($)
Figure 82 Belgium GDP – Composition of 2023, By Sector of Origin
Figure 83 Belgium Export and Import Value & Volume, 2023-2024 ($)
Figure 84 Spain Polymers Market In India Value & Volume, 2023-2030 ($)
Figure 85 Spain GDP and Population, 2023-2024 ($)
Figure 86 Spain GDP – Composition of 2023, By Sector of Origin
Figure 87 Spain Export and Import Value & Volume, 2023-2024 ($)
Figure 88 Denmark Polymers Market In India Value & Volume, 2023-2030 ($)
Figure 89 Denmark GDP and Population, 2023-2024 ($)
Figure 90 Denmark GDP – Composition of 2023, By Sector of Origin
Figure 91 Denmark Export and Import Value & Volume, 2023-2024 ($)
Figure 92 APAC Polymers Market In India Value & Volume, 2023-2030 ($)
Figure 93 China Polymers Market In IndiaValue & Volume, 2023-2030
Figure 94 China GDP and Population, 2023-2024 ($)
Figure 95 China GDP – Composition of 2023, By Sector of Origin
Figure 96 China Export and Import Value & Volume, 2023-2024 ($)Polymers Market In IndiaChina Export and Import Value & Volume, 2023-2024 ($)
Figure 97 Australia Polymers Market In India Value & Volume, 2023-2030 ($)
Figure 98 Australia GDP and Population, 2023-2024 ($)
Figure 99 Australia GDP – Composition of 2023, By Sector of Origin
Figure 100 Australia Export and Import Value & Volume, 2023-2024 ($)
Figure 101 South Korea Polymers Market In India Value & Volume, 2023-2030 ($)
Figure 102 South Korea GDP and Population, 2023-2024 ($)
Figure 103 South Korea GDP – Composition of 2023, By Sector of Origin
Figure 104 South Korea Export and Import Value & Volume, 2023-2024 ($)
Figure 105 India Polymers Market In India Value & Volume, 2023-2030 ($)
Figure 106 India GDP and Population, 2023-2024 ($)
Figure 107 India GDP – Composition of 2023, By Sector of Origin
Figure 108 India Export and Import Value & Volume, 2023-2024 ($)
Figure 109 Taiwan Polymers Market In IndiaTaiwan 3D Printing Market Value & Volume, 2023-2030 ($)
Figure 110 Taiwan GDP and Population, 2023-2024 ($)
Figure 111 Taiwan GDP – Composition of 2023, By Sector of Origin
Figure 112 Taiwan Export and Import Value & Volume, 2023-2024 ($)
Figure 113 Malaysia Polymers Market In IndiaMalaysia 3D Printing Market Value & Volume, 2023-2030 ($)
Figure 114 Malaysia GDP and Population, 2023-2024 ($)
Figure 115 Malaysia GDP – Composition of 2023, By Sector of Origin
Figure 116 Malaysia Export and Import Value & Volume, 2023-2024 ($)
Figure 117 Hong Kong Polymers Market In IndiaHong Kong 3D Printing Market Value & Volume, 2023-2030 ($)
Figure 118 Hong Kong GDP and Population, 2023-2024 ($)
Figure 119 Hong Kong GDP – Composition of 2023, By Sector of Origin
Figure 120 Hong Kong Export and Import Value & Volume, 2023-2024 ($)
Figure 121 Middle East & Africa Polymers Market In IndiaMiddle East & Africa 3D Printing Market Value & Volume, 2023-2030 ($)
Figure 122 Russia Polymers Market In IndiaRussia 3D Printing Market Value & Volume, 2023-2030 ($)
Figure 123 Russia GDP and Population, 2023-2024 ($)
Figure 124 Russia GDP – Composition of 2023, By Sector of Origin
Figure 125 Russia Export and Import Value & Volume, 2023-2024 ($)
Figure 126 Israel Polymers Market In India Value & Volume, 2023-2030 ($)
Figure 127 Israel GDP and Population, 2023-2024 ($)
Figure 128 Israel GDP – Composition of 2023, By Sector of Origin
Figure 129 Israel Export and Import Value & Volume, 2023-2024 ($)
Figure 130 Entropy Share, By Strategies, 2023-2024* (%)Polymers Market In India
Figure 131 Developments, 2023-2024*Polymers Market In India
Figure 132 Company 1 Polymers Market In India Net Revenue, By Years, 2023-2024* ($)
Figure 133 Company 1 Polymers Market In India Net Revenue Share, By Business segments, 2023 (%)
Figure 134 Company 1 Polymers Market In India Net Sales Share, By Geography, 2023 (%)
Figure 135 Company 2 Polymers Market In India Net Revenue, By Years, 2023-2024* ($)
Figure 136 Company 2 Polymers Market In India Net Revenue Share, By Business segments, 2023 (%)
Figure 137 Company 2 Polymers Market In India Net Sales Share, By Geography, 2023 (%)
Figure 138 Company 3Polymers Market In India Net Revenue, By Years, 2023-2024* ($)
Figure 139 Company 3Polymers Market In India Net Revenue Share, By Business segments, 2023 (%)
Figure 140 Company 3Polymers Market In India Net Sales Share, By Geography, 2023 (%)
Figure 141 Company 4 Polymers Market In India Net Revenue, By Years, 2023-2024* ($)
Figure 142 Company 4 Polymers Market In India Net Revenue Share, By Business segments, 2023 (%)
Figure 143 Company 4 Polymers Market In India Net Sales Share, By Geography, 2023 (%)
Figure 144 Company 5 Polymers Market In India Net Revenue, By Years, 2023-2024* ($)
Figure 145 Company 5 Polymers Market In India Net Revenue Share, By Business segments, 2023 (%)
Figure 146 Company 5 Polymers Market In India Net Sales Share, By Geography, 2023 (%)
Figure 147 Company 6 Polymers Market In India Net Revenue, By Years, 2023-2024* ($)
Figure 148 Company 6 Polymers Market In India Net Revenue Share, By Business segments, 2023 (%)
Figure 149 Company 6 Polymers Market In India Net Sales Share, By Geography, 2023 (%)
Figure 150 Company 7 Polymers Market In India Net Revenue, By Years, 2023-2024* ($)
Figure 151 Company 7 Polymers Market In India Net Revenue Share, By Business segments, 2023 (%)
Figure 152 Company 7 Polymers Market In India Net Sales Share, By Geography, 2023 (%)
Figure 153 Company 8 Polymers Market In India Net Revenue, By Years, 2023-2024* ($)
Figure 154 Company 8 Polymers Market In India Net Revenue Share, By Business segments, 2023 (%)
Figure 155 Company 8 Polymers Market In India Net Sales Share, By Geography, 2023 (%)
Figure 156 Company 9 Polymers Market In India Net Revenue, By Years, 2023-2024* ($)
Figure 157 Company 9 Polymers Market In India Net Revenue Share, By Business segments, 2023 (%)
Figure 158 Company 9 Polymers Market In India Net Sales Share, By Geography, 2023 (%)
Figure 159 Company 10 Polymers Market In India Net Revenue, By Years, 2023-2024* ($)
Figure 160 Company 10 Polymers Market In India Net Revenue Share, By Business segments, 2023 (%)
Figure 161 Company 10 Polymers Market In India Net Sales Share, By Geography, 2023 (%)
Figure 162 Company 11 Polymers Market In India Net Revenue, By Years, 2023-2024* ($)
Figure 163 Company 11 Polymers Market In India Net Revenue Share, By Business segments, 2023 (%)
Figure 164 Company 11 Polymers Market In India Net Sales Share, By Geography, 2023 (%)
Figure 165 Company 12 Polymers Market In India Net Revenue, By Years, 2023-2024* ($)
Figure 166 Company 12 Polymers Market In India Net Revenue Share, By Business segments, 2023 (%)
Figure 167 Company 12 Polymers Market In India Net Sales Share, By Geography, 2023 (%)
Figure 168 Company 13Polymers Market In India Net Revenue, By Years, 2023-2024* ($)
Figure 169 Company 13Polymers Market In India Net Revenue Share, By Business segments, 2023 (%)
Figure 170 Company 13Polymers Market In India Net Sales Share, By Geography, 2023 (%)
Figure 171 Company 14 Polymers Market In India Net Revenue, By Years, 2023-2024* ($)
Figure 172 Company 14 Polymers Market In India Net Revenue Share, By Business segments, 2023 (%)
Figure 173 Company 14 Polymers Market In India Net Sales Share, By Geography, 2023 (%)
Figure 174 Company 15 Polymers Market In India Net Revenue, By Years, 2023-2024* ($)
Figure 175 Company 15 Polymers Market In India Net Revenue Share, By Business segments, 2023 (%)
Figure 176 Company 15 Polymers Market In India Net Sales Share, By Geography, 2023 (%)