 Email
Email Print
Print


The global Biocontrol Agents market is estimated to surpass $3.71 billion by 2023 growing at an estimated CAGR of more than 9.86% during 2018 to 2023 majorly driven by the growing awareness of biocontrol agents among consumers. In addition to this, increasing concentration in food contamination due to variety of chemicals is fueling the market growth
What are Biocontrol Agents?
Biocontrol agents are the natural organisms like parasitism, predation and other mechanisms for controlling the plant pests. They play a key role in controlling the plant pests such as nematodes, weeds, mites. These biocontrol agents helps in maintaining and balancing the plant species like nematodes weeds, insects and mites. Biocontrol agents have no side effects as they are eco- friendly in nature.
Due to the lucrative aspects, Biocontrol agents are replacing the pesticides and other chemicals. Factors such as ease of use and its availability are driving the biocontrol agents market. Biocontrol agents are effective throughout the season and are considered economical as compered to other chemicals such as pesticides and insecticides, thus the growth of biocontrol agents will certainly expand in the coming future. Increasing investments by key market players in biological solutions especially in R&D capabilities is creating opportunities for the biocontrol agents market. However, lack of awareness and knowledge among growers regarding biocontrol agents are hindering the growth of market. This report incorporates an in-depth assessment of biocontrol agents market by active substance, application, environment, crop type, target pest and geography. The major types of biocontrol agents encompassed in the scope includes various active substances such as microbials and macrobials.
What are the major applications for Biocontrol Agents?
The various applications include on-field, seed treatment, post-harvest. Among these applications of biocontrol agents, on-field application is growing at a faster rate. On-field sprays protect the field’s crop, vegetables and food products that are cultivated from various pests and insects that may damage the production. On-field spraying is considered safe to use and thus most of the farmers are using this technique for better production.
Market Research and Market Trends of Biocontrol Agents Ecosystem
- Increasing concentration on food contamination owing to variety of chemicals is fueling the market growth of biocontrol agents
- Rising demand of biocontrol agents compared to pesticides owing to their cost effectiveness are boosting the growth and development of the biocontrol agents market. Biocontrol agents are capable of replacing chemical agents that are used by decreasing emissions in the environment and thus resulting in lesser soil and water pollution hence the demand for biocontrol agents is rising day-by-day
- Acceptance regarding biological control agents in the agricultural system, increasing use of biocontrol agents for pest control in horticulture and high value crop fields spurs the biocontrol agent market for these products
- On-field (Spray) are estimated to dominate the biocontrol agents market with a share of around 58%, thus generating excess revenue of $1.22 billion in 2017. The market is forecast to witness a growth of nearly 10.39% projecting to around $3.71billion by2023 , which is mainly attributed to the growing demand from the applications such as seed treatment, post-harvest and so on
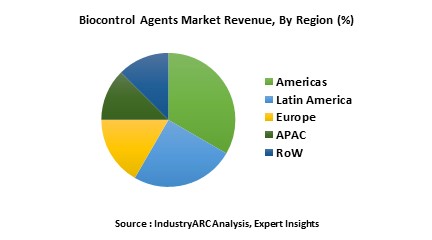
- North America region has dominated the biocontrol agents market in 2017 and is estimated to grow with a CAGR of 10% during the forecast period 2018-2023
- Vegetables & fruits are the major crop types which are holding a share of 46% of biocontrol agents market in 2017. As per IndustryARC recent analysis, the biocontrol agents market is forecast to surpass $3.71billion by 2023 majorly driven by microbials
Who are the Major Players in Biocontrol Agents market?
The companies referred to in the market research report includes Bayer CropScience AG, BASF SE (Germany), Syngenta AG (Switzerland), Novozymes A/S (Denmark) and Koppert Biological systems (the Netherlands)
What is our report scope?
The report incorporates in-depth assessment of the competitive landscape, product market sizing, product benchmarking, market trends, product developments, financial analysis, strategic analysis and so on to gauge the impact forces and potential opportunities of the market. Apart from this the report also includes a study of major developments in the market such as product launches, agreements, acquisitions, collaborations, mergers and so on to comprehend the prevailing market dynamics at present and its impact during the forecast period2018-2023.
All our reports are customizable to your company needs to a certain extent, we do provide 20 free consulting hours along with purchase of each report, this will allow you to request any additional data to customize the report to your needs.
Key Takeaways from this Report
- Evaluate market potential through analyzing growth rates (CAGR %), Volume (Units) and Value ($M) data given at country level – for active substamce, applications and by different crops.
- Understand the different dynamics influencing the market – key driving factors, challenges and hidden opportunities.
- Get in-depth insights on your competitor performance – market shares, strategies, financial benchmarking, product benchmarking, SWOT and more.
- Analyze the sales and distribution channels across key geographies to improve top-line revenues.
- Understand the industry supply chain with a deep-dive on the value augmentation at each step, in order to optimize value and bring efficiencies in your processes.
- Get a quick outlook on the market entropy – M&As, deals, partnerships, product launches of all key players for the past 4 years.
- Evaluate the supply-demand gaps, import-export statistics and regulatory landscape for more than top 20 countries globally for the market.
For more Agriculture
related reports, please click
here
1. Biocontrol Agents Market Overview
2. Executive Summary
3. Biocontrol Agents Market Landscape
3.1. Market Share Analysis
3.2. Comparative Analysis
3.2.1. Product Benchmarking
3.2.2. End User profiling
3.2.3. Patent Analysis
3.2.4. Top 5 Financials Analysis
4. Biocontrol Agents Market Forces
4.1. Market Drivers
4.2. Market Constraints
4.3. Market Challenges
4.4. Attractiveness of the Industry
4.4.1. Power of Suppliers
4.4.2. Power of Customers
4.4.3. Threat of New entrants
4.4.4. Threat of Substitution
4.4.5. Degree of Competition
5. Biocontrol Agents Market – Strategic Analysis
5.1. Value Chain Analysis
5.2. Pricing Analysis
5.3. Opportunities Analysis
5.4. Product/Market Life Cycle Analysis
5.5. Suppliers and Distributors
6. Global BioControl Agents - Market By Active Substance
6.1. Introduction
6.2. Microbials
6.2.1. Bacteria
6.2.2. Viruses
6.2.3. Fungi
6.2.4. Entomopathogenic Nematodes
6.2.5. Others
6.3. Macrobials
6.3.1. Parasitoids
6.3.2. Predators
6.3.3. Weed Killers
7. Global BioControl Agents - Market By Application
7.1. Introduction
7.2. Seed Treatment
7.3. On-Field
7.4. Post-Harvest
8. Global BioControl Agents - Market By Environment
8.1. Introduction
8.2. Horticulture
8.3. Out Field Crops
9. Global BioControl Agents - Market By Target Pest
9.1. Introduction
9.2. Arthropods
9.3. Weeds
9.4. Micro-Organisms
10. Global BioControl Agents - Market By Crop Type
10.1. Introduction
10.2. Cereals & Grains
10.3. Vegetables & Fruits
10.4. Pulses & Oils
10.5. Others
11. Global BioControl Agents Market Geographic Analysis
11.1. Introduction
11.2. North America
11.2.1. U.S.
11.2.2. Canada
11.2.3. Mexico
11.3. Latin America
11.3.1. Brazil
11.3.2. Argentina
11.3.3. Chile
11.3.4. Colombia
11.3.5. Others
11.4. Europe
11.4.1. Spain
11.4.2. France
11.4.3. Italy
11.4.4. Germany
11.4.5. The Netherlands
11.4.6. Rest of Europe
11.5. APAC
11.5.1. China
11.5.2. India
11.5.3. Japan
11.5.4. Australia & New Zealand
11.5.5. Others
11.6. Rest of the World
11.6.1. Middle East
11.6.2. Africa
12. Market Entropy
12.1. New Product Launches
12.2. M&As, Collaborations, JVs and Partnerships
13. Company Profiles
13.1. Bayer CropScience AG
13.2. BASF SE (Germany)
13.3. Syngenta AG (Switzerland)
13.4. Novozymes A/S (Denmark)
13.5. Koppert Biological systems (the Netherlands)
13.6. Company 6
13.7. Company 7
13.8. Company 8
13.9. Company 9
*More than 10 Companies are profiled in this Research Report*
"*Financials would be provided on a best efforts basis for private companies"
14. Appendix
14.1. List of Abbreviations
14.2. Sources
14.3. Research Methodology
14.4. Expert Insights
14.5. Disclaimer
List of Tables :
Table 1. Financial Analysis of Top Companies, 2014 ($Million, Except $ in EPS)
Table 2. Product Benchmarking of Top Five Companies
Table 3. Comparison of Chemical Pesticides and BioControl Agents
Table 4. Global BioControl Agents Market Revenue, by Active Substance, 2014-2020 ($Million)
Table 5. Chart of Microbial and Pests
Table 6. Global Microbial Market Revenue, by Region, 2014-2020 ($Million)
Table 7. Global Microbial Market Revenue, by Application, 2014-2020 ($Million)
Table 8. Global Microbial BioControl Agents Market Revenue, by Target Pest, 2014-2020 ($Million)
Table 9. Few Beneficial Insects and Their Prey
Table 10. Global Macrobial Market Revenue, by Region, 2014-2020 ($Million)
Table 11. Global Macrobial Market Revenue, by Application, 2014-2020 ($Million)
Table 12. Global Macrobial Market Revenue, by Target Pest, 2014-2020 ($Million)
Table 13. Global Nematode-Based BioControl Agents Market Revenue, by Region, 2014-2020 ($Million)
Table 14. Global Nematode-Based Market Revenue, by Application, 2014-2020 ($Million)
Table 15. Global Nematode- Based BioControl Agents Market Revenue, by Target Pest, 2014-2020 ($Million)
Table 16. Global Market Revenue, by Application, 2014-2020 ($Million)
Table 17. Global Seed Treatment Market Revenue, by Environment, 2014-2020 ($Million)
Table 18. Global Seed Treatment Market Revenue, by Region, 2014-2020 ($Million)
Table 19. Global Seed Treatment BioControl Agents Market Revenue, by Crop Type, 2014-2020 ($Million)
Table 20. Global On-Field Market Revenue, by Environment, 2014-2020 ($Million)
Table 21. Global On-Field Market Revenue, by Region, 2014-2020 ($Million)
Table 22. Global On-Field BioControl Agents Market Revenue, by Crop Type, 2014-2020 ($Million)
Table 23. Global Post-Harvest Market Revenue, by Environment, 2014-2020 ($Million)
Table 24. Global Post-Harvest Market Revenue, by Region, 2014-2020 ($Million)
Table 25. Global Post-Harvest Market Revenue, by Crop Type, 2014-2020 ($Million)
Table 26. Global Market Revenue, by Environment, 2014-2020 ($Million)
Table 27. Global Horticulture Market Revenue, by Region, 2014-2020 ($Million)
Table 28. Global Horticulture Market Revenue, by Application, 2014-2020 ($Million)
Table 29. Global Horticulture Market Revenue, by Active Substance, 2014-2020 ($Million)
Table 30. Global Out-Field Crops Market Revenue, by Region, 2014-2020 ($Million)
Table 31. Global Out-Field Market Revenue, by Application, 2014-2020 ($Million)
Table 32. Global Out-Field BioControl Agents Market Revenue, by Active Substance, 2014-2020 ($Million)
Table 33. Global Market Revenue, by Target Pest, 2014-2020 ($Million)
Table 34. Global Arthropods Market Revenue, by Active Substance, 2014-2020 ($Million)
Table 35. Various Arthropod Pestsand BioControl Agent Providers
Table 36. Global Weeds Market Revenue, by Active Substance, 2014-2020 ($Million)
Table 37. Global Micro-Organisms Market Revenue, by Active Substance, 2014-2020 ($Million)
Table 38. Global Market Revenue, by Crop Type, 2014-2020 ($Million)
Table 39. Global Market: Cereals & Grains, by Application, 2014-2020 ($Million)
Table 40. Global Market: Vegetables & Fruits, by Application, 2014-2020 ($Million)
Table 41. Global Market: Pulses & Oils Market, by Application, 2014-2020 ($Million)
Table 42. Global Market: Other Crops, by Application, 2014-2020 ($Million)
Table 43. Global Market Revenue, by Region, 2014-2020 ($Million)
Table 44. North America Market Revenue, by Active Substance, 2014-2020 ($Million)
Table 45. North America BioControl Agents Market Revenue, by Application, 2014-2020 ($Million)
Table 46. North America Market Revenue, by Environment, 2014-2020 ($Million)
Table 47. North America Market Revenue, by Country, 2014-2020 ($Million)
Table 48. Latin America Market Revenue, by Active Substance, 2014-2020 ($Million)
Table 49. Latin America Market Revenue, by Application, 2014-2020 ($Million)
Table 50. Latin America Market Revenue, by Environment, 2014-2020 ($Million)
Table 51. Latin America Market Revenue, by Country, 2014-2020 ($Million)
Table 52. Europe Market Revenue, by Active Substance, 2014-2020 ($Million)
Table 53. Europe Market Revenue, by Application, 2014-2020 ($Million)
Table 54. Europe Market Revenue, by Environment, 2014-2020 ($Million)
Table 55. Europe Market Revenue, by Country, 2014-2020 ($Million)
Table 56. APAC Market Revenue, by Active Substance, 2014-2020 ($Million)
Table 57. APAC Market Revenue, by Application, 2014-2020 ($Million)
Table 58. APAC Market Revenue, by Environment, 2014-2020 ($Million)
Table 59. APAC Market Revenue, by Country, 2014-2020 ($Million)
Table 60. Row Market Revenue, by Active Substance, 2014-2020 ($Million)
Table 61. Row Market Revenue, by Application, 2014-2020 ($Million)
Table 62. Row Market Revenue, by Environment, 2014-2020 ($Million)
Table 63. Row Market Revenue, by Region, 2014-2020 ($Million)
Table 64. Syngenta Revenue, by Segment, 2012-2014 ($Billion)
Table 65. Syngenta Revenue, by Region, 2012-2014 ($Billion)
Table 66. Novozymes A/S: Total Revenue, 2011-2014 ($Million)
List of Figures :
Figure 1 BioControl Agents– Active Substance
Figure 2 BioControl Agents- Applications
Figure 3 BioControl Agents- Applications
Figure 4 BioControl Agents- Target Pest
Figure 5 BioControl Agents- Crop Type
Figure 6 Global Market Revenue, 2014 – 2020 ($Million)
Figure 7 Global Market Share, by Active Substance, 2014 (%)
Figure 8 Global BioControl Agents Market Share, Application, 2014 (%)
Figure 9 Market Share Analysis, by Revenue, 2014 (%)
Figure 10 Market: Number of Patents Obtained, by Company, 2011 to October, 2015 (%)
Figure 11 Value Chain of BioControl Agents Industry
Figure 12 Factors Influencing the Choice of BioControl Agent
Figure 13 Global BioControl Agents Market, by Type of Development, 2011 to November 2015 (%)
Figure 14 Global BioControl Agents Market Developments, by Company, 2011 to November, 2015 (%)
Figure 15 BASF: Revenue, by Business Segment, 2014 (%)
Figure 16 BASF Agricultural Solutions Segment Revenue, by Region, 2014 (%)
Figure 17 Syngenta: R&D Expenditure, 2012-2014 ($Billion)
Figure 18 Syngenta Crop Protection Sales, By Type of Crop, 2014 (%)
Figure 19 Bayer Cropscience Sales, by Region, 2014 (%)
Figure 20 Novozymes A/S: Total Revenue, by Business Segment, 2014 (%)
Figure 21 MARRONE Bio Innovations Inc.: Total Revenue, 2012-2014 ($Million)
Figure 22 MARRONE Bio Innovations Inc.: R&D Expenses, 2012-2014 ($Million)