 Email
Email Print
Print


Virtual Retinal Display Market - Forecast(2024 - 2030)
A virtual retinal display is a small headgear-mounted device. When mounted on eyeglasses, it creates an image directly onto the retina of a viewer's eye. From a coherent photon source, the device generates a beam of light to project the image. Intensity modulation is done with the beam to match the image being produced and then it is directly projected onto the retina. The image is formed by scanning low power laser light directly onto the eye (retina). The prime advantages of Virtual Retinal Displays are low power consumption, improvement in resolution, brightness, contrast, color, etc. and wide range of view.
The overall market can be segmented into components of VRD as well as end user application. In this report, the components of VRD are Video Electronics, Light Source and Modulator, Scanners, Pupil Expander, Viewer Optics, Holographic Optical Element, etc. VRD has a widespread range of potential applications such as Medical, Radiology, Surgery, Therapeutics, Productions, Communication, Augmented/Virtual Reality, Aerospace, Military, Gaming, Training and Development, etc.
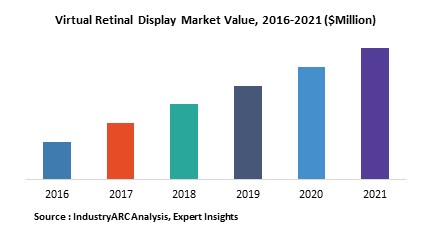
The market is also analyzed based on geographic regions which are grouped into Americas, APAC, Europe as well as RoW regions. North America is expected to be the largest market of Virtual Retinal Display. In APAC, countries like Japan, Taiwan, South Korea, etc. are the major market of VRD. By 2021, there will be increase of this market in European and ROW countries.
The necessity of virtual environments and augmented visions are the prime driving factors of the use of Virtual Retinal Display. Other driving factors are demand of higher resolution, higher contrast, increased luminance and bright images.
The top companies of the virtual retinal display market are :
- Avegant Corporation (U.S.A.),
- Brother Industries Ltd. (Japan),
- Sony Corp. (Japan),
- HTC Corp. (Taiwan),
- Oculus RV, LLC.(U.S.A.) , etc.
1. Virtual Retinal Display Market - Overview
1.1. Definitions and Scope
2. Virtual Retinal Display Market - Executive summary
2.1. Market Revenue, Market Size and Key Trends by Company
2.2. Key Trends by type of Application
2.3. Key Trends segmented by Geography
3. Virtual Retinal Display Market
3.1. Comparative analysis
3.1.1. Product Benchmarking - Top 10 companies
3.1.2. Top 5 Financials Analysis
3.1.3. Market Value split by Top 10 companies
3.1.4. Patent Analysis - Top 10 companies
3.1.5. Pricing Analysis
4. Virtual Retinal Display Market – Startup companies Scenario Premium
4.1. Top 10 startup company Analysis by
4.1.1. Investment
4.1.2. Revenue
4.1.3. Market Shares
4.1.4. Market Size and Application Analysis
4.1.5. Venture Capital and Funding Scenario
5. Virtual Retinal Display Market – Industry Market Entry Scenario Premium
5.1. Regulatory Framework Overview
5.2. New Business and Ease of Doing business index
5.3. Case studies of successful ventures
5.4. Customer Analysis – Top 10 companies
6. Virtual Retinal Display Market Forces
6.1. Drivers
6.2. Constraints
6.3. Challenges
6.4. Porters five force model
6.4.1. Bargaining power of suppliers
6.4.2. Bargaining powers of customers
6.4.3. Threat of new entrants
6.4.4. Rivalry among existing players
6.4.5. Threat of substitutes
7. Virtual Retinal Display Market -Strategic analysis
7.1. Value chain analysis
7.2. Opportunities analysis
7.3. Product life cycle
7.4. Suppliers and distributors Market Share
8. Virtual Retinal Display Market – By Components (Market Size -$Million / $Billion)
8.1. Market Size and Market Share Analysis
8.2. Application Revenue and Trend Research
8.3. Product Segment Analysis
8.3.1. Video Electronics
8.3.2. Light Source and Modulator
8.3.3. Scanners
8.3.4. Pupil Expander
8.3.5. Viewer Optics
8.3.6. Holographic Optical Element
8.3.7. Others
9. Virtual Retinal Display – By End Use Industry(Market Size -$Million / $Billion)
9.1. Segment type Size and Market Share Analysis
9.2. Application Revenue and Trends by type of Application
9.3. Application Segment Analysis by Type
9.3.1. Health Care
9.3.1.1. Radiology
9.3.1.2. Surgery
9.3.1.3. Therapeutics
9.3.1.4. Others
9.3.2. Communication
9.3.3. Aerospace
9.3.4. Military
9.3.5. Entertainment
9.3.6. Gaming
9.3.7. Training and Development
9.3.8. Sports
9.3.9. Others
10. Virtual Retinal Display - By Geography (Market Size -$Million / $Billion)
10.1. Virtual Retinal Display Market - North America Segment Research
10.2. North America Market Research (Million / $Billion)
10.2.1. Segment type Size and Market Size Analysis
10.2.2. Revenue and Trends
10.2.3. Application Revenue and Trends by type of Application
10.2.4. Company Revenue and Product Analysis
10.2.5. North America Product type and Application Market Size
10.2.5.1. U.S.
10.2.5.2. Canada
10.2.5.3. Mexico
10.2.5.4. Rest of North America
10.3. Virtual Retinal Display - South America Segment Research
10.4. South America Market Research (Market Size -$Million / $Billion)
10.4.1. Segment type Size and Market Size Analysis
10.4.2. Revenue and Trends
10.4.3. Application Revenue and Trends by type of Application
10.4.4. Company Revenue and Product Analysis
10.4.5. South America Product type and Application Market Size
10.4.5.1. Brazil
10.4.5.2. Venezuela
10.4.5.3. Argentina
10.4.5.4. Ecuador
10.4.5.5. Peru
10.4.5.6. Colombia
10.4.5.7. Costa Rica
10.4.5.8. Rest of South America
10.5. Virtual Retinal Display - Europe Segment Research
10.6. Europe Market Research (Market Size -$Million / $Billion)
10.6.1. Segment type Size and Market Size Analysis
10.6.2. Revenue and Trends
10.6.3. Application Revenue and Trends by type of Application
10.6.4. Company Revenue and Product Analysis
10.6.5. Europe Segment Product type and Application Market Size
10.6.5.1. U.K
10.6.5.2. Germany
10.6.5.3. Italy
10.6.5.4. France
10.6.5.5. Netherlands
10.6.5.6. Belgium
10.6.5.7. Spain
10.6.5.8. Denmark
10.6.5.9. Rest of Europe
10.7. Virtual Retinal Display – APAC Segment Research
10.8. APAC Market Research (Market Size -$Million / $Billion)
10.8.1. Segment type Size and Market Size Analysis
10.8.2. Revenue and Trends
10.8.3. Application Revenue and Trends by type of Application
10.8.4. Company Revenue and Product Analysis
10.8.5. APAC Segment – Product type and Application Market Size
10.8.5.1. China
10.8.5.2. Australia
10.8.5.3. Japan
10.8.5.4. South Korea
10.8.5.5. India
10.8.5.6. Taiwan
10.8.5.7. Malaysia
11. Virtual Retinal Display Market - Entropy
11.1. New product launches
11.2. M&A's, collaborations, JVs and partnerships
12. Virtual Retinal Display Market – Industry / Segment Competition landscape Premium
12.1. Market Share Analysis
12.1.1. Market Share by Country- Top companies
12.1.2. Market Share by Region- Top 10 companies
12.1.3. Market Share by type of Application – Top 10 companies
12.1.4. Market Share by type of Product / Product category- Top 10 companies
12.1.5. Market Share at global level- Top 10 companies
12.1.6. Best Practises for companies
13. Virtual Retinal Display Market – Key Company List by Country Premium
14. Virtual Retinal Display Market Company Analysis
14.1. Market Share, Company Revenue, Products, M&A, Developments
14.2. Avegant Corporation (U.S.A.),
14.3. Brother Industries Ltd. (Japan),
14.4. Sony Corp. (Japan),
14.5. HTC Corp. (Taiwan),
14.6. Oculus RV, LLC.(U.S.A.)
14.7. Company 6
14.8. Company 7
14.9. Company 8
14.10. Company 9
14.11. Company 10 and more
"*Financials would be provided on a best efforts basis for private companies"
15. Virtual Retinal Display Market -Appendix
15.1. Abbreviations
15.2. Sources
16. Virtual Retinal Display Market -Methodology Premium
16.1. Research Methodology
16.1.1. Company Expert Interviews
16.1.2. Industry Databases
16.1.3. Associations
16.1.4. Company News
16.1.5. Company Annual Reports
16.1.6. Application Trends
16.1.7. New Products and Product database
16.1.8. Company Transcripts
16.1.9. R&D Trends
16.1.10. Key Opinion Leaders Interviews
16.1.11. Supply and Demand Trends
List of Tables:
Table 1: Virtual Retinal Display Market Overview 2023-2030
Table 2: Virtual Retinal Display Market Leader Analysis 2023-2024 (US$)
Table 3: Virtual Retinal Display Market Product Analysis 2023-2024 (US$)
Table 4: Virtual Retinal Display Market End User Analysis 2023-2024 (US$)
Table 5: Virtual Retinal Display Market Patent Analysis 2021-2023* (US$)
Table 6: Virtual Retinal Display Market Financial Analysis 2023-2024 (US$)
Table 7: Virtual Retinal Display Market Driver Analysis 2023-2024 (US$)
Table 8: Virtual Retinal Display Market Challenges Analysis 2023-2024 (US$)
Table 9: Virtual Retinal Display Market Constraint Analysis 2023-2024 (US$)
Table 10: Virtual Retinal Display Market Supplier Bargaining Power Analysis 2023-2024 (US$)
Table 11: Virtual Retinal Display Market Buyer Bargaining Power Analysis 2023-2024 (US$)
Table 12: Virtual Retinal Display Market Threat of Substitutes Analysis 2023-2024 (US$)
Table 13: Virtual Retinal Display Market Threat of New Entrants Analysis 2023-2024 (US$)
Table 14: Virtual Retinal Display Market Degree of Competition Analysis 2023-2024 (US$)
Table 15: Virtual Retinal Display Market Value Chain Analysis 2023-2024 (US$)
Table 16: Virtual Retinal Display Market Pricing Analysis 2023-2030 (US$)
Table 17: Virtual Retinal Display Market Opportunities Analysis 2023-2030 (US$)
Table 18: Virtual Retinal Display Market Product Life Cycle Analysis 2023-2030 (US$)
Table 19: Virtual Retinal Display Market Supplier Analysis 2023-2024 (US$)
Table 20: Virtual Retinal Display Market Distributor Analysis 2023-2024 (US$)
Table 21: Virtual Retinal Display Market Trend Analysis 2023-2024 (US$)
Table 22: Virtual Retinal Display Market Size 2023 (US$)
Table 23: Virtual Retinal Display Market Forecast Analysis 2023-2030 (US$)
Table 24: Virtual Retinal Display Market Sales Forecast Analysis 2023-2030 (Units)
Table 25: Virtual Retinal Display Market, Revenue & Volume, By Components, 2023-2030 ($)
Table 26: Virtual Retinal Display Market By Components, Revenue & Volume, By Video Electronics, 2023-2030 ($)
Table 27: Virtual Retinal Display Market By Components, Revenue & Volume, By Light Source and Modulator, 2023-2030 ($)
Table 28: Virtual Retinal Display Market By Components, Revenue & Volume, By Scanners, 2023-2030 ($)
Table 29: Virtual Retinal Display Market By Components, Revenue & Volume, By Pupil Expander, 2023-2030 ($)
Table 30: Virtual Retinal Display Market By Components, Revenue & Volume, By Viewer Optics, 2023-2030 ($)
Table 31: Virtual Retinal Display Market, Revenue & Volume, By End User Industry, 2023-2030 ($)
Table 32: Virtual Retinal Display Market By End User Industry, Revenue & Volume, By Health Care, 2023-2030 ($)
Table 33: Virtual Retinal Display Market By End User Industry, Revenue & Volume, By Communication, 2023-2030 ($)
Table 34: Virtual Retinal Display Market By End User Industry, Revenue & Volume, By Aerospace, 2023-2030 ($)
Table 35: Virtual Retinal Display Market By End User Industry, Revenue & Volume, By Military, 2023-2030 ($)
Table 36: Virtual Retinal Display Market By End User Industry, Revenue & Volume, By Entertainment, 2023-2030 ($)
Table 37: North America Virtual Retinal Display Market, Revenue & Volume, By Components, 2023-2030 ($)
Table 38: North America Virtual Retinal Display Market, Revenue & Volume, By End User Industry, 2023-2030 ($)
Table 39: South america Virtual Retinal Display Market, Revenue & Volume, By Components, 2023-2030 ($)
Table 40: South america Virtual Retinal Display Market, Revenue & Volume, By End User Industry, 2023-2030 ($)
Table 41: Europe Virtual Retinal Display Market, Revenue & Volume, By Components, 2023-2030 ($)
Table 42: Europe Virtual Retinal Display Market, Revenue & Volume, By End User Industry, 2023-2030 ($)
Table 43: APAC Virtual Retinal Display Market, Revenue & Volume, By Components, 2023-2030 ($)
Table 44: APAC Virtual Retinal Display Market, Revenue & Volume, By End User Industry, 2023-2030 ($)
Table 45: Middle East & Africa Virtual Retinal Display Market, Revenue & Volume, By Components, 2023-2030 ($)
Table 46: Middle East & Africa Virtual Retinal Display Market, Revenue & Volume, By End User Industry, 2023-2030 ($)
Table 47: Russia Virtual Retinal Display Market, Revenue & Volume, By Components, 2023-2030 ($)
Table 48: Russia Virtual Retinal Display Market, Revenue & Volume, By End User Industry, 2023-2030 ($)
Table 49: Israel Virtual Retinal Display Market, Revenue & Volume, By Components, 2023-2030 ($)
Table 50: Israel Virtual Retinal Display Market, Revenue & Volume, By End User Industry, 2023-2030 ($)
Table 51: Top Companies 2023 (US$) Virtual Retinal Display Market, Revenue & Volume
Table 52: Product Launch 2023-2024 Virtual Retinal Display Market, Revenue & Volume
Table 53: Mergers & Acquistions 2023-2024 Virtual Retinal Display Market, Revenue & Volume
List of Figures:
Figure 1: Overview of Virtual Retinal Display Market 2023-2030
Figure 2: Market Share Analysis for Virtual Retinal Display Market 2023 (US$)
Figure 3: Product Comparison in Virtual Retinal Display Market 2023-2024 (US$)
Figure 4: End User Profile for Virtual Retinal Display Market 2023-2024 (US$)
Figure 5: Patent Application and Grant in Virtual Retinal Display Market 2021-2023* (US$)
Figure 6: Top 5 Companies Financial Analysis in Virtual Retinal Display Market 2023-2024 (US$)
Figure 7: Market Entry Strategy in Virtual Retinal Display Market 2023-2024
Figure 8: Ecosystem Analysis in Virtual Retinal Display Market 2023
Figure 9: Average Selling Price in Virtual Retinal Display Market 2023-2030
Figure 10: Top Opportunites in Virtual Retinal Display Market 2023-2024
Figure 11: Market Life Cycle Analysis in Virtual Retinal Display Market
Figure 12: GlobalBy Components Virtual Retinal Display Market Revenue, 2023-2030 ($)
Figure 13: GlobalBy End User Industry Virtual Retinal Display Market Revenue, 2023-2030 ($)
Figure 14: Global Virtual Retinal Display Market - By Geography
Figure 15: Global Virtual Retinal Display Market Value & Volume, By Geography, 2023-2030 ($)
Figure 16: Global Virtual Retinal Display Market CAGR, By Geography, 2023-2030 (%)
Figure 17: North America Virtual Retinal Display Market Value & Volume, 2023-2030 ($)
Figure 18: US Virtual Retinal Display Market Value & Volume, 2023-2030 ($)
Figure 19: US GDP and Population, 2023-2024 ($)
Figure 20: US GDP – Composition of 2023, By Sector of Origin
Figure 21: US Export and Import Value & Volume, 2023-2024 ($)
Figure 22: Canada Virtual Retinal Display Market Value & Volume, 2023-2030 ($)
Figure 23: Canada GDP and Population, 2023-2024 ($)
Figure 24: Canada GDP – Composition of 2023, By Sector of Origin
Figure 25: Canada Export and Import Value & Volume, 2023-2024 ($)
Figure 26: Mexico Virtual Retinal Display Market Value & Volume, 2023-2030 ($)
Figure 27: Mexico GDP and Population, 2023-2024 ($)
Figure 28: Mexico GDP – Composition of 2023, By Sector of Origin
Figure 29: Mexico Export and Import Value & Volume, 2023-2024 ($)
Figure 30: South America Virtual Retinal Display Market Value & Volume, 2023-2030 ($)
Figure 31: Brazil Virtual Retinal Display Market Value & Volume, 2023-2030 ($)
Figure 32: Brazil GDP and Population, 2023-2024 ($)
Figure 33: Brazil GDP – Composition of 2023, By Sector of Origin
Figure 34: Brazil Export and Import Value & Volume, 2023-2024 ($)
Figure 35: Venezuela Virtual Retinal Display Market Value & Volume, 2023-2030 ($)
Figure 36: Venezuela GDP and Population, 2023-2024 ($)
Figure 37: Venezuela GDP – Composition of 2023, By Sector of Origin
Figure 38: Venezuela Export and Import Value & Volume, 2023-2024 ($)
Figure 39: Argentina Virtual Retinal Display Market Value & Volume, 2023-2030 ($)
Figure 40: Argentina GDP and Population, 2023-2024 ($)
Figure 41: Argentina GDP – Composition of 2023, By Sector of Origin
Figure 42: Argentina Export and Import Value & Volume, 2023-2024 ($)
Figure 43: Ecuador Virtual Retinal Display Market Value & Volume, 2023-2030 ($)
Figure 44: Ecuador GDP and Population, 2023-2024 ($)
Figure 45: Ecuador GDP – Composition of 2023, By Sector of Origin
Figure 46: Ecuador Export and Import Value & Volume, 2023-2024 ($)
Figure 47: Peru Virtual Retinal Display Market Value & Volume, 2023-2030 ($)
Figure 48: Peru GDP and Population, 2023-2024 ($)
Figure 49: Peru GDP – Composition of 2023, By Sector of Origin
Figure 50: Peru Export and Import Value & Volume, 2023-2024 ($)
Figure 51: Colombia Virtual Retinal Display Market Value & Volume, 2023-2030 ($)
Figure 52: Colombia GDP and Population, 2023-2024 ($)
Figure 53: Colombia GDP – Composition of 2023, By Sector of Origin
Figure 54: Colombia Export and Import Value & Volume, 2023-2024 ($)
Figure 55: Costa Rica Virtual Retinal Display Market Value & Volume, 2023-2030 ($)
Figure 56: Costa Rica GDP and Population, 2023-2024 ($)
Figure 57: Costa Rica GDP – Composition of 2023, By Sector of Origin
Figure 58: Costa Rica Export and Import Value & Volume, 2023-2024 ($)
Figure 59: Europe Virtual Retinal Display Market Value & Volume, 2023-2030 ($)
Figure 60: U.K Virtual Retinal Display Market Value & Volume, 2023-2030 ($)
Figure 61: U.K GDP and Population, 2023-2024 ($)
Figure 62: U.K GDP – Composition of 2023, By Sector of Origin
Figure 63: U.K Export and Import Value & Volume, 2023-2024 ($)
Figure 64: Germany Virtual Retinal Display Market Value & Volume, 2023-2030 ($)
Figure 65: Germany GDP and Population, 2023-2024 ($)
Figure 66: Germany GDP – Composition of 2023, By Sector of Origin
Figure 67: Germany Export and Import Value & Volume, 2023-2024 ($)
Figure 68: Italy Virtual Retinal Display Market Value & Volume, 2023-2030 ($)
Figure 69: Italy GDP and Population, 2023-2024 ($)
Figure 70: Italy GDP – Composition of 2023, By Sector of Origin
Figure 71: Italy Export and Import Value & Volume, 2023-2024 ($)
Figure 72: France Virtual Retinal Display Market Value & Volume, 2023-2030 ($)
Figure 73: France GDP and Population, 2023-2024 ($)
Figure 74: France GDP – Composition of 2023, By Sector of Origin
Figure 75: France Export and Import Value & Volume, 2023-2024 ($)
Figure 76: Netherlands Virtual Retinal Display Market Value & Volume, 2023-2030 ($)
Figure 77: Netherlands GDP and Population, 2023-2024 ($)
Figure 78: Netherlands GDP – Composition of 2023, By Sector of Origin
Figure 79: Netherlands Export and Import Value & Volume, 2023-2024 ($)
Figure 80: Belgium Virtual Retinal Display Market Value & Volume, 2023-2030 ($)
Figure 81: Belgium GDP and Population, 2023-2024 ($)
Figure 82: Belgium GDP – Composition of 2023, By Sector of Origin
Figure 83: Belgium Export and Import Value & Volume, 2023-2024 ($)
Figure 84: Spain Virtual Retinal Display Market Value & Volume, 2023-2030 ($)
Figure 85: Spain GDP and Population, 2023-2024 ($)
Figure 86: Spain GDP – Composition of 2023, By Sector of Origin
Figure 87: Spain Export and Import Value & Volume, 2023-2024 ($)
Figure 88: Denmark Virtual Retinal Display Market Value & Volume, 2023-2030 ($)
Figure 89: Denmark GDP and Population, 2023-2024 ($)
Figure 90: Denmark GDP – Composition of 2023, By Sector of Origin
Figure 91: Denmark Export and Import Value & Volume, 2023-2024 ($)
Figure 92: APAC Virtual Retinal Display Market Value & Volume, 2023-2030 ($)
Figure 93: China Virtual Retinal Display Market Value & Volume, 2023-2030
Figure 94: China GDP and Population, 2023-2024 ($)
Figure 95: China GDP – Composition of 2023, By Sector of Origin
Figure 96: China Export and Import Value & Volume, 2023-2024 ($) Virtual Retinal Display Market China Export and Import Value & Volume, 2023-2024 ($)
Figure 97: Australia Virtual Retinal Display Market Value & Volume, 2023-2030 ($)
Figure 98: Australia GDP and Population, 2023-2024 ($)
Figure 99: Australia GDP – Composition of 2023, By Sector of Origin
Figure 100: Australia Export and Import Value & Volume, 2023-2024 ($)
Figure 101: South Korea Virtual Retinal Display Market Value & Volume, 2023-2030 ($)
Figure 102: South Korea GDP and Population, 2023-2024 ($)
Figure 103: South Korea GDP – Composition of 2023, By Sector of Origin
Figure 104: South Korea Export and Import Value & Volume, 2023-2024 ($)
Figure 105: India Virtual Retinal Display Market Value & Volume, 2023-2030 ($)
Figure 106: India GDP and Population, 2023-2024 ($)
Figure 107: India GDP – Composition of 2023, By Sector of Origin
Figure 108: India Export and Import Value & Volume, 2023-2024 ($)
Figure 109: Taiwan Virtual Retinal Display Market Value & Volume, 2023-2030 ($)
Figure 110: Taiwan GDP and Population, 2023-2024 ($)
Figure 111: Taiwan GDP – Composition of 2023, By Sector of Origin
Figure 112: Taiwan Export and Import Value & Volume, 2023-2024 ($)
Figure 113: Malaysia Virtual Retinal Display Market Value & Volume, 2023-2030 ($)
Figure 114: Malaysia GDP and Population, 2023-2024 ($)
Figure 115: Malaysia GDP – Composition of 2023, By Sector of Origin
Figure 116: Malaysia Export and Import Value & Volume, 2023-2024 ($)
Figure 117: Hong Kong Virtual Retinal Display Market Value & Volume, 2023-2030 ($)
Figure 118: Hong Kong GDP and Population, 2023-2024 ($)
Figure 119: Hong Kong GDP – Composition of 2023, By Sector of Origin
Figure 120: Hong Kong Export and Import Value & Volume, 2023-2024 ($)
Figure 121: Middle East & Africa Virtual Retinal Display Market Middle East & Africa 3D Printing Market Value & Volume, 2023-2030 ($)
Figure 122: Russia Virtual Retinal Display Market Value & Volume, 2023-2030 ($)
Figure 123: Russia GDP and Population, 2023-2024 ($)
Figure 124: Russia GDP – Composition of 2023, By Sector of Origin
Figure 125: Russia Export and Import Value & Volume, 2023-2024 ($)
Figure 126: Israel Virtual Retinal Display Market Value & Volume, 2023-2030 ($)
Figure 127: Israel GDP and Population, 2023-2024 ($)
Figure 128: Israel GDP – Composition of 2023, By Sector of Origin
Figure 129: Israel Export and Import Value & Volume, 2023-2024 ($)
Figure 130: Entropy Share, By Strategies, 2023-2024* (%) Virtual Retinal Display Market
Figure 131: Developments, 2023-2024* Virtual Retinal Display Market
Figure 132: Company 1 Virtual Retinal Display Market Net Revenue, By Years, 2023-2024* ($)
Figure 133: Company 1 Virtual Retinal Display Market Net Revenue Share, By Business segments, 2023 (%)
Figure 134: Company 1 Virtual Retinal Display Market Net Sales Share, By Geography, 2023 (%)
Figure 135: Company 2 Virtual Retinal Display Market Net Revenue, By Years, 2023-2024* ($)
Figure 136: Company 2 Virtual Retinal Display Market Net Revenue Share, By Business segments, 2023 (%)
Figure 137: Company 2 Virtual Retinal Display Market Net Sales Share, By Geography, 2023 (%)
Figure 138: Company 3 Virtual Retinal Display Market Net Revenue, By Years, 2023-2024* ($)
Figure 139: Company 3 Virtual Retinal Display Market Net Revenue Share, By Business segments, 2023 (%)
Figure 140: Company 3 Virtual Retinal Display Market Net Sales Share, By Geography, 2023 (%)
Figure 141: Company 4 Virtual Retinal Display Market Net Revenue, By Years, 2023-2024* ($)
Figure 142: Company 4 Virtual Retinal Display Market Net Revenue Share, By Business segments, 2023 (%)
Figure 143: Company 4 Virtual Retinal Display Market Net Sales Share, By Geography, 2023 (%)
Figure 144: Company 5 Virtual Retinal Display Market Net Revenue, By Years, 2023-2024* ($)
Figure 145: Company 5 Virtual Retinal Display Market Net Revenue Share, By Business segments, 2023 (%)
Figure 146: Company 5 Virtual Retinal Display Market Net Sales Share, By Geography, 2023 (%)
Figure 147: Company 6 Virtual Retinal Display Market Net Revenue, By Years, 2023-2024* ($)
Figure 148: Company 6 Virtual Retinal Display Market Net Revenue Share, By Business segments, 2023 (%)
Figure 149: Company 6 Virtual Retinal Display Market Net Sales Share, By Geography, 2023 (%)
Figure 150: Company 7 Virtual Retinal Display Market Net Revenue, By Years, 2023-2024* ($)
Figure 151: Company 7 Virtual Retinal Display Market Net Revenue Share, By Business segments, 2023 (%)
Figure 152: Company 7 Virtual Retinal Display Market Net Sales Share, By Geography, 2023 (%)
Figure 153: Company 8 Virtual Retinal Display Market Net Revenue, By Years, 2023-2024* ($)
Figure 154: Company 8 Virtual Retinal Display Market Net Revenue Share, By Business segments, 2023 (%)
Figure 155: Company 8 Virtual Retinal Display Market Net Sales Share, By Geography, 2023 (%)
Figure 156: Company 9 Virtual Retinal Display Market Net Revenue, By Years, 2023-2024* ($)
Figure 157: Company 9 Virtual Retinal Display Market Net Revenue Share, By Business segments, 2023 (%)
Figure 158: Company 9 Virtual Retinal Display Market Net Sales Share, By Geography, 2023 (%)
Figure 159: Company 10 Virtual Retinal Display Market Net Revenue, By Years, 2023-2024* ($)
Figure 160: Company 10 Virtual Retinal Display Market Net Revenue Share, By Business segments, 2023 (%)
Figure 161: Company 10 Virtual Retinal Display Market Net Sales Share, By Geography, 2023 (%)
Figure 162: Company 11 Virtual Retinal Display Market Net Revenue, By Years, 2023-2024* ($)
Figure 163: Company 11 Virtual Retinal Display Market Net Revenue Share, By Business segments, 2023 (%)
Figure 164: Company 11 Virtual Retinal Display Market Net Sales Share, By Geography, 2023 (%)
Figure 165: Company 12 Virtual Retinal Display Market Net Revenue, By Years, 2023-2024* ($)
Figure 166: Company 12 Virtual Retinal Display Market Net Revenue Share, By Business segments, 2023 (%)
Figure 167: Company 12 Virtual Retinal Display Market Net Sales Share, By Geography, 2023 (%)
Figure 168: Company 13 Virtual Retinal Display Market Net Revenue, By Years, 2023-2024* ($)
Figure 169: Company 13 Virtual Retinal Display Market Net Revenue Share, By Business segments, 2023 (%)
Figure 170: Company 13 Virtual Retinal Display Market Net Sales Share, By Geography, 2023 (%)
Figure 171: Company 14 Virtual Retinal Display Market Net Revenue, By Years, 2023-2024* ($)
Figure 172: Company 14 Virtual Retinal Display Market Net Revenue Share, By Business segments, 2023 (%)
Figure 173: Company 14 Virtual Retinal Display Market Net Sales Share, By Geography, 2023 (%)
Figure 174: Company 15 Virtual Retinal Display Market Net Revenue, By Years, 2023-2024* ($)
Figure 175: Company 15 Virtual Retinal Display Market Net Revenue Share, By Business segments, 2023 (%)
Figure 176: Company 15 Virtual Retinal Display Market Net Sales Share, By Geography, 2023 (%)