Cable Glands Market Overview:
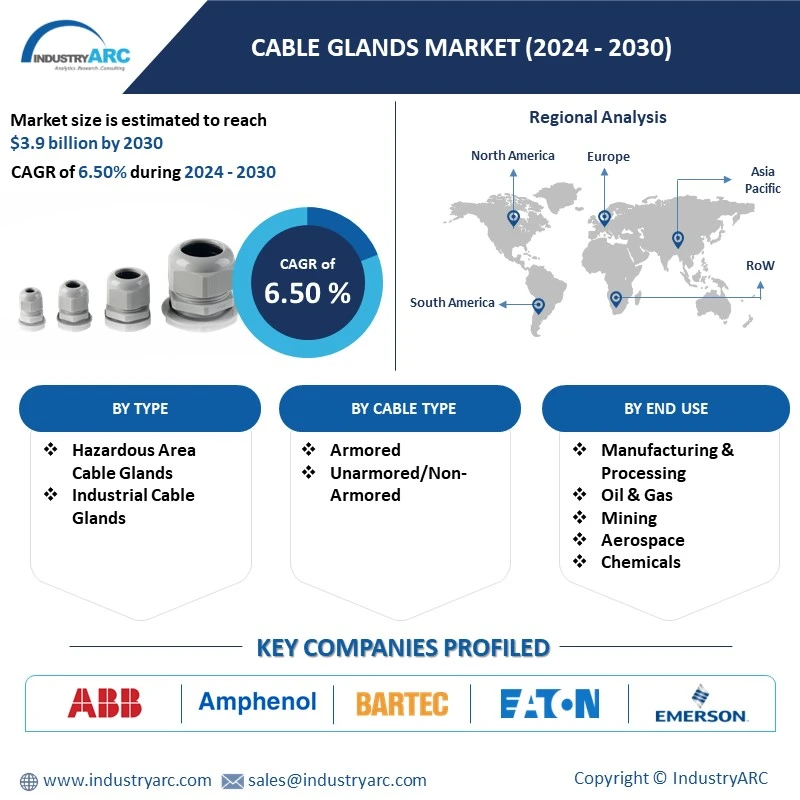
Cable Glands Market size is estimated to reach $3.9 billion by 2030 growing at a CAGR of 6.5% during the forecast period 2024-2030.
The cable glands market is witnessing a robust surge in demand, driven by the increasing need for secure and efficient cable management solutions across various industries. As businesses expand their infrastructure, the demand for reliable cable glands to ensure proper sealing and protection against environmental factors is on the rise, contributing to the cable glands market growth.
For Instance, as per the International Trade Administration, the 14th Five-Year Plan of China places a strong emphasis on new urbanization, energy, water, and transportation infrastructure projects. Estimates indicate that throughout the 14th Five-Year Plan period (2021–2025), total investments in new infrastructure will come to approximately $4.2 trillion. This growth has heightened the demand for essential components, such as cable glands, crucial for secure cable installations. This surge in infrastructure development is likely to drive demand for cable glands, essential components in ensuring secure and efficient cable installations.
Market Snapshot:
Cable Glands Market - Report Coverage:
The “Cable Glands Market Report - Forecast (2024-2030)” by IndustryARC, covers an in-depth analysis of the following segments in the Cable Glands Market.
| Attribute | Segment |
|---|
By Type | |
By Materials | Brass Stainless Steel Plastic Aluminum Nylon Nickel Others
|
By Cable Type | Armored Unarmored/Non-Armored
|
By Application | |
By End-Use | |
By Geography | North America (U.S., Canada and Mexico) Europe (Germany, France, UK, Italy, Spain, Russia and Rest of Europe), Asia-Pacific (China, Japan, South Korea, India, Australia & New Zealand and Rest of Asia-Pacific), South America (Brazil, Argentina, Chile, Colombia and Rest of South America) Rest of the World (Middle East and Africa).
|
COVID-19 / Ukraine Crisis - Impact Analysis:
• The COVID-19 pandemic has had a significant impact on the cable glands market. The global outbreak of the COVID-19 pandemic in 2020 led to a sharp decline in economic activities across various industries. This resulted in a decrease in the demand for cable glands, as many industries were forced to shut down their operations or reduce their production capacity.
• The Ukraine crisis is expected to have a significant impact on the cable glands market. The crisis has disrupted supply chains and increased the cost of raw materials. This is expected to lead to higher prices for cable glands. The crisis is also expected to reduce demand for cable glands in some industries, such as construction. This is due to economic uncertainty and the decline in construction activity in some regions.
Key Takeaways:
• Fastest Growth of APAC
Geographically, in the global Cable Glands Market share, APAC is analyzed to grow with the highest CAGR of 7.4% during the forecast period 2024-2030. The surging demand for cable glands in the APAC region is intricately tied to robust infrastructure development, notably in China, India, and Southeast Asian nations. Ongoing projects in power generation, telecommunications, and industrial facilities necessitate reliable cable management and protection, driving the need for these essential components. As the region continues its dynamic growth trajectory, the cable gland market is poised to play a pivotal role in supporting and facilitating the expanding infrastructure landscape. For instance, according to the International Energy Agency, China will be accountable for over 45% of the increase in renewable energy output between 2023 and 2025. These developments underscore a pivotal role in shaping the future of renewable energy and the growing market for cable glands in the APAC region.
• Unarmored is Register the Fastest Growth
Unarmored is analyzed to grow with the highest CAGR of 6.8% during the forecast period 2024-2030. The global market for unarmored cable glands, essential components in electrical enclosures, is experiencing steady growth. These glands establish reliable connections between cables and equipment, safeguarding against dust, water, and contaminants. Widely utilized for their protective qualities, unarmored cable glands contribute to the durability and efficiency of electrical systems worldwide. As industries expand and technological advancements continue, the demand for these glands is expected to rise, further propelling the global unarmored cable glands market.
• The Construction Segment is to Register the Highest Market Growth
According to the Cable Glands Market forecast, Construction held the largest market valuation reaching $237.6 million in 2023. The construction industry is experiencing a significant surge worldwide, leading to a higher demand for various construction materials and equipment. One such product in high demand is cable glands, which are essential for securing and protecting cables in construction projects. As the construction industry continues to boom, the cable glands market is expected to witness a steady increase in demand, reflecting the industry's growth and development. This trend highlights the importance of cable management in ensuring efficient and safe construction practices. Additionally, according to the UK Government, the worldwide construction sector is expected to rise by more than 70% by 2025. As construction projects proliferate worldwide, the demand for reliable and efficient cable management solutions intensifies.
• Growing the demand for Automation Industry
The Cable Glands Market anticipates a rapid surge in the Automation segment, driven by escalating demand for automation within industrial applications. This robust growth trajectory is propelled by the need for efficient and streamlined processes in diverse industries. As automation becomes integral to industrial operations, cable glands play a pivotal role in ensuring secure and organized cable management, further fueling their demand. The market is poised to capitalize on this trend, offering innovative solutions that cater to the evolving automation landscape. This upward trajectory underscores the pivotal role of cable glands in facilitating the seamless integration of automated systems across various industrial sectors. For instance, according to the International Trade Administration, Japan is predicted to have 40% fewer workers overall by 2065. This will lead to a rise in the need for advanced industrial equipment and equipment as well as automated systems. This trend is poised to propel the Automation segment to high growth, particularly in industrial applications.
• Volatility in Raw Material Prices Hampers the Market Growth
Cable glands can be composed of stainless steel, brass, nickel, aluminum, or plastic, depending on the kind of use. Raw material costs are very variable while producing cable glands. Their prices are very dependent on the state of the market because these are essential metals. Cable glands are commonly made from basic materials like brass and aluminum. Fluctuations in material costs impact manufacturing expenses, posing a significant hurdle for market players. This uncertainty complicates pricing strategies and affects profit margins. To navigate these challenges successfully, companies must adopt resilient supply chain practices, explore alternative materials, and implement strategic pricing models. Adapting to the dynamic raw material landscape is essential for sustaining competitiveness in the Cable Glands market.
Key Market Players:
Product/Service launches, approvals, patents and events, acquisitions, partnerships and collaborations are key strategies adopted by players in the Cable Glands Market. The top 10 companies in this industry are listed below:
1. Eaton Corporation (TMCX II Armored Glands)
2. Emerson Electric Co (Rosemount™ General Purpose Cable Gland)
3. CMP Products Ltd (CMP Cable Glands)
4. Cortem S.p.A (Cortem NAVB series barrier cable gland)
5. Warom Technology, Inc. (DQM-II Series Explosion-proof Cable Glands)
6. Sealcon LLC (Sealcon Cable glands)
7. Jacob GmbH (Jacob Perfect cable gland)
8. Amphenol Corporation (Amphenol Cable Glands)
9. BARTEC Top Holding GmbH (Bartec Cable glands)
10. ABB Group (ABB RNCG Series Cable gland)
Scope of the Report:
| Report Metric | Details |
|---|
Base Year Considered | 2023 |
Forecast Period | 2024–2030 |
CAGR | 6.5% |
Market Size in 2030 | $3.9 billion |
Segments Covered | By Type, Materials, Cable Type, Application, End-Use and Region. |
Geographies Covered | North America (U.S., Canada and Mexico), Europe (Germany, France, UK, Italy, Spain, Russia and Rest of Europe), Asia-Pacific (China, Japan, South Korea, India, Australia, New Zealand and Rest of Asia-Pacific), South America (Brazil, Argentina, Chile, Colombia and Rest of South America), Rest of the World (Middle East and Africa). |
Key Market Players | 1. Eaton Corporation 2. Emerson Electric Co 3. CMP Products Ltd 4. Cortem S.p.A 5. Warom Technology, Inc. 6. Sealcon LLC 7. Jacob GmbH 8. Amphenol Corporation 9. BARTEC Top Holding GmbH 10. ABB Group |
For more Information and Communications Technology Market reports, please click here Email
Email Print
Print


