 Email
Email Print
Print


Fermentation Ingredients Market - Forecast(2024 - 2030)
A Fermentation process is a biological process and it has requirements of sterility and use of cellular enzyme reactions instead of chemical reactions aided by inanimate catalyst at particular temperature and pressure.
The important factors that influenced the fermentation industry landscape in past years were the development of the Global bio-ethanol industry and the change of economic conditions. Industrial fermentation processes may be divided into two main types, with various combinations and modifications. These are batch fermentations and continuous fermentations.
Fermentation ingredients are added to the food, so that it stays for longer period of time. Fermentation process can change the quality and acceptability of the product. This results in improving quality of the food, makes it easier to digest, more nutritious, and better in taste. Fermentation ingredients find its application in industries such as Food and beverages, pharmaceutical, and others. Better outputs, low cost, and structure of the ingredients are being consistently used at large scale in numerous industries across the world.
The global market for Fermentation Ingredients was estimated to be $XX billion in 2015. Forecast to grow at a CAGR of XX% and to reach $XX billion by 2021. The Fermentation ingredients in alcohol industry are forecast to have the highest growth of X% during the forecast period 2016-2021. Food & beverages, alcohol, pharm and others are the major end-users for fermentation Ingredients. North America and Asia-Pacific alone are estimated to occupy a share of more than XX% in 2015.
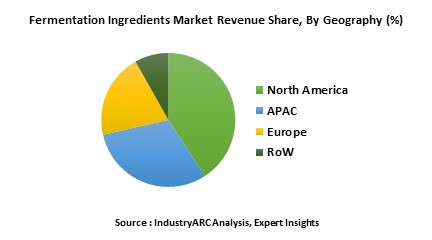
North America is the leading market for fermentation ingredient with leading the charge. North America region is forecast to have highest growth in the next few years due to growing adoption of fermentation ingredients in many applications. North America fermentation ingredient value market accounts to XX% of the global market for fermentation ingredients and is the fastest growing market followed by Asia-Pacific.
The important factors that influenced the fermentation industry landscape in past years were the development of the Global bio-ethanol industry and the change of economic conditions. Industrial fermentation processes may be divided into two main types, with various combinations and modifications. These are batch fermentations and continuous fermentations.
Fermentation ingredients are added to the food, so that it stays for longer period of time. Fermentation process can change the quality and acceptability of the product. This results in improving quality of the food, makes it easier to digest, more nutritious, and better in taste. Fermentation ingredients find its application in industries such as Food and beverages, pharmaceutical, and others. Better outputs, low cost, and structure of the ingredients are being consistently used at large scale in numerous industries across the world.
The global market for Fermentation Ingredients was estimated to be $XX billion in 2015. Forecast to grow at a CAGR of XX% and to reach $XX billion by 2021. The Fermentation ingredients in alcohol industry are forecast to have the highest growth of X% during the forecast period 2016-2021. Food & beverages, alcohol, pharm and others are the major end-users for fermentation Ingredients. North America and Asia-Pacific alone are estimated to occupy a share of more than XX% in 2015.
North America is the leading market for fermentation ingredient with leading the charge. North America region is forecast to have highest growth in the next few years due to growing adoption of fermentation ingredients in many applications. North America fermentation ingredient value market accounts to XX% of the global market for fermentation ingredients and is the fastest growing market followed by Asia-Pacific.
1. Market Overview
2. Executive Summary
3. Fermentation Ingredients Market Landscape
3.1. Market Share Analysis
3.2. Comparative Analysis
3.2.1. Product Benchmarking
3.2.2. End User Profiling
3.2.3. Top 5 Financials Analysis
4. Fermentation Ingredients Market-Forces
4.1. Market Drivers
4.2. Market Constraints & Challenges
4.2.1. Budget Allocation Is Limiting The Fermentation Ingredient Market
4.3. Attractiveness Of The Fermentation Ingredient Industry
4.3.1. Power Of Suppliers
4.3.2. Threats From New Entrants
4.3.3. Power Of Buyer
4.3.4. Threat From Substitute Product
4.3.5. Degree Of Competition
5. Fermentation Ingredients Market-Strategic Analysis
5.1. Fermentation Ingredient Market - Value Chain Analysis
5.2. Pricing Analysis
5.3. Opportunity Analysis
5.4. Product Life Cycle
5.5. Suppliers And Distributors
6. Fermentation Ingredients Market-By Type
6.1. Introduction
6.2. Food And Food Additives
6.3. Alcoholic Beverages
6.4. Chemicals
6.5. Therapeutic Compounds
6.6. Industrial Enzymes
6.7. Others
7. Fermentation Ingredients Market-By Ingredient
7.1. Introduction
7.2. Antibiotics
7.3. Organic Acids
7.4. Amino Acids
7.5. Enzymes
7.6. Vitamins
8. Fermentation Ingredients Market-By Process
8.1. Batch Fermentation
8.2. Continuous Fermentation
9. Fermentation Ingredients Market-By Industry
9.1. Food & Beverages
9.2. Alcohol Industry
9.3. Biochemistry
9.4. Pharmaceuticals
9.5. Agriculture
9.6. Environmental
9.7. Others
10. Fermentation Ingredients Market Market-By Geography
10.1. North America
10.1.1. U.S.
10.1.2. Canada
10.1.3. Mexico
10.1.4. Rest Of North America
10.2. Asia-Pacific
10.2.1. Japan
10.2.2. China
10.2.3. India
10.2.4. Australia & New Zealand
10.2.5. Rest Of Apac
10.3. Europe
10.3.1. Germany
10.3.2. France
10.3.3. Italy
10.3.4. U.K.
10.3.5. Spain
10.3.6. Rest Of Europe
10.4. Rest Of The World (Row)
10.4.1. Middle East
10.4.2. Latin America
10.4.3. Africa
11. Fermentation Ingredients Market-Entropy
11.1. New Product Developments
11.2. Product Launchers, Jvs, Mergers And Acquisitions
12. Company Profiles
12.1. Company 1
"*Financials would be provided on a best efforts basis for private companies"
2. Executive Summary
3. Fermentation Ingredients Market Landscape
3.1. Market Share Analysis
3.2. Comparative Analysis
3.2.1. Product Benchmarking
3.2.2. End User Profiling
3.2.3. Top 5 Financials Analysis
4. Fermentation Ingredients Market-Forces
4.1. Market Drivers
4.2. Market Constraints & Challenges
4.2.1. Budget Allocation Is Limiting The Fermentation Ingredient Market
4.3. Attractiveness Of The Fermentation Ingredient Industry
4.3.1. Power Of Suppliers
4.3.2. Threats From New Entrants
4.3.3. Power Of Buyer
4.3.4. Threat From Substitute Product
4.3.5. Degree Of Competition
5. Fermentation Ingredients Market-Strategic Analysis
5.1. Fermentation Ingredient Market - Value Chain Analysis
5.2. Pricing Analysis
5.3. Opportunity Analysis
5.4. Product Life Cycle
5.5. Suppliers And Distributors
6. Fermentation Ingredients Market-By Type
6.1. Introduction
6.2. Food And Food Additives
6.3. Alcoholic Beverages
6.4. Chemicals
6.5. Therapeutic Compounds
6.6. Industrial Enzymes
6.7. Others
7. Fermentation Ingredients Market-By Ingredient
7.1. Introduction
7.2. Antibiotics
7.3. Organic Acids
7.4. Amino Acids
7.5. Enzymes
7.6. Vitamins
8. Fermentation Ingredients Market-By Process
8.1. Batch Fermentation
8.2. Continuous Fermentation
9. Fermentation Ingredients Market-By Industry
9.1. Food & Beverages
9.2. Alcohol Industry
9.3. Biochemistry
9.4. Pharmaceuticals
9.5. Agriculture
9.6. Environmental
9.7. Others
10. Fermentation Ingredients Market Market-By Geography
10.1. North America
10.1.1. U.S.
10.1.2. Canada
10.1.3. Mexico
10.1.4. Rest Of North America
10.2. Asia-Pacific
10.2.1. Japan
10.2.2. China
10.2.3. India
10.2.4. Australia & New Zealand
10.2.5. Rest Of Apac
10.3. Europe
10.3.1. Germany
10.3.2. France
10.3.3. Italy
10.3.4. U.K.
10.3.5. Spain
10.3.6. Rest Of Europe
10.4. Rest Of The World (Row)
10.4.1. Middle East
10.4.2. Latin America
10.4.3. Africa
11. Fermentation Ingredients Market-Entropy
11.1. New Product Developments
11.2. Product Launchers, Jvs, Mergers And Acquisitions
12. Company Profiles
12.1. Company 1
12.2. Company 2
12.3. Company 3
12.4. Company 4
12.5. Company 5
12.6. Company 6
12.7. Company 7
12.8. Company 8
12.9. Company 9
12.10. Company 10
*More than 10 Companies are profiled in this Research Report*"*Financials would be provided on a best efforts basis for private companies"
List of Tables
Table 1: Fermentation Ingredients Market Overview 2023-2030
Table 2: Fermentation Ingredients Market Leader Analysis 2023-2024 (US$)
Table 3: Fermentation Ingredients Market Product Analysis 2023-2024 (US$)
Table 4: Fermentation Ingredients Market End User Analysis 2023-2024 (US$)
Table 5: Fermentation Ingredients Market Patent Analysis 2021-2023* (US$)
Table 6: Fermentation Ingredients Market Financial Analysis 2023-2024 (US$)
Table 7: Fermentation Ingredients Market Driver Analysis 2023-2024 (US$)
Table 8: Fermentation Ingredients Market Challenges Analysis 2023-2024 (US$)
Table 9: Fermentation Ingredients Market Constraint Analysis 2023-2024 (US$)
Table 10: Fermentation Ingredients Market Supplier Bargaining Power Analysis 2023-2024 (US$)
Table 11: Fermentation Ingredients Market Buyer Bargaining Power Analysis 2023-2024 (US$)
Table 12: Fermentation Ingredients Market Threat of Substitutes Analysis 2023-2024 (US$)
Table 13: Fermentation Ingredients Market Threat of New Entrants Analysis 2023-2024 (US$)
Table 14: Fermentation Ingredients Market Degree of Competition Analysis 2023-2024 (US$)
Table 15: Fermentation Ingredients Market Value Chain Analysis 2023-2024 (US$)
Table 16: Fermentation Ingredients Market Pricing Analysis 2023-2030 (US$)
Table 17: Fermentation Ingredients Market Opportunities Analysis 2023-2030 (US$)
Table 18: Fermentation Ingredients Market Product Life Cycle Analysis 2023-2030 (US$)
Table 19: Fermentation Ingredients Market Supplier Analysis 2023-2024 (US$)
Table 20: Fermentation Ingredients Market Distributor Analysis 2023-2024 (US$)
Table 21: Fermentation Ingredients Market Trend Analysis 2023-2024 (US$)
Table 22: Fermentation Ingredients Market Size 2023 (US$)
Table 23: Fermentation Ingredients Market Forecast Analysis 2023-2030 (US$)
Table 24: Fermentation Ingredients Market Sales Forecast Analysis 2023-2030 (Units)
Table 25: Fermentation Ingredients Market , Revenue & Volume,By Type, 2023-2030 ($)
Table 26: Fermentation Ingredients Market By Type, Revenue & Volume,By Food And Food Additives, 2023-2030 ($)
Table 27: Fermentation Ingredients Market By Type, Revenue & Volume,By Alcoholic Beverages, 2023-2030 ($)
Table 28: Fermentation Ingredients Market By Type, Revenue & Volume,By Chemicals, 2023-2030 ($)
Table 29: Fermentation Ingredients Market By Type, Revenue & Volume,By Therapeutic Compounds, 2023-2030 ($)
Table 30: Fermentation Ingredients Market By Type, Revenue & Volume,By Industrial Enzymes, 2023-2030 ($)
Table 31: Fermentation Ingredients Market , Revenue & Volume,By Ingredient, 2023-2030 ($)
Table 32: Fermentation Ingredients Market By Ingredient, Revenue & Volume,By Antibiotics, 2023-2030 ($)
Table 33: Fermentation Ingredients Market By Ingredient, Revenue & Volume,By Organic Acids, 2023-2030 ($)
Table 34: Fermentation Ingredients Market By Ingredient, Revenue & Volume,By Amino Acids, 2023-2030 ($)
Table 35: Fermentation Ingredients Market By Ingredient, Revenue & Volume,By Enzymes, 2023-2030 ($)
Table 36: Fermentation Ingredients Market By Ingredient, Revenue & Volume,By Vitamins, 2023-2030 ($)
Table 37: Fermentation Ingredients Market , Revenue & Volume,By Process, 2023-2030 ($)
Table 38: Fermentation Ingredients Market By Process, Revenue & Volume,By Batch Fermentation, 2023-2030 ($)
Table 39: Fermentation Ingredients Market By Process, Revenue & Volume,By Continuous Fermentation, 2023-2030 ($)
Table 40: Fermentation Ingredients Market , Revenue & Volume,By Industry, 2023-2030 ($)
Table 41: Fermentation Ingredients Market By Industry, Revenue & Volume,By Food & Beverages, 2023-2030 ($)
Table 42: Fermentation Ingredients Market By Industry, Revenue & Volume,By Alcohol Industry, 2023-2030 ($)
Table 43: Fermentation Ingredients Market By Industry, Revenue & Volume,By Biochemistry, 2023-2030 ($)
Table 44: Fermentation Ingredients Market By Industry, Revenue & Volume,By Pharmaceuticals, 2023-2030 ($)
Table 45: Fermentation Ingredients Market By Industry, Revenue & Volume,By Agriculture, 2023-2030 ($)
Table 46: North America Fermentation Ingredients Market , Revenue & Volume,By Type, 2023-2030 ($)
Table 47: North America Fermentation Ingredients Market , Revenue & Volume,By Ingredient, 2023-2030 ($)
Table 48: North America Fermentation Ingredients Market , Revenue & Volume,By Process, 2023-2030 ($)
Table 49: North America Fermentation Ingredients Market , Revenue & Volume,By Industry, 2023-2030 ($)
Table 50: South america Fermentation Ingredients Market , Revenue & Volume,By Type, 2023-2030 ($)
Table 51: South america Fermentation Ingredients Market , Revenue & Volume,By Ingredient, 2023-2030 ($)
Table 52: South america Fermentation Ingredients Market , Revenue & Volume,By Process, 2023-2030 ($)
Table 53: South america Fermentation Ingredients Market , Revenue & Volume,By Industry, 2023-2030 ($)
Table 54: Europe Fermentation Ingredients Market , Revenue & Volume,By Type, 2023-2030 ($)
Table 55: Europe Fermentation Ingredients Market , Revenue & Volume,By Ingredient, 2023-2030 ($)
Table 56: Europe Fermentation Ingredients Market , Revenue & Volume,By Process, 2023-2030 ($)
Table 57: Europe Fermentation Ingredients Market , Revenue & Volume,By Industry, 2023-2030 ($)
Table 58: APAC Fermentation Ingredients Market , Revenue & Volume,By Type, 2023-2030 ($)
Table 59: APAC Fermentation Ingredients Market , Revenue & Volume,By Ingredient, 2023-2030 ($)
Table 60: APAC Fermentation Ingredients Market , Revenue & Volume,By Process, 2023-2030 ($)
Table 61: APAC Fermentation Ingredients Market , Revenue & Volume,By Industry, 2023-2030 ($)
Table 62: Middle East & Africa Fermentation Ingredients Market , Revenue & Volume,By Type, 2023-2030 ($)
Table 63: Middle East & Africa Fermentation Ingredients Market , Revenue & Volume,By Ingredient, 2023-2030 ($)
Table 64: Middle East & Africa Fermentation Ingredients Market , Revenue & Volume,By Process, 2023-2030 ($)
Table 65: Middle East & Africa Fermentation Ingredients Market , Revenue & Volume,By Industry, 2023-2030 ($)
Table 66: Russia Fermentation Ingredients Market , Revenue & Volume,By Type, 2023-2030 ($)
Table 67: Russia Fermentation Ingredients Market , Revenue & Volume,By Ingredient, 2023-2030 ($)
Table 68: Russia Fermentation Ingredients Market , Revenue & Volume,By Process, 2023-2030 ($)
Table 69: Russia Fermentation Ingredients Market , Revenue & Volume,By Industry, 2023-2030 ($)
Table 70: Israel Fermentation Ingredients Market , Revenue & Volume,By Type, 2023-2030 ($)
Table 71: Israel Fermentation Ingredients Market , Revenue & Volume,By Ingredient, 2023-2030 ($)
Table 72: Israel Fermentation Ingredients Market , Revenue & Volume,By Process, 2023-2030 ($)
Table 73: Israel Fermentation Ingredients Market , Revenue & Volume,By Industry, 2023-2030 ($)
Table 74: Top Companies 2023 (US$)Fermentation Ingredients Market , Revenue & Volume
Table 75: Product Launch 2023-2024Fermentation Ingredients Market , Revenue & Volume
Table 76: Mergers & Acquistions 2023-2024Fermentation Ingredients Market , Revenue & Volume
List of Figures
Figure 1: Overview of Fermentation Ingredients Market 2023-2030
Figure 2: Market Share Analysis for Fermentation Ingredients Market 2023 (US$)
Figure 3: Product Comparison in Fermentation Ingredients Market 2023-2024 (US$)
Figure 4: End User Profile for Fermentation Ingredients Market 2023-2024 (US$)
Figure 5: Patent Application and Grant in Fermentation Ingredients Market 2021-2023* (US$)
Figure 6: Top 5 Companies Financial Analysis in Fermentation Ingredients Market 2023-2024 (US$)
Figure 7: Market Entry Strategy in Fermentation Ingredients Market 2023-2024
Figure 8: Ecosystem Analysis in Fermentation Ingredients Market 2023
Figure 9: Average Selling Price in Fermentation Ingredients Market 2023-2030
Figure 10: Top Opportunites in Fermentation Ingredients Market 2023-2024
Figure 11: Market Life Cycle Analysis in Fermentation Ingredients Market
Figure 12: GlobalBy TypeFermentation Ingredients Market Revenue, 2023-2030 ($)
Figure 13: GlobalBy IngredientFermentation Ingredients Market Revenue, 2023-2030 ($)
Figure 14: GlobalBy ProcessFermentation Ingredients Market Revenue, 2023-2030 ($)
Figure 15: GlobalBy IndustryFermentation Ingredients Market Revenue, 2023-2030 ($)
Figure 16: Global Fermentation Ingredients Market - By Geography
Figure 17: Global Fermentation Ingredients Market Value & Volume, By Geography, 2023-2030 ($)
Figure 18: Global Fermentation Ingredients Market CAGR, By Geography, 2023-2030 (%)
Figure 19: North America Fermentation Ingredients Market Value & Volume, 2023-2030 ($)
Figure 20: US Fermentation Ingredients Market Value & Volume, 2023-2030 ($)
Figure 21: US GDP and Population, 2023-2024 ($)
Figure 22: US GDP – Composition of 2023, By Sector of Origin
Figure 23: US Export and Import Value & Volume, 2023-2024 ($)
Figure 24: Canada Fermentation Ingredients Market Value & Volume, 2023-2030 ($)
Figure 25: Canada GDP and Population, 2023-2024 ($)
Figure 26: Canada GDP – Composition of 2023, By Sector of Origin
Figure 27: Canada Export and Import Value & Volume, 2023-2024 ($)
Figure 28: Mexico Fermentation Ingredients Market Value & Volume, 2023-2030 ($)
Figure 29: Mexico GDP and Population, 2023-2024 ($)
Figure 30: Mexico GDP – Composition of 2023, By Sector of Origin
Figure 31: Mexico Export and Import Value & Volume, 2023-2024 ($)
Figure 32: South America Fermentation Ingredients Market Value & Volume, 2023-2030 ($)
Figure 33: Brazil Fermentation Ingredients Market Value & Volume, 2023-2030 ($)
Figure 34: Brazil GDP and Population, 2023-2024 ($)
Figure 35: Brazil GDP – Composition of 2023, By Sector of Origin
Figure 36: Brazil Export and Import Value & Volume, 2023-2024 ($)
Figure 37: Venezuela Fermentation Ingredients Market Value & Volume, 2023-2030 ($)
Figure 38: Venezuela GDP and Population, 2023-2024 ($)
Figure 39: Venezuela GDP – Composition of 2023, By Sector of Origin
Figure 40: Venezuela Export and Import Value & Volume, 2023-2024 ($)
Figure 41: Argentina Fermentation Ingredients Market Value & Volume, 2023-2030 ($)
Figure 42: Argentina GDP and Population, 2023-2024 ($)
Figure 43: Argentina GDP – Composition of 2023, By Sector of Origin
Figure 44: Argentina Export and Import Value & Volume, 2023-2024 ($)
Figure 45: Ecuador Fermentation Ingredients Market Value & Volume, 2023-2030 ($)
Figure 46: Ecuador GDP and Population, 2023-2024 ($)
Figure 47: Ecuador GDP – Composition of 2023, By Sector of Origin
Figure 48: Ecuador Export and Import Value & Volume, 2023-2024 ($)
Figure 49: Peru Fermentation Ingredients Market Value & Volume, 2023-2030 ($)
Figure 50: Peru GDP and Population, 2023-2024 ($)
Figure 51: Peru GDP – Composition of 2023, By Sector of Origin
Figure 52: Peru Export and Import Value & Volume, 2023-2024 ($)
Figure 53: Colombia Fermentation Ingredients Market Value & Volume, 2023-2030 ($)
Figure 54: Colombia GDP and Population, 2023-2024 ($)
Figure 55: Colombia GDP – Composition of 2023, By Sector of Origin
Figure 56: Colombia Export and Import Value & Volume, 2023-2024 ($)
Figure 57: Costa Rica Fermentation Ingredients Market Value & Volume, 2023-2030 ($)
Figure 58: Costa Rica GDP and Population, 2023-2024 ($)
Figure 59: Costa Rica GDP – Composition of 2023, By Sector of Origin
Figure 60: Costa Rica Export and Import Value & Volume, 2023-2024 ($)
Figure 61: Europe Fermentation Ingredients Market Value & Volume, 2023-2030 ($)
Figure 62: U.K Fermentation Ingredients Market Value & Volume, 2023-2030 ($)
Figure 63: U.K GDP and Population, 2023-2024 ($)
Figure 64: U.K GDP – Composition of 2023, By Sector of Origin
Figure 65: U.K Export and Import Value & Volume, 2023-2024 ($)
Figure 66: Germany Fermentation Ingredients Market Value & Volume, 2023-2030 ($)
Figure 67: Germany GDP and Population, 2023-2024 ($)
Figure 68: Germany GDP – Composition of 2023, By Sector of Origin
Figure 69: Germany Export and Import Value & Volume, 2023-2024 ($)
Figure 70: Italy Fermentation Ingredients Market Value & Volume, 2023-2030 ($)
Figure 71: Italy GDP and Population, 2023-2024 ($)
Figure 72: Italy GDP – Composition of 2023, By Sector of Origin
Figure 73: Italy Export and Import Value & Volume, 2023-2024 ($)
Figure 74: France Fermentation Ingredients Market Value & Volume, 2023-2030 ($)
Figure 75: France GDP and Population, 2023-2024 ($)
Figure 76: France GDP – Composition of 2023, By Sector of Origin
Figure 77: France Export and Import Value & Volume, 2023-2024 ($)
Figure 78: Netherlands Fermentation Ingredients Market Value & Volume, 2023-2030 ($)
Figure 79: Netherlands GDP and Population, 2023-2024 ($)
Figure 80: Netherlands GDP – Composition of 2023, By Sector of Origin
Figure 81: Netherlands Export and Import Value & Volume, 2023-2024 ($)
Figure 82: Belgium Fermentation Ingredients Market Value & Volume, 2023-2030 ($)
Figure 83: Belgium GDP and Population, 2023-2024 ($)
Figure 84: Belgium GDP – Composition of 2023, By Sector of Origin
Figure 85: Belgium Export and Import Value & Volume, 2023-2024 ($)
Figure 86: Spain Fermentation Ingredients Market Value & Volume, 2023-2030 ($)
Figure 87: Spain GDP and Population, 2023-2024 ($)
Figure 88: Spain GDP – Composition of 2023, By Sector of Origin
Figure 89: Spain Export and Import Value & Volume, 2023-2024 ($)
Figure 90: Denmark Fermentation Ingredients Market Value & Volume, 2023-2030 ($)
Figure 91: Denmark GDP and Population, 2023-2024 ($)
Figure 92: Denmark GDP – Composition of 2023, By Sector of Origin
Figure 93: Denmark Export and Import Value & Volume, 2023-2024 ($)
Figure 94: APAC Fermentation Ingredients Market Value & Volume, 2023-2030 ($)
Figure 95: China Fermentation Ingredients Market Value & Volume, 2023-2030
Figure 96: China GDP and Population, 2023-2024 ($)
Figure 97: China GDP – Composition of 2023, By Sector of Origin
Figure 98: China Export and Import Value & Volume, 2023-2024 ($)Fermentation Ingredients Market China Export and Import Value & Volume, 2023-2024 ($)
Figure 99: Australia Fermentation Ingredients Market Value & Volume, 2023-2030 ($)
Figure 100: Australia GDP and Population, 2023-2024 ($)
Figure 101: Australia GDP – Composition of 2023, By Sector of Origin
Figure 102: Australia Export and Import Value & Volume, 2023-2024 ($)
Figure 103: South Korea Fermentation Ingredients Market Value & Volume, 2023-2030 ($)
Figure 104: South Korea GDP and Population, 2023-2024 ($)
Figure 105: South Korea GDP – Composition of 2023, By Sector of Origin
Figure 106: South Korea Export and Import Value & Volume, 2023-2024 ($)
Figure 107: India Fermentation Ingredients Market Value & Volume, 2023-2030 ($)
Figure 108: India GDP and Population, 2023-2024 ($)
Figure 109: India GDP – Composition of 2023, By Sector of Origin
Figure 110: India Export and Import Value & Volume, 2023-2024 ($)
Figure 111: Taiwan Fermentation Ingredients Market Value & Volume, 2023-2030 ($)
Figure 112: Taiwan GDP and Population, 2023-2024 ($)
Figure 113: Taiwan GDP – Composition of 2023, By Sector of Origin
Figure 114: Taiwan Export and Import Value & Volume, 2023-2024 ($)
Figure 115: Malaysia Fermentation Ingredients Market Value & Volume, 2023-2030 ($)
Figure 116: Malaysia GDP and Population, 2023-2024 ($)
Figure 117: Malaysia GDP – Composition of 2023, By Sector of Origin
Figure 118: Malaysia Export and Import Value & Volume, 2023-2024 ($)
Figure 119: Hong Kong Fermentation Ingredients Market Value & Volume, 2023-2030 ($)
Figure 120: Hong Kong GDP and Population, 2023-2024 ($)
Figure 121: Hong Kong GDP – Composition of 2023, By Sector of Origin
Figure 122: Hong Kong Export and Import Value & Volume, 2023-2024 ($)
Figure 123: Middle East & Africa Fermentation Ingredients Market Middle East & Africa 3D Printing Market Value & Volume, 2023-2030 ($)
Figure 124: Russia Fermentation Ingredients Market Value & Volume, 2023-2030 ($)
Figure 125: Russia GDP and Population, 2023-2024 ($)
Figure 126: Russia GDP – Composition of 2023, By Sector of Origin
Figure 127: Russia Export and Import Value & Volume, 2023-2024 ($)
Figure 128: Israel Fermentation Ingredients Market Value & Volume, 2023-2030 ($)
Figure 129: Israel GDP and Population, 2023-2024 ($)
Figure 130: Israel GDP – Composition of 2023, By Sector of Origin
Figure 131: Israel Export and Import Value & Volume, 2023-2024 ($)
Figure 132: Entropy Share, By Strategies, 2023-2024* (%)Fermentation Ingredients Market
Figure 133: Developments, 2023-2024*Fermentation Ingredients Market
Figure 134: Company 1 Fermentation Ingredients Market Net Revenue, By Years, 2023-2024* ($)
Figure 135: Company 1 Fermentation Ingredients Market Net Revenue Share, By Business segments, 2023 (%)
Figure 136: Company 1 Fermentation Ingredients Market Net Sales Share, By Geography, 2023 (%)
Figure 137: Company 2 Fermentation Ingredients Market Net Revenue, By Years, 2023-2024* ($)
Figure 138: Company 2 Fermentation Ingredients Market Net Revenue Share, By Business segments, 2023 (%)
Figure 139: Company 2 Fermentation Ingredients Market Net Sales Share, By Geography, 2023 (%)
Figure 140: Company 3Fermentation Ingredients Market Net Revenue, By Years, 2023-2024* ($)
Figure 141: Company 3Fermentation Ingredients Market Net Revenue Share, By Business segments, 2023 (%)
Figure 142: Company 3Fermentation Ingredients Market Net Sales Share, By Geography, 2023 (%)
Figure 143: Company 4 Fermentation Ingredients Market Net Revenue, By Years, 2023-2024* ($)
Figure 144: Company 4 Fermentation Ingredients Market Net Revenue Share, By Business segments, 2023 (%)
Figure 145: Company 4 Fermentation Ingredients Market Net Sales Share, By Geography, 2023 (%)
Figure 146: Company 5 Fermentation Ingredients Market Net Revenue, By Years, 2023-2024* ($)
Figure 147: Company 5 Fermentation Ingredients Market Net Revenue Share, By Business segments, 2023 (%)
Figure 148: Company 5 Fermentation Ingredients Market Net Sales Share, By Geography, 2023 (%)
Figure 149: Company 6 Fermentation Ingredients Market Net Revenue, By Years, 2023-2024* ($)
Figure 150: Company 6 Fermentation Ingredients Market Net Revenue Share, By Business segments, 2023 (%)
Figure 151: Company 6 Fermentation Ingredients Market Net Sales Share, By Geography, 2023 (%)
Figure 152: Company 7 Fermentation Ingredients Market Net Revenue, By Years, 2023-2024* ($)
Figure 153: Company 7 Fermentation Ingredients Market Net Revenue Share, By Business segments, 2023 (%)
Figure 154: Company 7 Fermentation Ingredients Market Net Sales Share, By Geography, 2023 (%)
Figure 155: Company 8 Fermentation Ingredients Market Net Revenue, By Years, 2023-2024* ($)
Figure 156: Company 8 Fermentation Ingredients Market Net Revenue Share, By Business segments, 2023 (%)
Figure 157: Company 8 Fermentation Ingredients Market Net Sales Share, By Geography, 2023 (%)
Figure 158: Company 9 Fermentation Ingredients Market Net Revenue, By Years, 2023-2024* ($)
Figure 159: Company 9 Fermentation Ingredients Market Net Revenue Share, By Business segments, 2023 (%)
Figure 160: Company 9 Fermentation Ingredients Market Net Sales Share, By Geography, 2023 (%)
Figure 161: Company 10 Fermentation Ingredients Market Net Revenue, By Years, 2023-2024* ($)
Figure 162: Company 10 Fermentation Ingredients Market Net Revenue Share, By Business segments, 2023 (%)
Figure 163: Company 10 Fermentation Ingredients Market Net Sales Share, By Geography, 2023 (%)
Figure 164: Company 11 Fermentation Ingredients Market Net Revenue, By Years, 2023-2024* ($)
Figure 165: Company 11 Fermentation Ingredients Market Net Revenue Share, By Business segments, 2023 (%)
Figure 166: Company 11 Fermentation Ingredients Market Net Sales Share, By Geography, 2023 (%)
Figure 167: Company 12 Fermentation Ingredients Market Net Revenue, By Years, 2023-2024* ($)
Figure 168: Company 12 Fermentation Ingredients Market Net Revenue Share, By Business segments, 2023 (%)
Figure 169: Company 12 Fermentation Ingredients Market Net Sales Share, By Geography, 2023 (%)
Figure 170: Company 13Fermentation Ingredients Market Net Revenue, By Years, 2023-2024* ($)
Figure 171: Company 13Fermentation Ingredients Market Net Revenue Share, By Business segments, 2023 (%)
Figure 172: Company 13Fermentation Ingredients Market Net Sales Share, By Geography, 2023 (%)
Figure 173: Company 14 Fermentation Ingredients Market Net Revenue, By Years, 2023-2024* ($)
Figure 174: Company 14 Fermentation Ingredients Market Net Revenue Share, By Business segments, 2023 (%)
Figure 175: Company 14 Fermentation Ingredients Market Net Sales Share, By Geography, 2023 (%)
Figure 176: Company 15 Fermentation Ingredients Market Net Revenue, By Years, 2023-2024* ($)
Figure 177: Company 15 Fermentation Ingredients Market Net Revenue Share, By Business segments, 2023 (%)
Figure 178: Company 15 Fermentation Ingredients Market Net Sales Share, By Geography, 2023 (%)