 Email
Email Print
Print


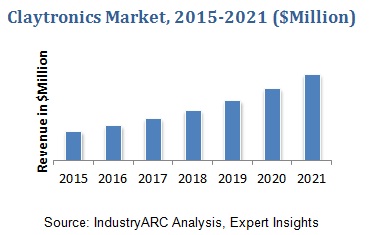
Claytronics is referred as ‘Programmable Matter’ Catoms and similar to nanomachine. Claytronics is a combination of Nano scale robotics and computer science to create individual nanometer-scale computers. Claytronics is a concept of combining billions of micron-scale or catoms and creating a computer generated artifacts as a real thing and this complete self-assembling and controlled over the internet by real one living miles away. catoms can interact with each other and form tangible 3D objects that a user can interact with. Claytronics is a future concept of developing modular robotics. Claytronics concept is a basis for forming new media type which is useful in reproducing moving 3D objects into the real world. Claytronics is of programmable matter and its primary function is to organize itself into shape of an object and to render its outer surface to match the visual appearance of that object. This technology is used in education, healthcare, entertainment and activities such as in video games and more. Improving human-to-human communication even when they remain considerably far away is the main purpose of this technology.
Concept predicts changing multimillion-module robot outfits into three-dimensional prospects with sufficient conformity so as to persuade that the visions are for real. Using Claytronics, the physical presence of the person sitting beside can be felt even though they are far away. The advantages of saving lives during disaster, doctor operating patient remotely and other advantages drives the future of claytronics market. High research and maintenance cost are the constraints which could be overcome in the fore-coming years.
The global Claytronics market can be segmented based on types into Planer catoms, Electrostatic catoms, Giant Helium Catoms, Stochastic catoms and Millimeter Scale catoms. Copeonents into hardware and software. Applications into Consumer Products, Hotels, Medical, Disaster Relief, Virtual meetings, Entertainment, 3D physical Modeling’s.
The overall market has also been presented from the perspective of different geographical locations into standard geographic regions and key economies in the market. Competitive landscape for each of the segments has been highlighted and market players are profiled with attributes of company overview, financial overview, business strategies, product portfolio and recent developments.
Sample Companies Profiled in this Report are:
- Claytronics Inc.,
- Intel Corporation
- Others
- 10+
1. CLAYTRONICS MARKET – MARKET OVERVIEW
2. CLAYTRONICS MARKET – EXECUTIVE SUMMARY
3. CLAYTRONICS MARKET – MARKET LANDSCAPE
3.1. Market Share Analysis
3.2. Comparative Analysis
3.2.1. Product Benchmarking
3.2.2. End User Profiling
3.2.3. Patent Analysis
3.2.4. Top 5 Financial Analysis
4. CLAYTRONICS MARKET – MARKET FORCES
4.1. Market Drivers
4.2. Market Constraints
4.3. Market Challenges
4.4. Attractiveness of Claytronics Market
4.4.1. Power of Suppliers
4.4.2. Power of Customers
4.4.3. Threat of New Entrants
4.4.4. Threat of Substitutions
4.4.5. Degree of Competitions
5. CLAYTRONICS MARKET – STRATEGIC ANALYSIS
5.1. Value Chain Analysis
5.2. Pricing Analysis
5.3. Opportunities Analysis
5.4. Product/Market Lifecycles Analysis
5.5. Suppliers & Distributors
6. CLAYTRONICS MARKET – BY TYPES
6.1. Planar catoms
6.2. Electrostatics catoms
6.3. Giant Helium catoms
6.4. Stochastic catoms
6.5. Millimeter scale catoms
7. CLAYTRONICS MARKET – BY COMPONENTS
7.1. Hardware
7.2. Software
7.2.1. Programming languages MELD and LDP
7.2.2. Shape sculpting
7.2.3. Localization
7.2.4. Dynamic simulation
7.2.5. Integrated debugging
8. CLAYTRONICS MARKET – BY APPLICATIONS
8.1. Consumer Electronics
8.1.1. 3D Fax
8.2. Hotels
8.3. Medical
8.3.1. Surgery
8.4. Disaster Relief
8.4.1. Medical personnel
8.4.2. Firefighters
8.4.3. Others
8.5. Virtual meetings
8.6. Entertainment
8.7. 3D Physical Modeling
8.8. Robotics
9. GEOGRAPHIC ANALYSIS
9.1. Introduction
9.2. Americas
9.2.1. U.S.
9.2.2. Canada
9.2.3. Mexico
9.2.4. Brazil
9.2.5. Argentina
9.2.6. Rest of Americas
9.3. Europe
9.3.1. U.K.
9.3.2. Germany
9.3.3. France
9.3.4. Spain
9.3.5. Italy
9.3.6. Rest of Europe
9.4. APAC
9.4.1. China
9.4.2. Japan
9.4.3. India
9.4.4. South Korea
9.4.5. Australia & New Zealand
9.4.6. Rest of APAC
9.5. ROW
9.5.1. Middle East
9.5.2. Africa
10. MARKET ENTROPY
10.1. New Product Developments
10.2. Product Launches, JVs, Mergers and Acquisitions
11. COMPANY PROFILES
11.1. Company 1
11.2. Company 2
11.3. Company 3
11.4. Company 4
11.5. Company 5
11.6. Company 6
11.7. Company 7
11.8. Company 8
11.9. Company 9
11.10. Company 10
*More than 10 Companies are profiled in this Research Report*
"*Financials would be provided on a best efforts basis for private companies"
12. APPENDIX
12.1. Abbreviations
12.2. Sources
12.3. Research Methodology
12.4. Bibliography
12.5. Compilation of Experts
12.6. Disclaimer
List of Tables:
Table 1: Claytronics Market Overview 2023-2030
Table 2: Claytronics Market Leader Analysis 2023-2030 (US$)
Table 3: Claytronics Market Product Analysis 2023-2030 (US$)
Table 4: Claytronics Market End User Analysis 2023-2030 (US$)
Table 5: Claytronics Market Patent Analysis 2013-2023* (US$)
Table 6: Claytronics Market Financial Analysis 2023-2030 (US$)
Table 7: Claytronics Market Driver Analysis 2023-2030 (US$)
Table 8: Claytronics Market Challenges Analysis 2023-2030 (US$)
Table 9: Claytronics Market Constraint Analysis 2023-2030 (US$)
Table 10: Claytronics Market Supplier Bargaining Power Analysis 2023-2030 (US$)
Table 11: Claytronics Market Buyer Bargaining Power Analysis 2023-2030 (US$)
Table 12: Claytronics Market Threat of Substitutes Analysis 2023-2030 (US$)
Table 13: Claytronics Market Threat of New Entrants Analysis 2023-2030 (US$)
Table 14: Claytronics Market Degree of Competition Analysis 2023-2030 (US$)
Table 15: Claytronics Market Value Chain Analysis 2023-2030 (US$)
Table 16: Claytronics Market Pricing Analysis 2023-2030 (US$)
Table 17: Claytronics Market Opportunities Analysis 2023-2030 (US$)
Table 18: Claytronics Market Product Life Cycle Analysis 2023-2030 (US$)
Table 19: Claytronics Market Supplier Analysis 2023-2030 (US$)
Table 20: Claytronics Market Distributor Analysis 2023-2030 (US$)
Table 21: Claytronics Market Trend Analysis 2023-2030 (US$)
Table 22: Claytronics Market Size 2023 (US$)
Table 23: Claytronics Market Forecast Analysis 2023-2030 (US$)
Table 24: Claytronics Market Sales Forecast Analysis 2023-2030 (Units)
Table 25: Claytronics Market, Revenue & Volume, By Types, 2023-2030 ($)
Table 26: Claytronics Market By Types, Revenue & Volume, By Planar catoms, 2023-2030 ($)
Table 27: Claytronics Market By Types, Revenue & Volume, By Electrostatics catoms, 2023-2030 ($)
Table 28: Claytronics Market By Types, Revenue & Volume, By Giant Helium catoms, 2023-2030 ($)
Table 29: Claytronics Market By Types, Revenue & Volume, By Stochastic catoms, 2023-2030 ($)
Table 30: Claytronics Market By Types, Revenue & Volume, By Millimeter scale catoms, 2023-2030 ($)
Table 31: Claytronics Market, Revenue & Volume, By COMPONENTS, 2023-2030 ($)
Table 32: Claytronics Market By COMPONENTS, Revenue & Volume, By Hardware, 2023-2030 ($)
Table 33: Claytronics Market By COMPONENTS, Revenue & Volume, By Software, 2023-2030 ($)
Table 34: Claytronics Market, Revenue & Volume, By Applications, 2023-2030 ($)
Table 35: Claytronics Market By Applications, Revenue & Volume, By Consumer Electronics, 2023-2030 ($)
Table 36: Claytronics Market By Applications, Revenue & Volume, By Hotels, 2023-2030 ($)
Table 37: Claytronics Market By Applications, Revenue & Volume, By Medical, 2023-2030 ($)
Table 38: Claytronics Market By Applications, Revenue & Volume, By Disaster Relief, 2023-2030 ($)
Table 39: Claytronics Market By Applications, Revenue & Volume, By Virtual meetings, 2023-2030 ($)
Table 40: North America Claytronics Market, Revenue & Volume, By Types, 2023-2030 ($)
Table 41: North America Claytronics Market, Revenue & Volume, By COMPONENTS, 2023-2030 ($)
Table 42: North America Claytronics Market, Revenue & Volume, By Applications, 2023-2030 ($)
Table 43: South america Claytronics Market, Revenue & Volume, By Types, 2023-2030 ($)
Table 44: South america Claytronics Market, Revenue & Volume, By COMPONENTS, 2023-2030 ($)
Table 45: South america Claytronics Market, Revenue & Volume, By Applications, 2023-2030 ($)
Table 46: Europe Claytronics Market, Revenue & Volume, By Types, 2023-2030 ($)
Table 47: Europe Claytronics Market, Revenue & Volume, By COMPONENTS, 2023-2030 ($)
Table 48: Europe Claytronics Market, Revenue & Volume, By Applications, 2023-2030 ($)
Table 49: APAC Claytronics Market, Revenue & Volume, By Types, 2023-2030 ($)
Table 50: APAC Claytronics Market, Revenue & Volume, By COMPONENTS, 2023-2030 ($)
Table 51: APAC Claytronics Market, Revenue & Volume, By Applications, 2023-2030 ($)
Table 52: Middle East & Africa Claytronics Market, Revenue & Volume, By Types, 2023-2030 ($)
Table 53: Middle East & Africa Claytronics Market, Revenue & Volume, By COMPONENTS, 2023-2030 ($)
Table 54: Middle East & Africa Claytronics Market, Revenue & Volume, By Applications, 2023-2030 ($)
Table 55: Russia Claytronics Market, Revenue & Volume, By Types, 2023-2030 ($)
Table 56: Russia Claytronics Market, Revenue & Volume, By COMPONENTS, 2023-2030 ($)
Table 57: Russia Claytronics Market, Revenue & Volume, By Applications, 2023-2030 ($)
Table 58: Israel Claytronics Market, Revenue & Volume, By Types, 2023-2030 ($)
Table 59: Israel Claytronics Market, Revenue & Volume, By COMPONENTS, 2023-2030 ($)
Table 60: Israel Claytronics Market, Revenue & Volume, By Applications, 2023-2030 ($)
Table 61: Top Companies 2023 (US$) Claytronics Market, Revenue & Volume
Table 62: Product Launch 2023-2030 Claytronics Market, Revenue & Volume
Table 63: Mergers & Acquistions 2023-2030 Claytronics Market, Revenue & Volume
List of Figures:
Figure 1: Overview of Claytronics Market 2023-2030
Figure 2: Market Share Analysis for Claytronics Market 2023 (US$)
Figure 3: Product Comparison in Claytronics Market 2023-2030 (US$)
Figure 4: End User Profile for Claytronics Market 2023-2030 (US$)
Figure 5: Patent Application and Grant in Claytronics Market 2013-2023* (US$)
Figure 6: Top 5 Companies Financial Analysis in Claytronics Market 2023-2030 (US$)
Figure 7: Market Entry Strategy in Claytronics Market 2023-2030
Figure 8: Ecosystem Analysis in Claytronics Market 2023
Figure 9: Average Selling Price in Claytronics Market 2023-2030
Figure 10: Top Opportunites in Claytronics Market 2023-2030
Figure 11: Market Life Cycle Analysis in Claytronics Market
Figure 12: GlobalBy Types Claytronics Market Revenue, 2023-2030 ($)
Figure 13: GlobalBy COMPONENTS Claytronics Market Revenue, 2023-2030 ($)
Figure 14: GlobalBy Applications Claytronics Market Revenue, 2023-2030 ($)
Figure 15: Global Claytronics Market - By Geography
Figure 16: Global Claytronics Market Value & Volume, By Geography, 2023-2030 ($)
Figure 17: Global Claytronics Market CAGR, By Geography, 2023-2030 (%)
Figure 18: North America Claytronics Market Value & Volume, 2023-2030 ($)
Figure 19: US Claytronics Market Value & Volume, 2023-2030 ($)
Figure 20: US GDP and Population, 2023-2030 ($)
Figure 21: US GDP – Composition of 2023, By Sector of Origin
Figure 22: US Export and Import Value & Volume, 2023-2030 ($)
Figure 23: Canada Claytronics Market Value & Volume, 2023-2030 ($)
Figure 24: Canada GDP and Population, 2023-2030 ($)
Figure 25: Canada GDP – Composition of 2023, By Sector of Origin
Figure 26: Canada Export and Import Value & Volume, 2023-2030 ($)
Figure 27: Mexico Claytronics Market Value & Volume, 2023-2030 ($)
Figure 28: Mexico GDP and Population, 2023-2030 ($)
Figure 29: Mexico GDP – Composition of 2023, By Sector of Origin
Figure 30: Mexico Export and Import Value & Volume, 2023-2030 ($)
Figure 31: South America Claytronics Market Value & Volume, 2023-2030 ($)
Figure 32: Brazil Claytronics Market Value & Volume, 2023-2030 ($)
Figure 33: Brazil GDP and Population, 2023-2030 ($)
Figure 34: Brazil GDP – Composition of 2023, By Sector of Origin
Figure 35: Brazil Export and Import Value & Volume, 2023-2030 ($)
Figure 36: Venezuela Claytronics Market Value & Volume, 2023-2030 ($)
Figure 37: Venezuela GDP and Population, 2023-2030 ($)
Figure 38: Venezuela GDP – Composition of 2023, By Sector of Origin
Figure 39: Venezuela Export and Import Value & Volume, 2023-2030 ($)
Figure 40: Argentina Claytronics Market Value & Volume, 2023-2030 ($)
Figure 41: Argentina GDP and Population, 2023-2030 ($)
Figure 42: Argentina GDP – Composition of 2023, By Sector of Origin
Figure 43: Argentina Export and Import Value & Volume, 2023-2030 ($)
Figure 44: Ecuador Claytronics Market Value & Volume, 2023-2030 ($)
Figure 45: Ecuador GDP and Population, 2023-2030 ($)
Figure 46: Ecuador GDP – Composition of 2023, By Sector of Origin
Figure 47: Ecuador Export and Import Value & Volume, 2023-2030 ($)
Figure 48: Peru Claytronics Market Value & Volume, 2023-2030 ($)
Figure 49: Peru GDP and Population, 2023-2030 ($)
Figure 50: Peru GDP – Composition of 2023, By Sector of Origin
Figure 51: Peru Export and Import Value & Volume, 2023-2030 ($)
Figure 52: Colombia Claytronics Market Value & Volume, 2023-2030 ($)
Figure 53: Colombia GDP and Population, 2023-2030 ($)
Figure 54: Colombia GDP – Composition of 2023, By Sector of Origin
Figure 55: Colombia Export and Import Value & Volume, 2023-2030 ($)
Figure 56: Costa Rica Claytronics Market Value & Volume, 2023-2030 ($)
Figure 57: Costa Rica GDP and Population, 2023-2030 ($)
Figure 58: Costa Rica GDP – Composition of 2023, By Sector of Origin
Figure 59: Costa Rica Export and Import Value & Volume, 2023-2030 ($)
Figure 60: Europe Claytronics Market Value & Volume, 2023-2030 ($)
Figure 61: U.K Claytronics Market Value & Volume, 2023-2030 ($)
Figure 62: U.K GDP and Population, 2023-2030 ($)
Figure 63: U.K GDP – Composition of 2023, By Sector of Origin
Figure 64: U.K Export and Import Value & Volume, 2023-2030 ($)
Figure 65: Germany Claytronics Market Value & Volume, 2023-2030 ($)
Figure 66: Germany GDP and Population, 2023-2030 ($)
Figure 67: Germany GDP – Composition of 2023, By Sector of Origin
Figure 68: Germany Export and Import Value & Volume, 2023-2030 ($)
Figure 69: Italy Claytronics Market Value & Volume, 2023-2030 ($)
Figure 70: Italy GDP and Population, 2023-2030 ($)
Figure 71: Italy GDP – Composition of 2023, By Sector of Origin
Figure 72: Italy Export and Import Value & Volume, 2023-2030 ($)
Figure 73: France Claytronics Market Value & Volume, 2023-2030 ($)
Figure 74: France GDP and Population, 2023-2030 ($)
Figure 75: France GDP – Composition of 2023, By Sector of Origin
Figure 76: France Export and Import Value & Volume, 2023-2030 ($)
Figure 77: Netherlands Claytronics Market Value & Volume, 2023-2030 ($)
Figure 78: Netherlands GDP and Population, 2023-2030 ($)
Figure 79: Netherlands GDP – Composition of 2023, By Sector of Origin
Figure 80: Netherlands Export and Import Value & Volume, 2023-2030 ($)
Figure 81: Belgium Claytronics Market Value & Volume, 2023-2030 ($)
Figure 82: Belgium GDP and Population, 2023-2030 ($)
Figure 83: Belgium GDP – Composition of 2023, By Sector of Origin
Figure 84: Belgium Export and Import Value & Volume, 2023-2030 ($)
Figure 85: Spain Claytronics Market Value & Volume, 2023-2030 ($)
Figure 86: Spain GDP and Population, 2023-2030 ($)
Figure 87: Spain GDP – Composition of 2023, By Sector of Origin
Figure 88: Spain Export and Import Value & Volume, 2023-2030 ($)
Figure 89: Denmark Claytronics Market Value & Volume, 2023-2030 ($)
Figure 90: Denmark GDP and Population, 2023-2030 ($)
Figure 91: Denmark GDP – Composition of 2023, By Sector of Origin
Figure 92: Denmark Export and Import Value & Volume, 2023-2030 ($)
Figure 93: APAC Claytronics Market Value & Volume, 2023-2030 ($)
Figure 94: China Claytronics Market Value & Volume, 2023-2030
Figure 95: China GDP and Population, 2023-2030 ($)
Figure 96: China GDP – Composition of 2023, By Sector of Origin
Figure 97: China Export and Import Value & Volume, 2023-2030 ($) Claytronics Market China Export and Import Value & Volume, 2023-2030 ($)
Figure 98: Australia Claytronics Market Value & Volume, 2023-2030 ($)
Figure 99: Australia GDP and Population, 2023-2030 ($)
Figure 100: Australia GDP – Composition of 2023, By Sector of Origin
Figure 101: Australia Export and Import Value & Volume, 2023-2030 ($)
Figure 102: South Korea Claytronics Market Value & Volume, 2023-2030 ($)
Figure 103: South Korea GDP and Population, 2023-2030 ($)
Figure 104: South Korea GDP – Composition of 2023, By Sector of Origin
Figure 105: South Korea Export and Import Value & Volume, 2023-2030 ($)
Figure 106: India Claytronics Market Value & Volume, 2023-2030 ($)
Figure 107: India GDP and Population, 2023-2030 ($)
Figure 108: India GDP – Composition of 2023, By Sector of Origin
Figure 109: India Export and Import Value & Volume, 2023-2030 ($)
Figure 110: Taiwan Claytronics Market Value & Volume, 2023-2030 ($)
Figure 111: Taiwan GDP and Population, 2023-2030 ($)
Figure 112: Taiwan GDP – Composition of 2023, By Sector of Origin
Figure 113: Taiwan Export and Import Value & Volume, 2023-2030 ($)
Figure 114: Malaysia Claytronics Market Value & Volume, 2023-2030 ($)
Figure 115: Malaysia GDP and Population, 2023-2030 ($)
Figure 116: Malaysia GDP – Composition of 2023, By Sector of Origin
Figure 117: Malaysia Export and Import Value & Volume, 2023-2030 ($)
Figure 118: Hong Kong Claytronics Market Value & Volume, 2023-2030 ($)
Figure 119: Hong Kong GDP and Population, 2023-2030 ($)
Figure 120: Hong Kong GDP – Composition of 2023, By Sector of Origin
Figure 121: Hong Kong Export and Import Value & Volume, 2023-2030 ($)
Figure 122: Middle East & Africa Claytronics Market Middle East & Africa 3D Printing Market Value & Volume, 2023-2030 ($)
Figure 123: Russia Claytronics Market Value & Volume, 2023-2030 ($)
Figure 124: Russia GDP and Population, 2023-2030 ($)
Figure 125: Russia GDP – Composition of 2023, By Sector of Origin
Figure 126: Russia Export and Import Value & Volume, 2023-2030 ($)
Figure 127: Israel Claytronics Market Value & Volume, 2023-2030 ($)
Figure 128: Israel GDP and Population, 2023-2030 ($)
Figure 129: Israel GDP – Composition of 2023, By Sector of Origin
Figure 130: Israel Export and Import Value & Volume, 2023-2030 ($)
Figure 131: Entropy Share, By Strategies, 2023-2030* (%) Claytronics Market
Figure 132: Developments, 2023-2030* Claytronics Market
Figure 133: Company 1 Claytronics Market Net Revenue, By Years, 2023-2030* ($)
Figure 134: Company 1 Claytronics Market Net Revenue Share, By Business segments, 2023 (%)
Figure 135: Company 1 Claytronics Market Net Sales Share, By Geography, 2023 (%)
Figure 136: Company 2 Claytronics Market Net Revenue, By Years, 2023-2030* ($)
Figure 137: Company 2 Claytronics Market Net Revenue Share, By Business segments, 2023 (%)
Figure 138: Company 2 Claytronics Market Net Sales Share, By Geography, 2023 (%)
Figure 139: Company 3 Claytronics Market Net Revenue, By Years, 2023-2030* ($)
Figure 140: Company 3 Claytronics Market Net Revenue Share, By Business segments, 2023 (%)
Figure 141: Company 3 Claytronics Market Net Sales Share, By Geography, 2023 (%)
Figure 142: Company 4 Claytronics Market Net Revenue, By Years, 2023-2030* ($)
Figure 143: Company 4 Claytronics Market Net Revenue Share, By Business segments, 2023 (%)
Figure 144: Company 4 Claytronics Market Net Sales Share, By Geography, 2023 (%)
Figure 145: Company 5 Claytronics Market Net Revenue, By Years, 2023-2030* ($)
Figure 146: Company 5 Claytronics Market Net Revenue Share, By Business segments, 2023 (%)
Figure 147: Company 5 Claytronics Market Net Sales Share, By Geography, 2023 (%)
Figure 148: Company 6 Claytronics Market Net Revenue, By Years, 2023-2030* ($)
Figure 149: Company 6 Claytronics Market Net Revenue Share, By Business segments, 2023 (%)
Figure 150: Company 6 Claytronics Market Net Sales Share, By Geography, 2023 (%)
Figure 151: Company 7 Claytronics Market Net Revenue, By Years, 2023-2030* ($)
Figure 152: Company 7 Claytronics Market Net Revenue Share, By Business segments, 2023 (%)
Figure 153: Company 7 Claytronics Market Net Sales Share, By Geography, 2023 (%)
Figure 154: Company 8 Claytronics Market Net Revenue, By Years, 2023-2030* ($)
Figure 155: Company 8 Claytronics Market Net Revenue Share, By Business segments, 2023 (%)
Figure 156: Company 8 Claytronics Market Net Sales Share, By Geography, 2023 (%)
Figure 157: Company 9 Claytronics Market Net Revenue, By Years, 2023-2030* ($)
Figure 158: Company 9 Claytronics Market Net Revenue Share, By Business segments, 2023 (%)
Figure 159: Company 9 Claytronics Market Net Sales Share, By Geography, 2023 (%)
Figure 160: Company 10 Claytronics Market Net Revenue, By Years, 2023-2030* ($)
Figure 161: Company 10 Claytronics Market Net Revenue Share, By Business segments, 2023 (%)
Figure 162: Company 10 Claytronics Market Net Sales Share, By Geography, 2023 (%)
Figure 163: Company 11 Claytronics Market Net Revenue, By Years, 2023-2030* ($)
Figure 164: Company 11 Claytronics Market Net Revenue Share, By Business segments, 2023 (%)
Figure 165: Company 11 Claytronics Market Net Sales Share, By Geography, 2023 (%)
Figure 166: Company 12 Claytronics Market Net Revenue, By Years, 2023-2030* ($)
Figure 167: Company 12 Claytronics Market Net Revenue Share, By Business segments, 2023 (%)
Figure 168: Company 12 Claytronics Market Net Sales Share, By Geography, 2023 (%)
Figure 169: Company 13 Claytronics Market Net Revenue, By Years, 2023-2030* ($)
Figure 170: Company 13 Claytronics Market Net Revenue Share, By Business segments, 2023 (%)
Figure 171: Company 13 Claytronics Market Net Sales Share, By Geography, 2023 (%)
Figure 172: Company 14 Claytronics Market Net Revenue, By Years, 2023-2030* ($)
Figure 173: Company 14 Claytronics Market Net Revenue Share, By Business segments, 2023 (%)
Figure 174: Company 14 Claytronics Market Net Sales Share, By Geography, 2023 (%)
Figure 175: Company 15 Claytronics Market Net Revenue, By Years, 2023-2030* ($)
Figure 176: Company 15 Claytronics Market Net Revenue Share, By Business segments, 2023 (%)
Figure 177: Company 15 Claytronics Market Net Sales Share, By Geography, 2023 (%)