 Email
Email Print
Print


Fuel Cell Market Overview:
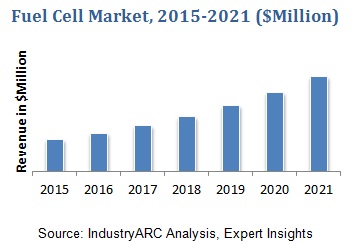
According to the International Trade Center (ITC), the trade of fuel cells that are particularly used in electric motors and generators was valued at $19.2 billion in 2018. Fuel cells have diverse domestic and commercial applications as they are indispensable parts of many machines in which chemical energy is converted into electrical energy. The fuel cell market was valued at $4.5 billion in 2018 and is projected to grow at a compound annual growth rate (CAGR) of 15.38% from 2019 to 2025.
The federal governments of countries such as the U.S. and Canada are supporting the private companies that manufacture fuel cells. The fuel cell market is observing funding opportunities from the US Department of Energy (DOE), and the Fuel Cell Technologies Office (FCTO) that belongs to the Office of Energy Efficiency and Renewable Energy. On March 1, 2019, the DOE announced a $51.5m funding for research in technologies that power trucks and off-road vehicles. Similarly, other countries in North America had observed soaring sales of fuel cells recently. The North America fuel cell market held 33.27% share of the global market in 2018.
Fuel Cell Market Outlook:
Fuel cells such as hydrogen fuel cells, solid oxide fuel cells, and methane fuel cells are electrochemical cells that convert chemical energy into electrical energy. Fuel cell energy is required in domestic and commercial sectors, and it is also used to charge the fuel cell vehicles.
The application segment that is poised to create the most lucrative opportunities to the vendors in the fuel cell market is the stationary power application segment. This is mainly attributable to the application of fuel cells in generators, which are important standby electricity suppliers. Furthermore, there is expected to be an augmented application of fuel cells in the uninterruptible power supply market, which had a valuation of $10.5 billion to $11 billion in 2018, and the segment is poised to observe a substantial CAGR of 4% to 5%, which will further propel the fuel cell market. The stationary segment will observe a healthy CAGR of 16.94% through 2025.
Fuel Cell Market Growth Drivers:
· The Application of Fuel Cells in the Automotive Industry –
According to the International Organization of Motor Vehicle Manufacturers (OICA), the number of vehicles manufactured in 2018 was 95,634,593. Furthermore, the future will observe an increment in the manufacturing of automobiles, and more so with the advent of electric vehicles, autonomous & semi-autonomous vehicles, and self-driven trucks. The growth prospects in the automotive sector will escalate the fuel cell market revenue in the future.
· Commercial Applications Expanding the Fuel Cell Market Size –
A variety of fuel cells such as proton exchange membrane fuel cells, solid oxide fuel cells, solid polymer fuel cells, phosphoric acid fuel cells, and alkaline fuel cells are used in commercial buildings. Given that motors and generators have prominent applications in commercial buildings, the segment happens to be a lucrative fuel cell marketplace.
Fuel Cell Market Trends –
· Latest Developments – Fuel cell catalyst technology has been constrained by two hurdles that include manufacturing costs and durability. However, there are innovations in the fuel cell market, and there will be alterations in the fuel cells stack technology. These innovations will significantly reduce the costs by reducing the usage of precious metals and improving the longevity of fuel cells through innovative designs in catalyst layers.
· In November 2018, Panasonic decided to commercialize the hydrogen fuel cell generator in order to accelerate initiatives to achieve a sustainable society by utilizing hydrogen energy. This trend will be adopted by a lot of organizations, and further drive the hydrogen fuel cell market and hydrogen market as well.
· In December 2018, Hydrogenics Corporation was awarded a contract for the design and supply of fuel cell power modules for a new lightweight aircraft. This will position the company in the aircraft fuel cells segment.
Fuel Cell Market Challenges –
Even though fuel cells are found to be excellent alternatives to internal combustion engines that aren’t environment-friendly, fuel cells are yet to penetrate various industries and replace the conventional form of energy, which is limiting the expansion of the fuel cell market. Furthermore, the vendors are striving to optimize the pricing according to the end-user criteria in order to thrive on the demand, which is picking up pace. Another factor that is constraining the growth of the customer-base is the reliability of fuel cells. However, manufacturers are making hefty investments into R&D, and the future is poised to observe some innovations that will disrupt the fuel cell market.
Fuel Cell Market Key Players Perspective –
The major players that are battling for the fuel cell market share are Ballard Power Systems Inc., Toshiba Corporation, Panasonic Corporation, Horizon Fuel Cell Technologies, Hydrogenics Corporation, Fuel Cell Energy, Inc., Ceramic Fuel Cells Limited, Aisin Seiki Co., Ltd., Doosan Fuel Cell America, Nuvera Fuel Cells, SFC Group, Bloom Energy, Nedstack Fuel Cell Technology B.V., Plug Power, UTC Power Corp., and Arcola Energy.
Fuel Cell Market Research Scope:
The base year of the study is 2018, with forecast done up to 2025. The study presents a thorough analysis of the competitive landscape, taking into account the market shares of the leading companies. It also provides information on unit shipments. These provide the key market participants with the necessary business intelligence and help them understand the future of the fuel cell market. The assessment includes the forecast, an overview of the competitive structure, the market shares of the competitors, as well as the market trends, market demands, market drivers, market challenges, and product analysis. The market drivers and restraints have been assessed to fathom their impact over the forecast period. This report further identifies the key opportunities for growth while also detailing the key challenges and possible threats. The fuel cell market research report also analyzes the applications of the devices in the commercial, consumer product, and automobile sectors.
Fuel Cell Market Report: Industry Coverage
This report also documents the product based on types, which include metal hydride fuel cell, DFAFC, and UMFC.
The fuel cell market report also analyzes the major geographic regions as well as the major countries in these regions. The regions and countries covered in the study include:
- North America: The U.S., Canada, Mexico
- South America: Brazil, Venezuela, Argentina, Ecuador, Peru, Colombia, Costa Rica
- Europe: The U.K., Germany, Italy, France, the Netherlands, Belgium, Spain, Denmark
- APAC: China, Japan, Australia, South Korea, India, Taiwan, Malaysia, Hong Kong
- Middle East and Africa: Israel, South Africa, Saudi Arabia
For more Electronics related reports, please click here
2. Executive summary
3. Fuel Cell – Market Landscape
3.1. Market Share Analysis
3.2. Comparative Analysis
3.2.1. Product Benchmarking
3.2.2. End user profiling
3.2.3. Patent Analysis
3.2.4. Top 5 Financials Analysis
4. Fuel Cell – Market Forces
4.1. Market Drivers
4.2. Market Constraints
4.3. Market Challenges
4.4. Attractiveness of the Image Sensor Industry
4.4.1. Bargaining Power of Suppliers
4.4.2. Bargaining power of buyers
4.4.3. Threat of New Entrants
4.4.4. Threat of substitution
4.4.5. Rivalry among competitors
5. Fuel Cell Market – Strategic Analysis
5.1. Value Chain Analysis
5.2. Pricing Analysis
5.3. Opportunities Analysis
5.4. Product/Market Life Cycle Analysis
5.5. Supplier and Distributor Analysis
6. Fuel Cell Market - By Usage
6.1. Primary and backup power for commercial,Industial and residential buildings
6.2. Electronics
6.3. Automobiles
6.4. Power Fuel-Cell vehicles
6.5. Lifts
6.6. Boats
6.7. Submarines
6.8. Hybrid Vehicles
6.9. Small heating appliances
6.10. Food preservation
6.11. Fueling stations
7. Fuel-Cell Market - By Type
7.1. Metal hydride fuel cell
7.2. Direct formic acid fuel cell (DFAFC)
7.3. Up flow microbial fuel cell (UMFC)
7.4. Electro-galvanic fuel cell
7.5. Zinc-air battery
7.6. Microbial fuel cell
7.7. Regenerative fuel cell
7.8. Direct borohydride fuel cell
7.9. Alkaline fuel cell
7.10. Direct methanol fuel cell
7.11. Reformed methanol fuel cell
7.12. Direct-ethanol fuel cell
7.13. Proton exchange membrane fuel cell
7.14. RFC – Redox
7.15. Phosphoric acid fuel cell
7.16. Solid acid fuel cell
7.17. Molten carbonate fuel cell
7.18. Tubular solid oxide fuel cell (TSOFC)
7.19. Protonic ceramic fuel cell
7.20. Direct carbon fuel cell
7.21. Planar Solid oxide fuel cell
7.22. Enzymatic Biofuel Cells
7.23. Magnesium-Air Fuel Cell
8. Fuel Cell Market - By Geography
8.1. Americas
8.1.1. U.S.
8.1.2. Canada
8.1.3. Brazil
8.1.4. Others
8.2. Europe
8.2.1. U.K.
8.2.2. France
8.2.3. Germany
8.2.4. Others
8.3. Asia- Pacific
8.3.1. China
8.3.2. Japan
8.3.3. India
8.3.4. Australia
8.3.5. Others
8.4. ROW
9. Market Entropy
9.1. Preferred Strategy
9.2. New Product Launches
9.3. Mergers & Acquisitions
9.4. Product Developments
9.5. Ventures & Partnerships
9.6. R&D and Business Expansions
10. Company Profiles
"*Financials would be provided on a best efforts basis for private companies"
11. Appendix
11.1. Abbreviations
11.2. Sources
11.3. Research Methodology
11.4. Disclaimer
Table 1 Fuel cell Market Overview 2023-2030
Table 2 Fuel cell Market Leader Analysis 2023-2030 (US$)
Table 3 Fuel cell MarketProduct Analysis 2023-2030 (US$)
Table 4 Fuel cell MarketEnd User Analysis 2023-2030 (US$)
Table 5 Fuel cell MarketPatent Analysis 2013-2023* (US$)
Table 6 Fuel cell MarketFinancial Analysis 2023-2030 (US$)
Table 7 Fuel cell Market Driver Analysis 2023-2030 (US$)
Table 8 Fuel cell MarketChallenges Analysis 2023-2030 (US$)
Table 9 Fuel cell MarketConstraint Analysis 2023-2030 (US$)
Table 10 Fuel cell Market Supplier Bargaining Power Analysis 2023-2030 (US$)
Table 11 Fuel cell Market Buyer Bargaining Power Analysis 2023-2030 (US$)
Table 12 Fuel cell Market Threat of Substitutes Analysis 2023-2030 (US$)
Table 13 Fuel cell Market Threat of New Entrants Analysis 2023-2030 (US$)
Table 14 Fuel cell Market Degree of Competition Analysis 2023-2030 (US$)
Table 15 Fuel cell MarketValue Chain Analysis 2023-2030 (US$)
Table 16 Fuel cell MarketPricing Analysis 2023-2030 (US$)
Table 17 Fuel cell MarketOpportunities Analysis 2023-2030 (US$)
Table 18 Fuel cell MarketProduct Life Cycle Analysis 2023-2030 (US$)
Table 19 Fuel cell MarketSupplier Analysis 2023-2030 (US$)
Table 20 Fuel cell MarketDistributor Analysis 2023-2030 (US$)
Table 21 Fuel cell Market Trend Analysis 2023-2030 (US$)
Table 22 Fuel cell Market Size 2023 (US$)
Table 23 Fuel cell Market Forecast Analysis 2023-2030 (US$)
Table 24 Fuel cell Market Sales Forecast Analysis 2023-2030 (Units)
Table 25 Fuel cell Market, Revenue & Volume,By Type, 2023-2030 ($)
Table 26 Fuel cell MarketBy Type, Revenue & Volume,By Metal hydride fuel cell, 2023-2030 ($)
Table 27 Fuel cell MarketBy Type, Revenue & Volume,By Direct formic acid fuel cell (DFAFC), 2023-2030 ($)
Table 28 Fuel cell MarketBy Type, Revenue & Volume,By Up flow microbial fuel cell (UMFC), 2023-2030 ($)
Table 29 Fuel cell MarketBy Type, Revenue & Volume,By Electro-galvanic fuel cell, 2023-2030 ($)
Table 30 Fuel cell MarketBy Type, Revenue & Volume,By Zinc-air battery, 2023-2030 ($)
Table 31 Fuel cell Market, Revenue & Volume,By Usage, 2023-2030 ($)
Table 32 Fuel cell MarketBy Usage, Revenue & Volume,By Electronics, 2023-2030 ($)
Table 33 Fuel cell MarketBy Usage, Revenue & Volume,By Automobiles, 2023-2030 ($)
Table 34 Fuel cell MarketBy Usage, Revenue & Volume,By Lifts, 2023-2030 ($)
Table 35 Fuel cell MarketBy Usage, Revenue & Volume,By Boats, 2023-2030 ($)
Table 36 Fuel cell MarketBy Usage, Revenue & Volume,By Food preservation, 2023-2030 ($)
Table 37 North America Fuel cell Market, Revenue & Volume,By Type, 2023-2030 ($)
Table 38 North America Fuel cell Market, Revenue & Volume,By Usage, 2023-2030 ($)
Table 39 South america Fuel cell Market, Revenue & Volume,By Type, 2023-2030 ($)
Table 40 South america Fuel cell Market, Revenue & Volume,By Usage, 2023-2030 ($)
Table 41 Europe Fuel cell Market, Revenue & Volume,By Type, 2023-2030 ($)
Table 42 Europe Fuel cell Market, Revenue & Volume,By Usage, 2023-2030 ($)
Table 43 APAC Fuel cell Market, Revenue & Volume,By Type, 2023-2030 ($)
Table 44 APAC Fuel cell Market, Revenue & Volume,By Usage, 2023-2030 ($)
Table 45 Middle East & Africa Fuel cell Market, Revenue & Volume,By Type, 2023-2030 ($)
Table 46 Middle East & Africa Fuel cell Market, Revenue & Volume,By Usage, 2023-2030 ($)
Table 47 Russia Fuel cell Market, Revenue & Volume,By Type, 2023-2030 ($)
Table 48 Russia Fuel cell Market, Revenue & Volume,By Usage, 2023-2030 ($)
Table 49 Israel Fuel cell Market, Revenue & Volume,By Type, 2023-2030 ($)
Table 50 Israel Fuel cell Market, Revenue & Volume,By Usage, 2023-2030 ($)
Table 51 Top Companies 2023 (US$)Fuel cell Market, Revenue & Volume,,
Table 52 Product Launch 2023-2030Fuel cell Market, Revenue & Volume,,
Table 53 Mergers & Acquistions 2023-2030Fuel cell Market, Revenue & Volume,,
List of Figures
Figure 1 Overview of Fuel cell Market 2023-2030
Figure 2 Market Share Analysis for Fuel cell Market 2023 (US$)
Figure 3 Product Comparison in Fuel cell Market 2023-2030 (US$)
Figure 4 End User Profile for Fuel cell Market 2023-2030 (US$)
Figure 5 Patent Application and Grant in Fuel cell Market 2013-2023* (US$)
Figure 6 Top 5 Companies Financial Analysis in Fuel cell Market 2023-2030 (US$)
Figure 7 Market Entry Strategy in Fuel cell Market 2023-2030
Figure 8 Ecosystem Analysis in Fuel cell Market2023
Figure 9 Average Selling Price in Fuel cell Market 2023-2030
Figure 10 Top Opportunites in Fuel cell Market 2023-2030
Figure 11 Market Life Cycle Analysis in Fuel cell Market
Figure 12 GlobalBy TypeFuel cell Market Revenue, 2023-2030 ($)
Figure 13 GlobalBy UsageFuel cell Market Revenue, 2023-2030 ($)
Figure 14 Global Fuel cell Market - By Geography
Figure 15 Global Fuel cell Market Value & Volume, By Geography, 2023-2030 ($)
Figure 16 Global Fuel cell Market CAGR, By Geography, 2023-2030 (%)
Figure 17 North America Fuel cell Market Value & Volume, 2023-2030 ($)
Figure 18 US Fuel cell Market Value & Volume, 2023-2030 ($)
Figure 19 US GDP and Population, 2023-2030 ($)
Figure 20 US GDP – Composition of 2023, By Sector of Origin
Figure 21 US Export and Import Value & Volume, 2023-2030 ($)
Figure 22 Canada Fuel cell Market Value & Volume, 2023-2030 ($)
Figure 23 Canada GDP and Population, 2023-2030 ($)
Figure 24 Canada GDP – Composition of 2023, By Sector of Origin
Figure 25 Canada Export and Import Value & Volume, 2023-2030 ($)
Figure 26 Mexico Fuel cell Market Value & Volume, 2023-2030 ($)
Figure 27 Mexico GDP and Population, 2023-2030 ($)
Figure 28 Mexico GDP – Composition of 2023, By Sector of Origin
Figure 29 Mexico Export and Import Value & Volume, 2023-2030 ($)
Figure 30 South America Fuel cell MarketSouth America 3D Printing Market Value & Volume, 2023-2030 ($)
Figure 31 Brazil Fuel cell Market Value & Volume, 2023-2030 ($)
Figure 32 Brazil GDP and Population, 2023-2030 ($)
Figure 33 Brazil GDP – Composition of 2023, By Sector of Origin
Figure 34 Brazil Export and Import Value & Volume, 2023-2030 ($)
Figure 35 Venezuela Fuel cell Market Value & Volume, 2023-2030 ($)
Figure 36 Venezuela GDP and Population, 2023-2030 ($)
Figure 37 Venezuela GDP – Composition of 2023, By Sector of Origin
Figure 38 Venezuela Export and Import Value & Volume, 2023-2030 ($)
Figure 39 Argentina Fuel cell Market Value & Volume, 2023-2030 ($)
Figure 40 Argentina GDP and Population, 2023-2030 ($)
Figure 41 Argentina GDP – Composition of 2023, By Sector of Origin
Figure 42 Argentina Export and Import Value & Volume, 2023-2030 ($)
Figure 43 Ecuador Fuel cell Market Value & Volume, 2023-2030 ($)
Figure 44 Ecuador GDP and Population, 2023-2030 ($)
Figure 45 Ecuador GDP – Composition of 2023, By Sector of Origin
Figure 46 Ecuador Export and Import Value & Volume, 2023-2030 ($)
Figure 47 Peru Fuel cell Market Value & Volume, 2023-2030 ($)
Figure 48 Peru GDP and Population, 2023-2030 ($)
Figure 49 Peru GDP – Composition of 2023, By Sector of Origin
Figure 50 Peru Export and Import Value & Volume, 2023-2030 ($)
Figure 51 Colombia Fuel cell Market Value & Volume, 2023-2030 ($)
Figure 52 Colombia GDP and Population, 2023-2030 ($)
Figure 53 Colombia GDP – Composition of 2023, By Sector of Origin
Figure 54 Colombia Export and Import Value & Volume, 2023-2030 ($)
Figure 55 Costa Rica Fuel cell MarketCosta Rica 3D Printing Market Value & Volume, 2023-2030 ($)
Figure 56 Costa Rica GDP and Population, 2023-2030 ($)
Figure 57 Costa Rica GDP – Composition of 2023, By Sector of Origin
Figure 58 Costa Rica Export and Import Value & Volume, 2023-2030 ($)
Figure 59 Europe Fuel cell Market Value & Volume, 2023-2030 ($)
Figure 60 U.K Fuel cell Market Value & Volume, 2023-2030 ($)
Figure 61 U.K GDP and Population, 2023-2030 ($)
Figure 62 U.K GDP – Composition of 2023, By Sector of Origin
Figure 63 U.K Export and Import Value & Volume, 2023-2030 ($)
Figure 64 Germany Fuel cell Market Value & Volume, 2023-2030 ($)
Figure 65 Germany GDP and Population, 2023-2030 ($)
Figure 66 Germany GDP – Composition of 2023, By Sector of Origin
Figure 67 Germany Export and Import Value & Volume, 2023-2030 ($)
Figure 68 Italy Fuel cell Market Value & Volume, 2023-2030 ($)
Figure 69 Italy GDP and Population, 2023-2030 ($)
Figure 70 Italy GDP – Composition of 2023, By Sector of Origin
Figure 71 Italy Export and Import Value & Volume, 2023-2030 ($)
Figure 72 France Fuel cell Market Value & Volume, 2023-2030 ($)
Figure 73 France GDP and Population, 2023-2030 ($)
Figure 74 France GDP – Composition of 2023, By Sector of Origin
Figure 75 France Export and Import Value & Volume, 2023-2030 ($)
Figure 76 Netherlands Fuel cell Market Value & Volume, 2023-2030 ($)
Figure 77 Netherlands GDP and Population, 2023-2030 ($)
Figure 78 Netherlands GDP – Composition of 2023, By Sector of Origin
Figure 79 Netherlands Export and Import Value & Volume, 2023-2030 ($)
Figure 80 Belgium Fuel cell Market Value & Volume, 2023-2030 ($)
Figure 81 Belgium GDP and Population, 2023-2030 ($)
Figure 82 Belgium GDP – Composition of 2023, By Sector of Origin
Figure 83 Belgium Export and Import Value & Volume, 2023-2030 ($)
Figure 84 Spain Fuel cell Market Value & Volume, 2023-2030 ($)
Figure 85 Spain GDP and Population, 2023-2030 ($)
Figure 86 Spain GDP – Composition of 2023, By Sector of Origin
Figure 87 Spain Export and Import Value & Volume, 2023-2030 ($)
Figure 88 Denmark Fuel cell Market Value & Volume, 2023-2030 ($)
Figure 89 Denmark GDP and Population, 2023-2030 ($)
Figure 90 Denmark GDP – Composition of 2023, By Sector of Origin
Figure 91 Denmark Export and Import Value & Volume, 2023-2030 ($)
Figure 92 APAC Fuel cell Market Value & Volume, 2023-2030 ($)
Figure 93 China Fuel cell MarketValue & Volume, 2023-2030
Figure 94 China GDP and Population, 2023-2030 ($)
Figure 95 China GDP – Composition of 2023, By Sector of Origin
Figure 96 China Export and Import Value & Volume, 2023-2030 ($)Fuel cell MarketChina Export and Import Value & Volume, 2023-2030 ($)
Figure 97 Australia Fuel cell Market Value & Volume, 2023-2030 ($)
Figure 98 Australia GDP and Population, 2023-2030 ($)
Figure 99 Australia GDP – Composition of 2023, By Sector of Origin
Figure 100 Australia Export and Import Value & Volume, 2023-2030 ($)
Figure 101 South Korea Fuel cell Market Value & Volume, 2023-2030 ($)
Figure 102 South Korea GDP and Population, 2023-2030 ($)
Figure 103 South Korea GDP – Composition of 2023, By Sector of Origin
Figure 104 South Korea Export and Import Value & Volume, 2023-2030 ($)
Figure 105 India Fuel cell Market Value & Volume, 2023-2030 ($)
Figure 106 India GDP and Population, 2023-2030 ($)
Figure 107 India GDP – Composition of 2023, By Sector of Origin
Figure 108 India Export and Import Value & Volume, 2023-2030 ($)
Figure 109 Taiwan Fuel cell MarketTaiwan 3D Printing Market Value & Volume, 2023-2030 ($)
Figure 110 Taiwan GDP and Population, 2023-2030 ($)
Figure 111 Taiwan GDP – Composition of 2023, By Sector of Origin
Figure 112 Taiwan Export and Import Value & Volume, 2023-2030 ($)
Figure 113 Malaysia Fuel cell MarketMalaysia 3D Printing Market Value & Volume, 2023-2030 ($)
Figure 114 Malaysia GDP and Population, 2023-2030 ($)
Figure 115 Malaysia GDP – Composition of 2023, By Sector of Origin
Figure 116 Malaysia Export and Import Value & Volume, 2023-2030 ($)
Figure 117 Hong Kong Fuel cell MarketHong Kong 3D Printing Market Value & Volume, 2023-2030 ($)
Figure 118 Hong Kong GDP and Population, 2023-2030 ($)
Figure 119 Hong Kong GDP – Composition of 2023, By Sector of Origin
Figure 120 Hong Kong Export and Import Value & Volume, 2023-2030 ($)
Figure 121 Middle East & Africa Fuel cell MarketMiddle East & Africa 3D Printing Market Value & Volume, 2023-2030 ($)
Figure 122 Russia Fuel cell MarketRussia 3D Printing Market Value & Volume, 2023-2030 ($)
Figure 123 Russia GDP and Population, 2023-2030 ($)
Figure 124 Russia GDP – Composition of 2023, By Sector of Origin
Figure 125 Russia Export and Import Value & Volume, 2023-2030 ($)
Figure 126 Israel Fuel cell Market Value & Volume, 2023-2030 ($)
Figure 127 Israel GDP and Population, 2023-2030 ($)
Figure 128 Israel GDP – Composition of 2023, By Sector of Origin
Figure 129 Israel Export and Import Value & Volume, 2023-2030 ($)
Figure 130 Entropy Share, By Strategies, 2023-2030* (%)Fuel cell Market
Figure 131 Developments, 2023-2030*Fuel cell Market
Figure 132 Company 1 Fuel cell Market Net Revenue, By Years, 2023-2030* ($)
Figure 133 Company 1 Fuel cell Market Net Revenue Share, By Business segments, 2023 (%)
Figure 134 Company 1 Fuel cell Market Net Sales Share, By Geography, 2023 (%)
Figure 135 Company 2 Fuel cell Market Net Revenue, By Years, 2023-2030* ($)
Figure 136 Company 2 Fuel cell Market Net Revenue Share, By Business segments, 2023 (%)
Figure 137 Company 2 Fuel cell Market Net Sales Share, By Geography, 2023 (%)
Figure 138 Company 3Fuel cell Market Net Revenue, By Years, 2023-2030* ($)
Figure 139 Company 3Fuel cell Market Net Revenue Share, By Business segments, 2023 (%)
Figure 140 Company 3Fuel cell Market Net Sales Share, By Geography, 2023 (%)
Figure 141 Company 4 Fuel cell Market Net Revenue, By Years, 2023-2030* ($)
Figure 142 Company 4 Fuel cell Market Net Revenue Share, By Business segments, 2023 (%)
Figure 143 Company 4 Fuel cell Market Net Sales Share, By Geography, 2023 (%)
Figure 144 Company 5 Fuel cell Market Net Revenue, By Years, 2023-2030* ($)
Figure 145 Company 5 Fuel cell Market Net Revenue Share, By Business segments, 2023 (%)
Figure 146 Company 5 Fuel cell Market Net Sales Share, By Geography, 2023 (%)
Figure 147 Company 6 Fuel cell Market Net Revenue, By Years, 2023-2030* ($)
Figure 148 Company 6 Fuel cell Market Net Revenue Share, By Business segments, 2023 (%)
Figure 149 Company 6 Fuel cell Market Net Sales Share, By Geography, 2023 (%)
Figure 150 Company 7 Fuel cell Market Net Revenue, By Years, 2023-2030* ($)
Figure 151 Company 7 Fuel cell Market Net Revenue Share, By Business segments, 2023 (%)
Figure 152 Company 7 Fuel cell Market Net Sales Share, By Geography, 2023 (%)
Figure 153 Company 8 Fuel cell Market Net Revenue, By Years, 2023-2030* ($)
Figure 154 Company 8 Fuel cell Market Net Revenue Share, By Business segments, 2023 (%)
Figure 155 Company 8 Fuel cell Market Net Sales Share, By Geography, 2023 (%)
Figure 156 Company 9 Fuel cell Market Net Revenue, By Years, 2023-2030* ($)
Figure 157 Company 9 Fuel cell Market Net Revenue Share, By Business segments, 2023 (%)
Figure 158 Company 9 Fuel cell Market Net Sales Share, By Geography, 2023 (%)
Figure 159 Company 10 Fuel cell Market Net Revenue, By Years, 2023-2030* ($)
Figure 160 Company 10 Fuel cell Market Net Revenue Share, By Business segments, 2023 (%)
Figure 161 Company 10 Fuel cell Market Net Sales Share, By Geography, 2023 (%)
Figure 162 Company 11 Fuel cell Market Net Revenue, By Years, 2023-2030* ($)
Figure 163 Company 11 Fuel cell Market Net Revenue Share, By Business segments, 2023 (%)
Figure 164 Company 11 Fuel cell Market Net Sales Share, By Geography, 2023 (%)
Figure 165 Company 12 Fuel cell Market Net Revenue, By Years, 2023-2030* ($)
Figure 166 Company 12 Fuel cell Market Net Revenue Share, By Business segments, 2023 (%)
Figure 167 Company 12 Fuel cell Market Net Sales Share, By Geography, 2023 (%)
Figure 168 Company 13Fuel cell Market Net Revenue, By Years, 2023-2030* ($)
Figure 169 Company 13Fuel cell Market Net Revenue Share, By Business segments, 2023 (%)
Figure 170 Company 13Fuel cell Market Net Sales Share, By Geography, 2023 (%)
Figure 171 Company 14 Fuel cell Market Net Revenue, By Years, 2023-2030* ($)
Figure 172 Company 14 Fuel cell Market Net Revenue Share, By Business segments, 2023 (%)
Figure 173 Company 14 Fuel cell Market Net Sales Share, By Geography, 2023 (%)
Figure 174 Company 15 Fuel cell Market Net Revenue, By Years, 2023-2030* ($)
Figure 175 Company 15 Fuel cell Market Net Revenue Share, By Business segments, 2023 (%)
Figure 176 Company 15 Fuel cell Market Net Sales Share, By Geography, 2023 (%)