Database Encryption Market - Forecast(2023 - 2028)

Report Code: ITR 0030 Report Format: PDF + Excel

Database Encryption Market Overview

Database Encryption Market size is forecast to reach $3,445 million by 2025, estimated to grow at a CAGR of 25.5% during 2021-2026. Database encryption technology is based on algorithms that is used to transform the data in cipher text, which is used to protect the data from accessing by third party. Transparent data encryption technology is asymmetric key secured encryption method used to encrypt data and log files. TDE encrypts SQL server Azure SQL Database, and Azure SQL Data warehouse files, known as encrypting data at rest. This technology is employed by Microsoft, IBM and oracle, to deal with the most critical to those threats to which data is vulnerable. The use of comprehensive mobile devices and the need for technology in several organizations are fueling the demand for database encryption. In addition, the growing usage of database encryption for applications including communication encryption, disk encryption, cloud encryption, file and folder encryption and others are tremendously boosting the database encryption market size during the forecast period 2021-2026.

Report Coverage

The report: “Database Encryption Market Forecast (2021-2026)”, by IndustryARC, covers an in-depth analysis of the following segments of the Database Encryption Market.

By Objective: Secrecy & Authenticity
By Threats: External Threats (Hackers Breach), Internal Threats (Confidential Information), and Physical Threats (Thieves Strike)
By Encryption Method: Hashing, Symmetric Method (Transparent data encryption) and Asymmetric Method
By Type: File-System Encryption, DBMS-Level Encryption, Application-Level Encryption, Client-side Encryption and Indexing Encrypted Data
By Types of attack: Database operational model (Data-in-motion, Data-in-use and Data-at-rest), Attack comprising security (Intruder, Insider, Administrator, Passive Attack and Active Attack)
By Deployment Type: Public Cloud, Private Cloud and Hybrid Cloud
By Application: Business Application, Web-Application, DBMS users
By End-user: Government, Public Sector, Military & Defense, Aerospace, Retail and E-commerce and others
By Geography: North America (U.S, Canada, Mexico), South America(Brazil, Argentina, Ecuador, Peru, Colombia, Costa Rica and others), Europe(Germany, UK, France, Italy, Spain, Russia, Netherlands, Denmark and Others), APAC (China, Japan India, South Korea, Australia, Taiwan, Malaysia and Others), and RoW (Middle east and Africa)

Key Takeaways

  • In 2020, the Database Encryption market was dominated by North American region owing to the presence of prominent players such as IBM, Microsoft and so on in the US and Canada.
  • The increasing data volume storage has led to the need for multi-cloud environment which is thus enhancing the demand for the cloud-based security solutions that protects the data from thieves and hackers.
  • The rising demand for physical-based security such as blockchain-based, quantum-computer-based, honey encryption, IoT product security and others for encryption are enhancing the database encryption market.
  • The rising political issues is leading to offer complex relationship to government and politics are hampering the growth of the market.

Database Encryption Market, By egion, 2020 (%)
Database Encryption Market
For more details on this report - Request for Sample

Database Encryption Market Segment Analysis – By End-user

Government segment held the largest market share in the Database Encryption market in 2020 at 22.2% share. The rising utilization of DB encryption solution by government entities and enterprises are highly enhancing the growth of the market. Also, the rising use of technology has made government sector an IT crowd which is leading to the adoption of database encryption. In addition, the regulations and compliance requirements such as health insurance portability and accountability (HIPAA) for healthcare and payment card industry data security standard (PCI DSS) has surged the growth of the database encryption market.

Database Encryption Market Segment Analysis – By Deployment Type

With rise in the adoption of IoT technologies and the usage of cloud database for computing in various organizations for different applications is analyzed to boost the Cloud Database Market. Moreover, the cloud databases provide the customers with improved performance, service resilience and so on, thereby enhancing the overall market demand for Cloud Database during the forecast period. The Cloud database market is driven primarily due to the rising usage of internet of things, cloud computing as well as rising use of Cloud database in banking and education. IOT data is complex, accessible by multiple users and many complex queries, both SQL and NoSQL implemented storage, and transactions need to be handled through IOT applications. Cloud database makes the data secure and reliable. Furthermore, Cloud database provides customers with data storage, automatic data backups and replication thereby boosting the adoption of Database encryption in public cloud at 29.2% CAGR during the forecast period 2021-2026.

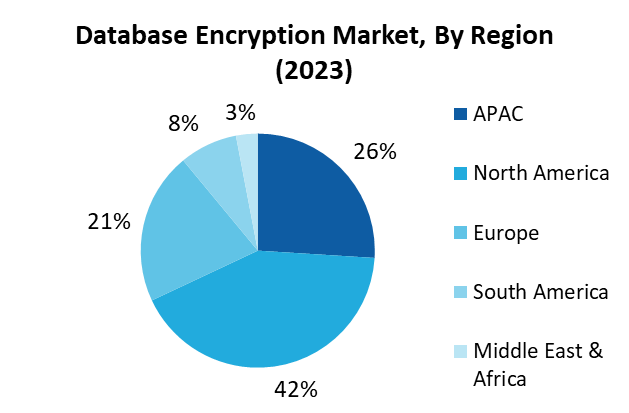
Database Encryption Market Segment Analysis – By Geography

In 2020, North America dominated the Database Encryption market with a share of more than 37.2%, followed by Europe and APAC. The presence of most prominent players in this region such as Microsoft Corporation, IBM Corporation, Intel, SAS Institute Inc., Win Magic Inc. and EMC Corporation are fueling the growth of the market. Additionally, in the US most of the small and medium sized enterprises are integrating technology which is leading to the requirement of efficient database encryption software. Also, the development by the US-based companies in order to provide cost-effective products is enhancing the growth of the market in this region. 

Database Encryption Market Drivers

Growing demand for Cloud-based security

As the data volume storage is increasing exponentially the demand for hybrid multi-cloud environment is also rising. Most of the organizations are facing high number of regulations to follow, due to increased exposure to data ransomware, theft and misuse. In addition, most of the regulations such as General Data Protection Regulation, highlight encryption provide technical and organizational measures. This has also led to the development of data encryption strategy which helps to keep businesses the demand for cloud-based security solution which leads to the acceleration of database encryption market. 

The rise of Physical-based security

The deployment of encryption has become the future which has also led to the rise of physical-based security such as blockchain-based, quantum-computer-based, honey encryption, IoT product security and among others. The resurgence of keeping the private and personal information off of the computers in the organization is enhancing the demand for the database encryption market. Moreover, the use of hardware wallets for cryptocurrencies and the need to determine the data thieves are also surging the growth of the market.

Database Encryption Market Challenges

Rising Political Issues

The technology industry is growing at a fast pace which is leading to the formation of complex relationship between government and politics. This is also majorly affecting three areas such as privacy and surveillance, censorship, general economic regulation and other competition management. The big tech companies are therefore unable to comply with the laws and regulations and fail to decrypt particular kinds of data. This majorly hinders the adoption of database encryption by big-tech companies.

Database Encryption Market Landscape

Technology launches, acquisitions and R&D activities are key strategies adopted by players in the Database Encryption market. In 2019, the market of Database Encryption has been consolidated by the major players – IBM Corporation, Post-Quantum, Engimedia, Penta Security Systems, Symantec Corporation, Netapp, Inc., Microsoft Corporation, Hewlett-Packard Company, Oracle Corporation, Intel Security (Mcafee) and among others.

Acquisitions/Technology Launches

  • In November 2019, Penta Security Systems announced that the company has been nominated as a finalist for SC Magazine Awards for 2020 honored in the U.S, presented by SC Media. This has led to the recognition of Penta Security’s MyDiamo as the Best Database Security Solution of the year 2020. This will also lead to the expansion of common-level encryption, and provide enhanced installation process for open-source DBMS. 

Related Reports:

Transparent Data Encryption (TDE) Technology Market - Forecast(2021 - 2026)
Report Code: ITR 0192

Cloud Database Market - Forecast(2021 - 2026)
Report Code: ITR 57235

For more Information and Communications Technology related reports, please click here


1. Database Encryption Market - Overview
    1.1. Definitions and Scope
2. Database Encryption Market - Executive summary
    2.1. Market Revenue, Market Size and Key Trends by Company
    2.2. Key Trends by type of Application
    2.3. Key Trends segmented by Geography
3. Database Encryption Market 
    3.1. Comparative analysis
        3.1.1. Product Benchmarking - Top 10 companies
        3.1.2. Top 5 Financials Analysis
        3.1.3. Market Value split by Top 10 companies
        3.1.4. Patent Analysis - Top 10 companies
        3.1.5. Pricing Analysis 
4. Database Encryption Market – Startup companies Scenario Premium Premium
    4.1. Top 10 startup company Analysis by
        4.1.1. Investment
        4.1.2. Revenue
        4.1.3. Market Shares
        4.1.4. Market Size and Application Analysis
        4.1.5. Venture Capital and Funding Scenario
5. Database Encryption Market – Industry Market Entry Scenario Premium Premium
    5.1. Regulatory Framework Overview
    5.2. New Business and Ease of Doing business index
    5.3. Case studies of successful ventures
    5.4. Customer Analysis – Top 10 companies
6. Database Encryption Market Forces
    6.1. Drivers
    6.2. Constraints
    6.3. Challenges
    6.4. Porters five force model
        6.4.1. Bargaining power of suppliers
        6.4.2. Bargaining powers of customers
        6.4.3. Threat of new entrants
        6.4.4. Rivalry among existing players
        6.4.5. Threat of substitutes 
7. Database Encryption Market -Strategic analysis
    7.1. Value chain analysis
    7.2. Opportunities analysis
    7.3. Product life cycle
    7.4. Suppliers and distributors Market Share
8. Database Encryption Market – By Objective (Market Size -$Million / $Billion)
    8.1. Market Size and Market Share Analysis 
    8.2. Application Revenue and Trend Research
    8.3. Product Segment Analysis
        8.3.1. Introduction
        8.3.2. Secrecy
        8.3.3. Authenticity
9. Database Encryption Market – By Threats (Market Size -$Million / $Billion)
    9.1. Introduction
    9.2. External Threats
        9.2.1. Hackers Breach
    9.3. Internal Threats
        9.3.1. Confidential Information
    9.4. Physical Threats
        9.4.1. Thieves strike
10. Database Encryption Market – By Encryption Method (Market Size -$Million / $Billion)
    10.1. Introduction
    10.2. Hashing
    10.3. Symmetric Method
        10.3.1. Transparent data encryption
    10.4. Asymmetric Method
11. Database Encryption Market – By Type (Market Size -$Million / $Billion)
    11.1. File-System Encryption
    11.2. DBMS-Level Encryption
    11.3. Application-Level Encryption
    11.4. Client-Side Encryption
    11.5. Indexing Encrypted Data
12. Database Encryption Market – By Types of Attack (Market Size -$Million / $Billion)
    12.1. Introduction
    12.2. Database operational model
        12.2.1. Data-in-motion
        12.2.2. Data-in-use
        12.2.3. Data-at-rest
    12.3. Attack comprising security
        12.3.1. Intruder
        12.3.2. Insider
        12.3.3. Administrator
        12.3.4. Passive Attack
            12.3.4.1. Static leakage
            12.3.4.2. Linkage leakage
            12.3.4.3. Dynamic leakage
        12.3.5. Active Attack
            12.3.5.1. Spoofing
            12.3.5.2. Splicing
            12.3.5.3. Replay
13. Database Encryption Market – By Development Type (Market Size -$Million / $Billion)
    13.1. Public Cloud
    13.2. Private Cloud
    13.3. Hybrid Cloud
14. Database Encryption Market – By Application (Market Size -$Million / $Billion)
    14.1. Business application
    14.2. Web application
    14.3. DBMS users
15. Database Encryption – By End users(Market Size -$Million / $Billion)
    15.1. Segment type Size and Market Share Analysis 
    15.2. Application Revenue and Trends by type of Application
    15.3. Application Segment Analysis by Type
        15.3.1. Introduction
        15.3.2. Government
        15.3.3. Public sector
        15.3.4. Military and Defense
        15.3.5. Aerospace
        15.3.6. Retail and E-commerce
        15.3.7. Others
16. Database Encryption - By Geography (Market Size -$Million / $Billion)
    16.1. Database Encryption Market - North America Segment Research
    16.2. North America Market Research (Million / $Billion)
        16.2.1. Segment type Size and Market Size Analysis 
        16.2.2. Revenue and Trends
        16.2.3. Application Revenue and Trends by type of Application
        16.2.4. Company Revenue and Product Analysis
        16.2.5. North America Product type and Application Market Size
            16.2.5.1. U.S.
            16.2.5.2. Canada 
            16.2.5.3. Mexico 
            16.2.5.4. Rest of North America
    16.3. Database Encryption - South America Segment Research
    16.4. South America Market Research (Market Size -$Million / $Billion)
        16.4.1. Segment type Size and Market Size Analysis 
        16.4.2. Revenue and Trends
        16.4.3. Application Revenue and Trends by type of Application
        16.4.4. Company Revenue and Product Analysis
        16.4.5. South America Product type and Application Market Size
            16.4.5.1. Brazil  
            16.4.5.2. Venezuela
            16.4.5.3. Argentina
            16.4.5.4. Ecuador
            16.4.5.5. Peru
            16.4.5.6. Colombia 
            16.4.5.7. Costa Rica
            16.4.5.8. Rest of South America
    16.5. Database Encryption - Europe Segment Research
    16.6. Europe Market Research (Market Size -$Million / $Billion)
        16.6.1. Segment type Size and Market Size Analysis 
        16.6.2. Revenue and Trends
        16.6.3. Application Revenue and Trends by type of Application
        16.6.4. Company Revenue and Product Analysis
        16.6.5. Europe Segment Product type and Application Market Size
            16.6.5.1. U.K  
            16.6.5.2. Germany 
            16.6.5.3. Italy 
            16.6.5.4. France
            16.6.5.5. Netherlands
            16.6.5.6. Belgium
            16.6.5.7. Spain
            16.6.5.8. Denmark
            16.6.5.9. Rest of Europe
    16.7. Database Encryption – APAC Segment Research
    16.8. APAC Market Research (Market Size -$Million / $Billion)
        16.8.1. Segment type Size and Market Size Analysis 
        16.8.2. Revenue and Trends
        16.8.3. Application Revenue and Trends by type of Application
        16.8.4. Company Revenue and Product Analysis
        16.8.5. APAC Segment – Product type and Application Market Size
            16.8.5.1. China 
            16.8.5.2. Australia
            16.8.5.3. Japan 
            16.8.5.4. South Korea
            16.8.5.5. India
            16.8.5.6. Taiwan
            16.8.5.7. Malaysia
17. Database Encryption Market - Entropy
    17.1. New product launches
    17.2. M&A's, collaborations, JVs and partnerships
18. Database Encryption Market – Industry / Segment Competition landscape Premium Premium
    18.1. Market Share Analysis
        18.1.1. Market Share by Country- Top companies
        18.1.2. Market Share by Region- Top 10 companies
        18.1.3. Market Share by type of Application – Top 10 companies
        18.1.4. Market Share by type of Product / Product category- Top 10 companies
        18.1.5. Market Share at global level- Top 10 companies
        18.1.6. Best Practises for companies
19. Database Encryption Market – Key Company List by Country Premium Premium
20. Database Encryption Market Company Analysis
    20.1. Market Share, Company Revenue, Products, M&A, Developments
    20.2. IBM
    20.3. Post-Quantum
    20.4. Enigmedia
    20.5. Penta Security
    20.6. Crypto Move
    20.7. Data Motion
    20.8. Echoworx
    20.9. ENC security
    20.10. FinalCode
    20.11. Company 10
"*Financials would be provided on a best efforts basis for private companies"
List of Tables

Table 1: Database Encryption Market Overview 2021-2026
Table 2: Database Encryption Market Leader Analysis 2018-2019 (US$)
Table 3: Database Encryption Market Product Analysis 2018-2019 (US$)
Table 4: Database Encryption Market End User Analysis 2018-2019 (US$)
Table 5: Database Encryption Market Patent Analysis 2013-2018* (US$)
Table 6: Database Encryption Market Financial Analysis 2018-2019 (US$)
Table 7: Database Encryption Market Driver Analysis 2018-2019 (US$)
Table 8: Database Encryption Market Challenges Analysis 2018-2019 (US$)
Table 9: Database Encryption Market Constraint Analysis 2018-2019 (US$)
Table 10: Database Encryption Market Supplier Bargaining Power Analysis 2018-2019 (US$)
Table 11: Database Encryption Market Buyer Bargaining Power Analysis 2018-2019 (US$)
Table 12: Database Encryption Market Threat of Substitutes Analysis 2018-2019 (US$)
Table 13: Database Encryption Market Threat of New Entrants Analysis 2018-2019 (US$)
Table 14: Database Encryption Market Degree of Competition Analysis 2018-2019 (US$)
Table 15: Database Encryption Market Value Chain Analysis 2018-2019 (US$)
Table 16: Database Encryption Market Pricing Analysis 2021-2026 (US$)
Table 17: Database Encryption Market Opportunities Analysis 2021-2026 (US$)
Table 18: Database Encryption Market Product Life Cycle Analysis 2021-2026 (US$)
Table 19: Database Encryption Market Supplier Analysis 2018-2019 (US$)
Table 20: Database Encryption Market Distributor Analysis 2018-2019 (US$)
Table 21: Database Encryption Market Trend Analysis 2018-2019 (US$)
Table 22: Database Encryption Market Size 2018 (US$)
Table 23: Database Encryption Market Forecast Analysis 2021-2026 (US$)
Table 24: Database Encryption Market Sales Forecast Analysis 2021-2026 (Units)
Table 25: Database Encryption Market, Revenue & Volume,By Type, 2021-2026 ($)
Table 26: Database Encryption Market By Type, Revenue & Volume,By Data Encryption Type, 2021-2026 ($)
Table 27: Database Encryption Market By Type, Revenue & Volume,By Transparent/External Database Encryption, 2021-2026 ($)
Table 28: Database Encryption Market By Type, Revenue & Volume,By File System Encryption, 2021-2026 ($)
Table 29: Database Encryption Market By Type, Revenue & Volume,By Key Management, 2021-2026 ($)
Table 30: Database Encryption Market By Type, Revenue & Volume,By Database Operational Models, 2021-2026 ($)
Table 31: Database Encryption Market, Revenue & Volume,By Deployement Type, 2021-2026 ($)
Table 32: Database Encryption Market By Deployement Type, Revenue & Volume,By Introduction, 2021-2026 ($)
Table 33: Database Encryption Market By Deployement Type, Revenue & Volume,By On-Premises, 2021-2026 ($)
Table 34: Database Encryption Market By Deployement Type, Revenue & Volume,By Cloud, 2021-2026 ($)
Table 35: Database Encryption Market, Revenue & Volume,By Application, 2021-2026 ($)
Table 36: Database Encryption Market By Application, Revenue & Volume,By Introduction, 2021-2026 ($)
Table 37: Database Encryption Market By Application, Revenue & Volume,By BFSI, 2021-2026 ($)
Table 38: Database Encryption Market By Application, Revenue & Volume,By Healthcare, 2021-2026 ($)
Table 39: Database Encryption Market By Application, Revenue & Volume,By Government and Public Sector, 2021-2026 ($)
Table 40: Database Encryption Market By Application, Revenue & Volume,By Retail and E-Commerce, 2021-2026 ($)
Table 41: North America Database Encryption Market, Revenue & Volume,By Type, 2021-2026 ($)
Table 42: North America Database Encryption Market, Revenue & Volume,By Deployement Type, 2021-2026 ($)
Table 43: North America Database Encryption Market, Revenue & Volume,By Application, 2021-2026 ($)
Table 44: South america Database Encryption Market, Revenue & Volume,By Type, 2021-2026 ($)
Table 45: South america Database Encryption Market, Revenue & Volume,By Deployement Type, 2021-2026 ($)
Table 46: South america Database Encryption Market, Revenue & Volume,By Application, 2021-2026 ($)
Table 47: Europe Database Encryption Market, Revenue & Volume,By Type, 2021-2026 ($)
Table 48: Europe Database Encryption Market, Revenue & Volume,By Deployement Type, 2021-2026 ($)
Table 49: Europe Database Encryption Market, Revenue & Volume,By Application, 2021-2026 ($)
Table 50: APAC Database Encryption Market, Revenue & Volume,By Type, 2021-2026 ($)
Table 51: APAC Database Encryption Market, Revenue & Volume,By Deployement Type, 2021-2026 ($)
Table 52: APAC Database Encryption Market, Revenue & Volume,By Application, 2021-2026 ($)
Table 53: Middle East & Africa Database Encryption Market, Revenue & Volume,By Type, 2021-2026 ($)
Table 54: Middle East & Africa Database Encryption Market, Revenue & Volume,By Deployement Type, 2021-2026 ($)
Table 55: Middle East & Africa Database Encryption Market, Revenue & Volume,By Application, 2021-2026 ($)
Table 56: Russia Database Encryption Market, Revenue & Volume,By Type, 2021-2026 ($)
Table 57: Russia Database Encryption Market, Revenue & Volume,By Deployement Type, 2021-2026 ($)
Table 58: Russia Database Encryption Market, Revenue & Volume,By Application, 2021-2026 ($)
Table 59: Israel Database Encryption Market, Revenue & Volume,By Type, 2021-2026 ($)
Table 60: Israel Database Encryption Market, Revenue & Volume,By Deployement Type, 2021-2026 ($)
Table 61: Israel Database Encryption Market, Revenue & Volume,By Application, 2021-2026 ($)
Table 62: Top Companies 2018 (US$)Database Encryption Market, Revenue & Volume
Table 63: Product Launch 2018-2019Database Encryption Market, Revenue & Volume
Table 64: Mergers & Acquistions 2018-2019Database Encryption Market, Revenue & Volume

List of Figures

Figure 1: Overview of Database Encryption Market 2021-2026
Figure 2: Market Share Analysis for Database Encryption Market 2018 (US$)
Figure 3: Product Comparison in Database Encryption Market 2018-2019 (US$)
Figure 4: End User Profile for Database Encryption Market 2018-2019 (US$)
Figure 5: Patent Application and Grant in Database Encryption Market 2013-2018* (US$)
Figure 6: Top 5 Companies Financial Analysis in Database Encryption Market 2018-2019 (US$)
Figure 7: Market Entry Strategy in Database Encryption Market 2018-2019
Figure 8: Ecosystem Analysis in Database Encryption Market 2018
Figure 9: Average Selling Price in Database Encryption Market 2021-2026
Figure 10: Top Opportunites in Database Encryption Market 2018-2019
Figure 11: Market Life Cycle Analysis in Database Encryption Market
Figure 12: GlobalBy TypeDatabase Encryption Market Revenue, 2021-2026 ($)
Figure 13: GlobalBy Deployement TypeDatabase Encryption Market Revenue, 2021-2026 ($)
Figure 14: GlobalBy ApplicationDatabase Encryption Market Revenue, 2021-2026 ($)
Figure 15: Global Database Encryption Market - By Geography
Figure 16: Global Database Encryption Market Value & Volume, By Geography, 2021-2026 ($) 
Figure 17: Global Database Encryption Market CAGR, By Geography, 2021-2026 (%)
Figure 18: North America Database Encryption Market Value & Volume, 2021-2026 ($)
Figure 19: US Database Encryption Market Value & Volume, 2021-2026 ($)
Figure 20: US GDP and Population, 2018-2019 ($)
Figure 21: US GDP – Composition of 2018, By Sector of Origin
Figure 22: US Export and Import Value & Volume, 2018-2019 ($)
Figure 23: Canada Database Encryption Market Value & Volume, 2021-2026 ($)
Figure 24: Canada GDP and Population, 2018-2019 ($)
Figure 25: Canada GDP – Composition of 2018, By Sector of Origin
Figure 26: Canada Export and Import Value & Volume, 2018-2019 ($)
Figure 27: Mexico Database Encryption Market Value & Volume, 2021-2026 ($)
Figure 28: Mexico GDP and Population, 2018-2019 ($)
Figure 29: Mexico GDP – Composition of 2018, By Sector of Origin
Figure 30: Mexico Export and Import Value & Volume, 2018-2019 ($)
Figure 31: South America Database Encryption Market Value & Volume, 2021-2026 ($)
Figure 32: Brazil Database Encryption Market Value & Volume, 2021-2026 ($)
Figure 33: Brazil GDP and Population, 2018-2019 ($)
Figure 34: Brazil GDP – Composition of 2018, By Sector of Origin
Figure 35: Brazil Export and Import Value & Volume, 2018-2019 ($)
Figure 36: Venezuela Database Encryption Market Value & Volume, 2021-2026 ($)
Figure 37: Venezuela GDP and Population, 2018-2019 ($)
Figure 38: Venezuela GDP – Composition of 2018, By Sector of Origin
Figure 39: Venezuela Export and Import Value & Volume, 2018-2019 ($)
Figure 40: Argentina Database Encryption Market Value & Volume, 2021-2026 ($)
Figure 41: Argentina GDP and Population, 2018-2019 ($)
Figure 42: Argentina GDP – Composition of 2018, By Sector of Origin
Figure 43: Argentina Export and Import Value & Volume, 2018-2019 ($)
Figure 44: Ecuador Database Encryption Market Value & Volume, 2021-2026 ($)
Figure 45: Ecuador GDP and Population, 2018-2019 ($)
Figure 46: Ecuador GDP – Composition of 2018, By Sector of Origin
Figure 47: Ecuador Export and Import Value & Volume, 2018-2019 ($)
Figure 48: Peru Database Encryption Market Value & Volume, 2021-2026 ($)
Figure 49: Peru GDP and Population, 2018-2019 ($)
Figure 50: Peru GDP – Composition of 2018, By Sector of Origin
Figure 51: Peru Export and Import Value & Volume, 2018-2019 ($)
Figure 52: Colombia Database Encryption Market Value & Volume, 2021-2026 ($)
Figure 53: Colombia GDP and Population, 2018-2019 ($)
Figure 54: Colombia GDP – Composition of 2018, By Sector of Origin
Figure 55: Colombia Export and Import Value & Volume, 2018-2019 ($)
Figure 56: Costa Rica Database Encryption Market Value & Volume, 2021-2026 ($)
Figure 57: Costa Rica GDP and Population, 2018-2019 ($)
Figure 58: Costa Rica GDP – Composition of 2018, By Sector of Origin
Figure 59: Costa Rica Export and Import Value & Volume, 2018-2019 ($)
Figure 60: Europe Database Encryption Market Value & Volume, 2021-2026 ($)
Figure 61: U.K Database Encryption Market Value & Volume, 2021-2026 ($)
Figure 62: U.K GDP and Population, 2018-2019 ($)
Figure 63: U.K GDP – Composition of 2018, By Sector of Origin
Figure 64: U.K Export and Import Value & Volume, 2018-2019 ($)
Figure 65: Germany Database Encryption Market Value & Volume, 2021-2026 ($)
Figure 66: Germany GDP and Population, 2018-2019 ($)
Figure 67: Germany GDP – Composition of 2018, By Sector of Origin
Figure 68: Germany Export and Import Value & Volume, 2018-2019 ($)
Figure 69: Italy Database Encryption Market Value & Volume, 2021-2026 ($)
Figure 70: Italy GDP and Population, 2018-2019 ($)
Figure 71: Italy GDP – Composition of 2018, By Sector of Origin
Figure 72: Italy Export and Import Value & Volume, 2018-2019 ($)
Figure 73: France Database Encryption Market Value & Volume, 2021-2026 ($)
Figure 74: France GDP and Population, 2018-2019 ($)
Figure 75: France GDP – Composition of 2018, By Sector of Origin
Figure 76: France Export and Import Value & Volume, 2018-2019 ($)
Figure 77: Netherlands Database Encryption Market Value & Volume, 2021-2026 ($)
Figure 78: Netherlands GDP and Population, 2018-2019 ($)
Figure 79: Netherlands GDP – Composition of 2018, By Sector of Origin
Figure 80: Netherlands Export and Import Value & Volume, 2018-2019 ($)
Figure 81: Belgium Database Encryption Market Value & Volume, 2021-2026 ($)
Figure 82: Belgium GDP and Population, 2018-2019 ($)
Figure 83: Belgium GDP – Composition of 2018, By Sector of Origin
Figure 84: Belgium Export and Import Value & Volume, 2018-2019 ($)
Figure 85: Spain Database Encryption Market Value & Volume, 2021-2026 ($)
Figure 86: Spain GDP and Population, 2018-2019 ($)
Figure 87: Spain GDP – Composition of 2018, By Sector of Origin
Figure 88: Spain Export and Import Value & Volume, 2018-2019 ($)
Figure 89: Denmark Database Encryption Market Value & Volume, 2021-2026 ($)
Figure 90: Denmark GDP and Population, 2018-2019 ($)
Figure 91: Denmark GDP – Composition of 2018, By Sector of Origin
Figure 92: Denmark Export and Import Value & Volume, 2018-2019 ($)
Figure 93: APAC Database Encryption Market Value & Volume, 2021-2026 ($)
Figure 94: China Database Encryption Market Value & Volume, 2021-2026
Figure 95: China GDP and Population, 2018-2019 ($)
Figure 96: China GDP – Composition of 2018, By Sector of Origin
Figure 97: China Export and Import Value & Volume, 2018-2019 ($)Database Encryption Market China Export and Import Value & Volume, 2018-2019 ($)
Figure 98: Australia Database Encryption Market Value & Volume, 2021-2026 ($)
Figure 99: Australia GDP and Population, 2018-2019 ($)
Figure 100: Australia GDP – Composition of 2018, By Sector of Origin
Figure 101: Australia Export and Import Value & Volume, 2018-2019 ($)
Figure 102: South Korea Database Encryption Market Value & Volume, 2021-2026 ($)
Figure 103: South Korea GDP and Population, 2018-2019 ($)
Figure 104: South Korea GDP – Composition of 2018, By Sector of Origin
Figure 105: South Korea Export and Import Value & Volume, 2018-2019 ($)
Figure 106: India Database Encryption Market Value & Volume, 2021-2026 ($)
Figure 107: India GDP and Population, 2018-2019 ($)
Figure 108: India GDP – Composition of 2018, By Sector of Origin
Figure 109: India Export and Import Value & Volume, 2018-2019 ($)
Figure 110: Taiwan Database Encryption Market Value & Volume, 2021-2026 ($)
Figure 111: Taiwan GDP and Population, 2018-2019 ($)
Figure 112: Taiwan GDP – Composition of 2018, By Sector of Origin
Figure 113: Taiwan Export and Import Value & Volume, 2018-2019 ($)
Figure 114: Malaysia Database Encryption Market Value & Volume, 2021-2026 ($)
Figure 115: Malaysia GDP and Population, 2018-2019 ($)
Figure 116: Malaysia GDP – Composition of 2018, By Sector of Origin
Figure 117: Malaysia Export and Import Value & Volume, 2018-2019 ($)
Figure 118: Hong Kong Database Encryption Market Value & Volume, 2021-2026 ($)
Figure 119: Hong Kong GDP and Population, 2018-2019 ($)
Figure 120: Hong Kong GDP – Composition of 2018, By Sector of Origin
Figure 121: Hong Kong Export and Import Value & Volume, 2018-2019 ($)
Figure 122: Middle East & Africa Database Encryption Market Middle East & Africa 3D Printing Market Value & Volume, 2021-2026 ($)
Figure 123: Russia Database Encryption Market Value & Volume, 2021-2026 ($)
Figure 124: Russia GDP and Population, 2018-2019 ($)
Figure 125: Russia GDP – Composition of 2018, By Sector of Origin
Figure 126: Russia Export and Import Value & Volume, 2018-2019 ($)
Figure 127: Israel Database Encryption Market Value & Volume, 2021-2026 ($)
Figure 128: Israel GDP and Population, 2018-2019 ($)
Figure 129: Israel GDP – Composition of 2018, By Sector of Origin
Figure 130: Israel Export and Import Value & Volume, 2018-2019 ($)
Figure 131: Entropy Share, By Strategies, 2018-2019* (%)Database Encryption Market 
Figure 132: Developments, 2018-2019*Database Encryption Market 
Figure 133: Company 1 Database Encryption Market Net Revenue, By Years, 2018-2019* ($)
Figure 134: Company 1 Database Encryption Market Net Revenue Share, By Business segments, 2018 (%)
Figure 135: Company 1 Database Encryption Market Net Sales Share, By Geography, 2018 (%)
Figure 136: Company 2 Database Encryption Market Net Revenue, By Years, 2018-2019* ($)
Figure 137: Company 2 Database Encryption Market Net Revenue Share, By Business segments, 2018 (%)
Figure 138: Company 2 Database Encryption Market Net Sales Share, By Geography, 2018 (%)
Figure 139: Company 3Database Encryption Market Net Revenue, By Years, 2018-2019* ($)
Figure 140: Company 3Database Encryption Market Net Revenue Share, By Business segments, 2018 (%)
Figure 141: Company 3Database Encryption Market Net Sales Share, By Geography, 2018 (%)
Figure 142: Company 4 Database Encryption Market Net Revenue, By Years, 2018-2019* ($)
Figure 143: Company 4 Database Encryption Market Net Revenue Share, By Business segments, 2018 (%)
Figure 144: Company 4 Database Encryption Market Net Sales Share, By Geography, 2018 (%)
Figure 145: Company 5 Database Encryption Market Net Revenue, By Years, 2018-2019* ($)
Figure 146: Company 5 Database Encryption Market Net Revenue Share, By Business segments, 2018 (%)
Figure 147: Company 5 Database Encryption Market Net Sales Share, By Geography, 2018 (%)
Figure 148: Company 6 Database Encryption Market Net Revenue, By Years, 2018-2019* ($)
Figure 149: Company 6 Database Encryption Market Net Revenue Share, By Business segments, 2018 (%)
Figure 150: Company 6 Database Encryption Market Net Sales Share, By Geography, 2018 (%)
Figure 151: Company 7 Database Encryption Market Net Revenue, By Years, 2018-2019* ($)
Figure 152: Company 7 Database Encryption Market Net Revenue Share, By Business segments, 2018 (%)
Figure 153: Company 7 Database Encryption Market Net Sales Share, By Geography, 2018 (%)
Figure 154: Company 8 Database Encryption Market Net Revenue, By Years, 2018-2019* ($)
Figure 155: Company 8 Database Encryption Market Net Revenue Share, By Business segments, 2018 (%)
Figure 156: Company 8 Database Encryption Market Net Sales Share, By Geography, 2018 (%)
Figure 157: Company 9 Database Encryption Market Net Revenue, By Years, 2018-2019* ($)
Figure 158: Company 9 Database Encryption Market Net Revenue Share, By Business segments, 2018 (%)
Figure 159: Company 9 Database Encryption Market Net Sales Share, By Geography, 2018 (%)
Figure 160: Company 10 Database Encryption Market Net Revenue, By Years, 2018-2019* ($)
Figure 161: Company 10 Database Encryption Market Net Revenue Share, By Business segments, 2018 (%)
Figure 162: Company 10 Database Encryption Market Net Sales Share, By Geography, 2018 (%)
Figure 163: Company 11 Database Encryption Market Net Revenue, By Years, 2018-2019* ($)
Figure 164: Company 11 Database Encryption Market Net Revenue Share, By Business segments, 2018 (%)
Figure 165: Company 11 Database Encryption Market Net Sales Share, By Geography, 2018 (%)
Figure 166: Company 12 Database Encryption Market Net Revenue, By Years, 2018-2019* ($)
Figure 167: Company 12 Database Encryption Market Net Revenue Share, By Business segments, 2018 (%)
Figure 168: Company 12 Database Encryption Market Net Sales Share, By Geography, 2018 (%)
Figure 169: Company 13Database Encryption Market Net Revenue, By Years, 2018-2019* ($)
Figure 170: Company 13Database Encryption Market Net Revenue Share, By Business segments, 2018 (%)
Figure 171: Company 13Database Encryption Market Net Sales Share, By Geography, 2018 (%)
Figure 172: Company 14 Database Encryption Market Net Revenue, By Years, 2018-2019* ($)
Figure 173: Company 14 Database Encryption Market Net Revenue Share, By Business segments, 2018 (%)
Figure 174: Company 14 Database Encryption Market Net Sales Share, By Geography, 2018 (%)
Figure 175: Company 15 Database Encryption Market Net Revenue, By Years, 2018-2019* ($)
Figure 176: Company 15 Database Encryption Market Net Revenue Share, By Business segments, 2018 (%)
Figure 177: Company 15 Database Encryption Market Net Sales Share, By Geography, 2018 (%)