 Email
Email Print
Print


Infectious Disease Testing Market - Forecast(2024 - 2030)
Infectious Disease Testing Market Overview
Infectious Disease Testing Market size is estimated to reach $42.4 billion by 2027, growing at a CAGR of 6.6% during the forecast period 2022-2027. Infectious diseases can be demarcated as medical disorders which are erupted by bacteria and viruses. Therefore, several laboratory procedures are taken into account to diagnose and identify infections through the collected respiratory sample. The presence of present-time technologies like DNA sequencing & Next-generation sequencing has made disease management somewhat easy. These techniques are paramount applications in comprehending the relationship between viruses and bacteria. Also, they are proficient in recording genetic mutations that make antibiotics futile. Furthermore, methods like isothermal nucleic acid amplification technology are replacing polymerase chain reaction (PCR) technology in magnification of DNA sequencing. The infectious disease testing market outlook is exceptionally astonishing considering the unremitting pace at which infectious ailments are prevailing across the globe. The unrivaled speed of infectious maladies’ pervasiveness is a preeminent factor driving the infectious disease testing market. Infections like Influenza, genital herpes, hepatitis, and others are augmenting steadily day after day. In addition to that, broadening research activities and shooting up demand for POC testing are factors set to drive the growth of the Infectious Disease Testing Market for the period 2022-2027.
Report Coverage
The report: “Infectious Disease Testing Market Forecast (2022-2027)”, by Industry ARC, covers an in-depth analysis of the following segments of the Infectious Disease Testing Market.
By Testing Type: Point-of-care testing and Laboratories testing.
By Sickness Type: Cardiovascular infections, Bacterial infections (TB, Syphilis, Strep throat, bacterial vaginosis, gonorrhea, and others), Viral infections (Influenza, Ebola, Zika, Hepatitis, SARS-CoV-2), Sexually transmitted infections (Genital herpes, Human papillomavirus, HIV, and others), Gastro-Intestinal Infections, and others.
By Technology: Microbiology, INAAT, DNA sequencing, Next-generation sequencing, Polymerase chain reaction (PCR), Immunodiagnostics, and Others.
By End User: Hospitals, Clinics, Research laboratories, and academic institutes.
By Geography: North America (U.S., Canada, and Mexico), Europe (Germany, UK, France, Italy, Spain, Russia, and Rest of Europe), Asia-Pacific (China, India, Japan, South Korea, Australia & New Zealand, and Rest of Asia-Pacific), South America (Brazil, Argentina, Chile, Colombia and Rest of South America) and Rest of World (the Middle East and Africa).
Key Takeaways
- Geographically, the North America Infectious Disease Testing Market accounted for the highest revenue share in 2021. Nevertheless, Asia-pacific is poised to dominate the market over the period 2022-2027.
- Augmenting health cognizance and enlarging research facilities with proliferating investments by governments and private players is said to be a preeminent driver driving the growth of the Infectious Disease Testing Market. the exorbitant cost of tools required to perform extensive research and the deficiency of capable specialists is said to reduce the market growth.
- Detailed analysis on the Strength, Weaknesses, and Opportunities of the prominent players operating in the market will be provided in the Infectious Disease Testing Market report.
- Infectious Disease Testing Market Segment Analysis-By Sickness Type
- The Infectious Disease Testing Market based on the sickness type can be further segmented into cardiovascular infections, bacterial infections (TB, syphilis, strep throat, bacterial vaginosis, gonorrhea, and others), viral infections (influenza, Ebola, zika, hepatitis, SARS-CoV-2), sexually transmitted infections (genital herpes, human papillomavirus, HIV, and others), gastro-Intestinal Infections, and others. The viral infection segment held the largest share in 2021. The growth is owing to a sweeping preponderance in the number of people inflicted with infectious sicknesses. Oftentimes, the protein spikes of disease mutate and find a way to evade the effects of antibiotics. Take SARS-CoV-2, for instance, this virus has mutated a number of times which is the principal cause behind the surge of this infectious disease. On another hand, hepatitis is also prevailing at the best of its capacity as alcohol consumptions are sky-rocketing. The infectious and cardiovascular infections segment is estimated to be the fastest-growing with a CAGR of 8.3% over the forecast period 2022-2027. Dull immunity is an easy target of such contagions. Therefore, prolonged sittings during office hours, poor diet intake, and worsening situation of environmental pollution are augmenting the prevalence of cardiovascular complications and other infections and emerging as a prominent reason behind the growth in respective segments.
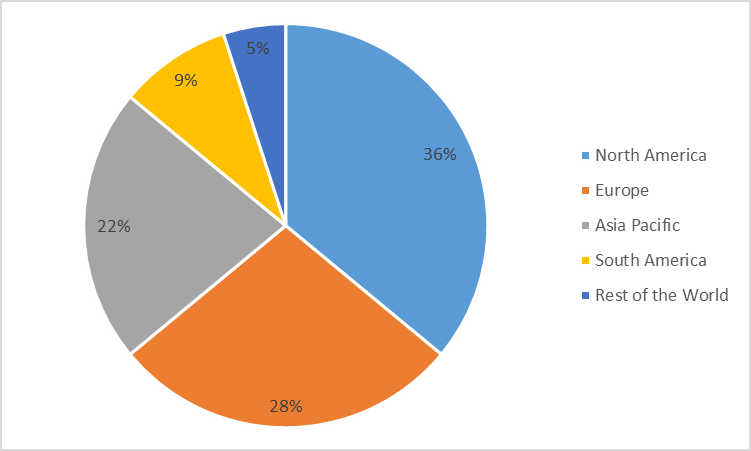
Infectious Disease Testing Market Share, By Geography (%) in 2021
For More Details On this report - Request For Sample
Infectious Disease Testing Market Segment Analysis-By End User
The Infectious Disease Testing Market based on end-user can be further segmented into hospitals, clinics, research laboratories, and academic institutes. The hospital segment held the largest share in 2021. The growth is owing to the comprehensive existence of hospitals in urban areas and the countryside. Moreover, the hospitals are comparatively well-furnished than other medical facilities therefore can better extend diagnostic and treatment conveniences at the same spot which makes people more willing to use hospitals as it saves their time. The academic and research institutes have an enormous role to play in infectious disease testing markets as they conduct all obligatory research and engender breakthroughs but their function is circumscribed to research only. They don’t offer treatment to the patients as hospitals do. Therefore, the hospital segment is estimated to be the fastest-growing segment with a CAGR of 7.7% over the forecast period 2022-2027. This growth is owing to heavy investment from governments to better handle the ongoing crisis that is “COVID-19.” As a result, the infrastructure of poorly equipped hospitals situated in impoverished areas is ameliorating. Moreover, hospitals are overwhelmed with catapulting corona cases which are the leading cause of progress in this segment.
Infectious Disease Testing Market Segment Analysis-By Geography
The Infectious Disease Testing Market based on Geography can be further segmented into North America, Europe, Asia-Pacific, South America, and the Rest of the World. North America held the largest share with 36% of the overall market in 2021. The growth in this segment is owing to the factors such as accruing COVID-19 infections cases in the U.S. In the name of freedom, people aren’t wearing masks, not taking vaccines, and not following government orders on social distancing. Moreover, most vaccines circulating worldwide are American which means extensive research is being conducted by research laboratories. Genital herpes is very common in the US. According to a report, 1 out of 5 adults experiences this condition every year. However, Asia-pacific is expected to be the fastest-growing segment over the forecast period 2022-2027. This growth is owing to overcrowded cities that act as a conducive environment for transmissions of infections. Poor sanitary habits are still prevailing among people residing in deprived areas. Therefore, incidences of diarrhea, hepatitis, and dengue are enlarging. For instance, India witnessed over 164,100 cases of dengue in 2021. Besides, with growing soft power of countries like India and China gives good ground for vaccines produced by these nations to attain acceptance by WHO and other countries which is encouraging these states to magnify their research activities.
Infectious Disease Testing Market Drivers
Growing infections are Anticipated to Boost Product Demand.
The spread of infections has become a new normal for contemporary society that it doesn’t even scare people now as if they are used to it. The world is not just reeling under the weight of COVID-19 infections but it seems that many other infections are just waiting for their turn to explode around the globe. Hepatitis cases are surging worldwide. For instance, every year the U.S. records around 3,000 cases of this inflammation. In 2020, there were more than 350 million cases of hepatitis B and C. Moreover, the intensification of sexually transmitted infections has come to the foreground in recent years like never before. More than 35 million cases of HIV were recorded in 2020.
Convenient testing options and technological breakthroughs in research are Expected to Boost Product Demand.
The swift modernization has a fair share in molding people's behaviors worldwide. With augmenting health awareness more and more people are undergoing diagnostic procedures to ensure a proper distance from infections. Moreover, the existence of expedient options like the point of care (POC) testing. The POC extends several benefits to patients like it eliminates the need to wait for several days after specimen collection. Moreover, considering the ongoing scenario governments have augmented the overall healthcare and research spending. For instance, in 2020 China amplified its R&D spending by 2.4% of its GDP. Moreover, India soared its healthcare spending by 137% for FY22.
Infectious Disease Testing Market Challenges
The unwillingness of certain factions of the population to undergo diagnostic procedures and the extortionate cost of equipment required are Anticipated to Hamper Market Growth.
Many people are not willing to undergo diagnostic procedures which can hamper the growth of the aforementioned market. According to the Centers for Disease Control and Prevention, except for COVID-19, the total number of notifiable infectious diseases cases in 2020 was 6,366,176, a decrease of 41.38% year-on-year compared with 2019. There are many people who are working round the clock to build a narrative that vaccine is harmful or they can leave vaccinated person with incurable conditions. Moreover, the countless number of riches is a prerequisite to setting up manufacturing plants and research facilities which can be a big setback in the growth of the infectious disease testing market as many businesses are dooming due to widescale lockdowns.
Infectious Disease Testing Industry Outlook:
Product launches, mergers and acquisitions, joint ventures, and geographical expansions are key strategies adopted by players in the Infectious Disease Testing Market. Key companies of this market are-
- Qiagen Company
- Cardinal Health
- Siemens AG
- Johnson & Johnson
- Quest Diagnostics
- Thermo Fisher Scientific
- Sofina Holding Company
- Quidel Corporation
- Danaher Corporation
- Ingersoll-Rand Plc
Recent Developments/Product Launches:
- On December 23, 2021, California, United States-based diagnostic healthcare products manufacturing company “Quidel Corporation” announced that it has reached an acquisition agreement with US-based in vitro diagnostic corporation “Ortho Clinical Diagnostics.” According to the transaction agreement, Quidel will pay an amount of $6 billion with $24.68 per share to wrap up the process.
- On June 1, 2021, Washington, D.C, United States-based conglomerate “Danaher Corporation” publicized the successful acquisition of Canada-based company “Precision NanoSystems.” The financials of the transaction were not disclosed. Moreover, as Precision is famous for genetic medicine solutions the acquisition is anticipated to strengthen the operations of Cytiva and Pall which are subsidiaries of Danaher.
- On March 12, 2021, US-based healthcare services company “Cardinal Health” announced that the company has signed an agreement with the company “Hellman & Friedman.” Based on this agreement Cardinal Health will sell its Cordis business for a total price of $1 billion. The process is anticipated to be concluded by the initial half of 2022.
Relevant Links:
Report Code: HCR 64783
Report Code: HCR 0423
Report Code: HCR 96604
For more Lifesciences and Healthcare Market reports, please click here
1. Infectious Disease Testing Market Overview
1.1 Definitions and Scope
2. Infectious Disease Testing Market - Executive Summary
3. Infectious Disease Testing Market– Market Landscape
3.1 Company Benchmarking- Key Companies
3.2 Key Company Financial Analysis
3.3 Market Share Analysis
3.4 Patent Analysis-Global
3.5 Pricing Analysis (Comparison of General Price Offerings in the Market)
4. Infectious Disease Testing Market– Startup Company Scenario (Premium)
4.1 Investment
4.2 Revenue
4.3 Venture Capital and Funding Scenario
5. Infectious Disease Testing Market– Industry Market Entry Scenario Premium (Premium)
5.1 Regulatory Scenario
5.2 New Business and Ease of Doing business index-Global
5.3 Case Studies of Successful Ventures
6. Infectious Disease Testing Market- Market Forces
6.1 Market Drivers
6.2 Market Constraints
6.3 Porters five force model
6.3.1 Bargaining power of suppliers
6.3.2 Bargaining powers of customers
6.3.3 Threat of new entrants
6.3.4 Rivalry among existing players
6.3.5 Threat of substitutes
7. Infectious Disease Testing Market– By Strategic Analysis
7.1 Value Chain Analysis
7.2 Opportunities Analysis
7.3 Market Life Cycle Analysis
8. Infectious Disease Testing Market - By Testing Type (Market Size –$Million/$Billion)
8.1 Point-of-care testing
8.2 Laboratories testing
9. Infectious Disease Testing Market – By Sickness Type (Market Size –$Million/$Billion)
9.1 Cardiovascular infections
9.2 Bacterial infections (TB, Syphilis, Strep throat, bacterial vaginosis, gonorrhea, and others)
9.3 Viral infections (Influenza, Ebola, Zika, Hepatitis, SARS-CoV-2)
9.4 Sexually transmitted infections (Genital herpes, Human papillomavirus, HIV, and others)
9.5 Gastro-Intestinal Infections
9.6 Others
10. Infectious Disease Testing Market – By Technology (Market Size –$Million/$Billion)
10.1 Microbiology
10.2 INAAT
10.3 DNA sequencing
10.4 Next-generation sequencing
10.5 Polymerase chain reaction (PCR)
10.6 Immunodiagnostics, and others
11. Infectious Disease Testing Market – By End User (Market Size –$Million/$Billion
11.1 Hospitals
11.2 Clinics
11.3 Research laboratories
11.4 Academic institutes
12. Infectious Disease Testing Market- By Geography (Market Size -$Million/Billion)
12.1 North America
12.1.1 U.S
12.1.2 Canada
12.1.3 Mexico
12.2 Europe
12.2.1 Germany
12.2.2 France
12.2.3 UK
12.2.4 Italy
12.2.5 Spain
12.2.6 Russia
12.2.7 Rest of Europe
12.3 Asia-Pacific
12.3.1 China
12.3.2 Japan
12.3.3 South Korea
12.3.4 India
12.3.5 Australia & New Zealand
12.3.6 Rest of Asia-Pacific
12.4 South America
12.4.1 Brazil
12.4.2 Argentina
12.4.3 Chile
12.4.4 Colombia
12.4.5 Rest of South America
12.5 Rest of World
12.5.1 Middle East
12.5.2 Africa
13. Infectious Disease Testing Market- Market Entropy
13.1 New product launches
13.2 M&A's, collaborations, JVs and partnerships
14. Infectious Disease Testing Market– Industry Competition Landscape (Premium)
14.1 Market Share Analysis
14.1.1 Global Market Share – Key Companies
14.1.2 Market Share by Region – Key Companies
14.1.3 Market Share by Countries – Key Companies
14.2 Competition Matrix
14.3 Best Practices for Companies
15. Infectious Disease Testing Market– Key Company List by Country Premium (Premium)
16. Infectious Disease Testing Market- Company Analysis
16.1 Company 1
16.2 Company 2
16.3 Company 3
16.4 Company 4
16.5 Company 5
16.6 Company 6
16.7 Company 7
16.8 Company 8
16.9 Company 9
16.10 Company 10
"*Financials would be provided on a best-efforts basis for private companies"
List of Tables
Table 1: Infectious Disease Testing Market Overview 2023-2030
Table 2: Infectious Disease Testing Market Leader Analysis 2023-2030 (US$)
Table 3: Infectious Disease Testing Market Product Analysis 2023-2030 (US$)
Table 4: Infectious Disease Testing Market End User Analysis 2023-2030 (US$)
Table 5: Infectious Disease Testing Market Patent Analysis 2013-2023* (US$)
Table 6: Infectious Disease Testing Market Financial Analysis 2023-2030 (US$)
Table 7: Infectious Disease Testing Market Driver Analysis 2023-2030 (US$)
Table 8: Infectious Disease Testing Market Challenges Analysis 2023-2030 (US$)
Table 9: Infectious Disease Testing Market Constraint Analysis 2023-2030 (US$)
Table 10: Infectious Disease Testing Market Supplier Bargaining Power Analysis 2023-2030 (US$)
Table 11: Infectious Disease Testing Market Buyer Bargaining Power Analysis 2023-2030 (US$)
Table 12: Infectious Disease Testing Market Threat of Substitutes Analysis 2023-2030 (US$)
Table 13: Infectious Disease Testing Market Threat of New Entrants Analysis 2023-2030 (US$)
Table 14: Infectious Disease Testing Market Degree of Competition Analysis 2023-2030 (US$)
Table 15: Infectious Disease Testing Market Value Chain Analysis 2023-2030 (US$)
Table 16: Infectious Disease Testing Market Pricing Analysis 2023-2030 (US$)
Table 17: Infectious Disease Testing Market Opportunities Analysis 2023-2030 (US$)
Table 18: Infectious Disease Testing Market Product Life Cycle Analysis 2023-2030 (US$)
Table 19: Infectious Disease Testing Market Supplier Analysis 2023-2030 (US$)
Table 20: Infectious Disease Testing Market Distributor Analysis 2023-2030 (US$)
Table 21: Infectious Disease Testing Market Trend Analysis 2023-2030 (US$)
Table 22: Infectious Disease Testing Market Size 2023 (US$)
Table 23: Infectious Disease Testing Market Forecast Analysis 2023-2030 (US$)
Table 24: Infectious Disease Testing Market Sales Forecast Analysis 2023-2030 (Units)
Table 25: Infectious Disease Testing Market, Revenue & Volume, By Type Of Disease, 2023-2030 ($)
Table 26: Infectious Disease Testing Market By Type Of Disease, Revenue & Volume, By Introduction, 2023-2030 ($)
Table 27: Infectious Disease Testing Market By Type Of Disease, Revenue & Volume, By Influenza, 2023-2030 ($)
Table 28: Infectious Disease Testing Market By Type Of Disease, Revenue & Volume, By Hepatitis, 2023-2030 ($)
Table 29: Infectious Disease Testing Market By Type Of Disease, Revenue & Volume, By AIDS, 2023-2030 ($)
Table 30: Infectious Disease Testing Market By Type Of Disease, Revenue & Volume, By Tuberculosis, 2023-2030 ($)
Table 31: Infectious Disease Testing Market, Revenue & Volume, By Testing Technique, 2023-2030 ($)
Table 32: Infectious Disease Testing Market By Testing Technique, Revenue & Volume, By Introduction, 2023-2030 ($)
Table 33: Infectious Disease Testing Market By Testing Technique, Revenue & Volume, By Immuno diagnostics, 2023-2030 ($)
Table 34: Infectious Disease Testing Market By Testing Technique, Revenue & Volume, By Biochemical Characterization, 2023-2030 ($)
Table 35: Infectious Disease Testing Market By Testing Technique, Revenue & Volume, By Microscopy, 2023-2030 ($)
Table 36: Infectious Disease Testing Market By Testing Technique, Revenue & Volume, By Polymerase Chain Reaction(PCR), 2023-2030 ($)
Table 37: Infectious Disease Testing Market, Revenue & Volume, By Industry, 2023-2030 ($)
Table 38: Infectious Disease Testing Market By Industry, Revenue & Volume, By Laboratories, 2023-2030 ($)
Table 39: Infectious Disease Testing Market By Industry, Revenue & Volume, By Nursing Homes, 2023-2030 ($)
Table 40: Infectious Disease Testing Market By Industry, Revenue & Volume, By Blood Banks, 2023-2030 ($)
Table 41: Infectious Disease Testing Market By Industry, Revenue & Volume, By Hospitals, 2023-2030 ($)
Table 42: Infectious Disease Testing Market By Industry, Revenue & Volume, By Research Labs, 2023-2030 ($)
Table 43: North America Infectious Disease Testing Market, Revenue & Volume, By Type Of Disease, 2023-2030 ($)
Table 44: North America Infectious Disease Testing Market, Revenue & Volume, By Testing Technique, 2023-2030 ($)
Table 45: North America Infectious Disease Testing Market, Revenue & Volume, By Industry, 2023-2030 ($)
Table 46: South america Infectious Disease Testing Market, Revenue & Volume, By Type Of Disease, 2023-2030 ($)
Table 47: South america Infectious Disease Testing Market, Revenue & Volume, By Testing Technique, 2023-2030 ($)
Table 48: South america Infectious Disease Testing Market, Revenue & Volume, By Industry, 2023-2030 ($)
Table 49: Europe Infectious Disease Testing Market, Revenue & Volume, By Type Of Disease, 2023-2030 ($)
Table 50: Europe Infectious Disease Testing Market, Revenue & Volume, By Testing Technique, 2023-2030 ($)
Table 51: Europe Infectious Disease Testing Market, Revenue & Volume, By Industry, 2023-2030 ($)
Table 52: APAC Infectious Disease Testing Market, Revenue & Volume, By Type Of Disease, 2023-2030 ($)
Table 53: APAC Infectious Disease Testing Market, Revenue & Volume, By Testing Technique, 2023-2030 ($)
Table 54: APAC Infectious Disease Testing Market, Revenue & Volume, By Industry, 2023-2030 ($)
Table 55: Middle East & Africa Infectious Disease Testing Market, Revenue & Volume, By Type Of Disease, 2023-2030 ($)
Table 56: Middle East & Africa Infectious Disease Testing Market, Revenue & Volume, By Testing Technique, 2023-2030 ($)
Table 57: Middle East & Africa Infectious Disease Testing Market, Revenue & Volume, By Industry, 2023-2030 ($)
Table 58: Russia Infectious Disease Testing Market, Revenue & Volume, By Type Of Disease, 2023-2030 ($)
Table 59: Russia Infectious Disease Testing Market, Revenue & Volume, By Testing Technique, 2023-2030 ($)
Table 60: Russia Infectious Disease Testing Market, Revenue & Volume, By Industry, 2023-2030 ($)
Table 61: Israel Infectious Disease Testing Market, Revenue & Volume, By Type Of Disease, 2023-2030 ($)
Table 62: Israel Infectious Disease Testing Market, Revenue & Volume, By Testing Technique, 2023-2030 ($)
Table 63: Israel Infectious Disease Testing Market, Revenue & Volume, By Industry, 2023-2030 ($)
Table 64: Top Companies 2023 (US$) Infectious Disease Testing Market, Revenue & Volume
Table 65: Product Launch 2023-2030 Infectious Disease Testing Market, Revenue & Volume
Table 66: Mergers & Acquistions 2023-2030 Infectious Disease Testing Market, Revenue & Volume
List of Figures
Figure 1: Overview of Infectious Disease Testing Market 2023-2030
Figure 2: Market Share Analysis for Infectious Disease Testing Market 2023 (US$)
Figure 3: Product Comparison in Infectious Disease Testing Market 2023-2030 (US$)
Figure 4: End User Profile for Infectious Disease Testing Market 2023-2030 (US$)
Figure 5: Patent Application and Grant in Infectious Disease Testing Market 2013-2023* (US$)
Figure 6: Top 5 Companies Financial Analysis in Infectious Disease Testing Market 2023-2030 (US$)
Figure 7: Market Entry Strategy in Infectious Disease Testing Market 2023-2030
Figure 8: Ecosystem Analysis in Infectious Disease Testing Market 2023
Figure 9: Average Selling Price in Infectious Disease Testing Market 2023-2030
Figure 10: Top Opportunites in Infectious Disease Testing Market 2023-2030
Figure 11: Market Life Cycle Analysis in Infectious Disease Testing Market
Figure 12: GlobalBy Type Of Disease Infectious Disease Testing Market Revenue, 2023-2030 ($)
Figure 13: GlobalBy Testing Technique Infectious Disease Testing Market Revenue, 2023-2030 ($)
Figure 14: GlobalBy Industry Infectious Disease Testing Market Revenue, 2023-2030 ($)
Figure 15: Global Infectious Disease Testing Market - By Geography
Figure 16: Global Infectious Disease Testing Market Value & Volume, By Geography, 2023-2030 ($)
Figure 17: Global Infectious Disease Testing Market CAGR, By Geography, 2023-2030 (%)
Figure 18: North America Infectious Disease Testing Market Value & Volume, 2023-2030 ($)
Figure 19: US Infectious Disease Testing Market Value & Volume, 2023-2030 ($)
Figure 20: US GDP and Population, 2023-2030 ($)
Figure 21: US GDP – Composition of 2023, By Sector of Origin
Figure 22: US Export and Import Value & Volume, 2023-2030 ($)
Figure 23: Canada Infectious Disease Testing Market Value & Volume, 2023-2030 ($)
Figure 24: Canada GDP and Population, 2023-2030 ($)
Figure 25: Canada GDP – Composition of 2023, By Sector of Origin
Figure 26: Canada Export and Import Value & Volume, 2023-2030 ($)
Figure 27: Mexico Infectious Disease Testing Market Value & Volume, 2023-2030 ($)
Figure 28: Mexico GDP and Population, 2023-2030 ($)
Figure 29: Mexico GDP – Composition of 2023, By Sector of Origin
Figure 30: Mexico Export and Import Value & Volume, 2023-2030 ($)
Figure 31: South America Infectious Disease Testing Market Value & Volume, 2023-2030 ($)
Figure 32: Brazil Infectious Disease Testing Market Value & Volume, 2023-2030 ($)
Figure 33: Brazil GDP and Population, 2023-2030 ($)
Figure 34: Brazil GDP – Composition of 2023, By Sector of Origin
Figure 35: Brazil Export and Import Value & Volume, 2023-2030 ($)
Figure 36: Venezuela Infectious Disease Testing Market Value & Volume, 2023-2030 ($)
Figure 37: Venezuela GDP and Population, 2023-2030 ($)
Figure 38: Venezuela GDP – Composition of 2023, By Sector of Origin
Figure 39: Venezuela Export and Import Value & Volume, 2023-2030 ($)
Figure 40: Argentina Infectious Disease Testing Market Value & Volume, 2023-2030 ($)
Figure 41: Argentina GDP and Population, 2023-2030 ($)
Figure 42: Argentina GDP – Composition of 2023, By Sector of Origin
Figure 43: Argentina Export and Import Value & Volume, 2023-2030 ($)
Figure 44: Ecuador Infectious Disease Testing Market Value & Volume, 2023-2030 ($)
Figure 45: Ecuador GDP and Population, 2023-2030 ($)
Figure 46: Ecuador GDP – Composition of 2023, By Sector of Origin
Figure 47: Ecuador Export and Import Value & Volume, 2023-2030 ($)
Figure 48: Peru Infectious Disease Testing Market Value & Volume, 2023-2030 ($)
Figure 49: Peru GDP and Population, 2023-2030 ($)
Figure 50: Peru GDP – Composition of 2023, By Sector of Origin
Figure 51: Peru Export and Import Value & Volume, 2023-2030 ($)
Figure 52: Colombia Infectious Disease Testing Market Value & Volume, 2023-2030 ($)
Figure 53: Colombia GDP and Population, 2023-2030 ($)
Figure 54: Colombia GDP – Composition of 2023, By Sector of Origin
Figure 55: Colombia Export and Import Value & Volume, 2023-2030 ($)
Figure 56: Costa Rica Infectious Disease Testing Market Value & Volume, 2023-2030 ($)
Figure 57: Costa Rica GDP and Population, 2023-2030 ($)
Figure 58: Costa Rica GDP – Composition of 2023, By Sector of Origin
Figure 59: Costa Rica Export and Import Value & Volume, 2023-2030 ($)
Figure 60: Europe Infectious Disease Testing Market Value & Volume, 2023-2030 ($)
Figure 61: U.K Infectious Disease Testing Market Value & Volume, 2023-2030 ($)
Figure 62: U.K GDP and Population, 2023-2030 ($)
Figure 63: U.K GDP – Composition of 2023, By Sector of Origin
Figure 64: U.K Export and Import Value & Volume, 2023-2030 ($)
Figure 65: Germany Infectious Disease Testing Market Value & Volume, 2023-2030 ($)
Figure 66: Germany GDP and Population, 2023-2030 ($)
Figure 67: Germany GDP – Composition of 2023, By Sector of Origin
Figure 68: Germany Export and Import Value & Volume, 2023-2030 ($)
Figure 69: Italy Infectious Disease Testing Market Value & Volume, 2023-2030 ($)
Figure 70: Italy GDP and Population, 2023-2030 ($)
Figure 71: Italy GDP – Composition of 2023, By Sector of Origin
Figure 72: Italy Export and Import Value & Volume, 2023-2030 ($)
Figure 73: France Infectious Disease Testing Market Value & Volume, 2023-2030 ($)
Figure 74: France GDP and Population, 2023-2030 ($)
Figure 75: France GDP – Composition of 2023, By Sector of Origin
Figure 76: France Export and Import Value & Volume, 2023-2030 ($)
Figure 77: Netherlands Infectious Disease Testing Market Value & Volume, 2023-2030 ($)
Figure 78: Netherlands GDP and Population, 2023-2030 ($)
Figure 79: Netherlands GDP – Composition of 2023, By Sector of Origin
Figure 80: Netherlands Export and Import Value & Volume, 2023-2030 ($)
Figure 81: Belgium Infectious Disease Testing Market Value & Volume, 2023-2030 ($)
Figure 82: Belgium GDP and Population, 2023-2030 ($)
Figure 83: Belgium GDP – Composition of 2023, By Sector of Origin
Figure 84: Belgium Export and Import Value & Volume, 2023-2030 ($)
Figure 85: Spain Infectious Disease Testing Market Value & Volume, 2023-2030 ($)
Figure 86: Spain GDP and Population, 2023-2030 ($)
Figure 87: Spain GDP – Composition of 2023, By Sector of Origin
Figure 88: Spain Export and Import Value & Volume, 2023-2030 ($)
Figure 89: Denmark Infectious Disease Testing Market Value & Volume, 2023-2030 ($)
Figure 90: Denmark GDP and Population, 2023-2030 ($)
Figure 91: Denmark GDP – Composition of 2023, By Sector of Origin
Figure 92: Denmark Export and Import Value & Volume, 2023-2030 ($)
Figure 93: APAC Infectious Disease Testing Market Value & Volume, 2023-2030 ($)
Figure 94: China Infectious Disease Testing Market Value & Volume, 2023-2030
Figure 95: China GDP and Population, 2023-2030 ($)
Figure 96: China GDP – Composition of 2023, By Sector of Origin
Figure 97: China Export and Import Value & Volume, 2023-2030 ($) Infectious Disease Testing Market China Export and Import Value & Volume, 2023-2030 ($)
Figure 98: Australia Infectious Disease Testing Market Value & Volume, 2023-2030 ($)
Figure 99: Australia GDP and Population, 2023-2030 ($)
Figure 100: Australia GDP – Composition of 2023, By Sector of Origin
Figure 101: Australia Export and Import Value & Volume, 2023-2030 ($)
Figure 102: South Korea Infectious Disease Testing Market Value & Volume, 2023-2030 ($)
Figure 103: South Korea GDP and Population, 2023-2030 ($)
Figure 104: South Korea GDP – Composition of 2023, By Sector of Origin
Figure 105: South Korea Export and Import Value & Volume, 2023-2030 ($)
Figure 106: India Infectious Disease Testing Market Value & Volume, 2023-2030 ($)
Figure 107: India GDP and Population, 2023-2030 ($)
Figure 108: India GDP – Composition of 2023, By Sector of Origin
Figure 109: India Export and Import Value & Volume, 2023-2030 ($)
Figure 110: Taiwan Infectious Disease Testing Market Value & Volume, 2023-2030 ($)
Figure 111: Taiwan GDP and Population, 2023-2030 ($)
Figure 112: Taiwan GDP – Composition of 2023, By Sector of Origin
Figure 113: Taiwan Export and Import Value & Volume, 2023-2030 ($)
Figure 114: Malaysia Infectious Disease Testing Market Value & Volume, 2023-2030 ($)
Figure 115: Malaysia GDP and Population, 2023-2030 ($)
Figure 116: Malaysia GDP – Composition of 2023, By Sector of Origin
Figure 117: Malaysia Export and Import Value & Volume, 2023-2030 ($)
Figure 118: Hong Kong Infectious Disease Testing Market Value & Volume, 2023-2030 ($)
Figure 119: Hong Kong GDP and Population, 2023-2030 ($)
Figure 120: Hong Kong GDP – Composition of 2023, By Sector of Origin
Figure 121: Hong Kong Export and Import Value & Volume, 2023-2030 ($)
Figure 122: Middle East & Africa Infectious Disease Testing Market Middle East & Africa 3D Printing Market Value & Volume, 2023-2030 ($)
Figure 123: Russia Infectious Disease Testing Market Value & Volume, 2023-2030 ($)
Figure 124: Russia GDP and Population, 2023-2030 ($)
Figure 125: Russia GDP – Composition of 2023, By Sector of Origin
Figure 126: Russia Export and Import Value & Volume, 2023-2030 ($)
Figure 127: Israel Infectious Disease Testing Market Value & Volume, 2023-2030 ($)
Figure 128: Israel GDP and Population, 2023-2030 ($)
Figure 129: Israel GDP – Composition of 2023, By Sector of Origin
Figure 130: Israel Export and Import Value & Volume, 2023-2030 ($)
Figure 131: Entropy Share, By Strategies, 2023-2030* (%) Infectious Disease Testing Market
Figure 132: Developments, 2023-2030* Infectious Disease Testing Market
Figure 133: Company 1 Infectious Disease Testing Market Net Revenue, By Years, 2023-2030* ($)
Figure 134: Company 1 Infectious Disease Testing Market Net Revenue Share, By Business segments, 2023 (%)
Figure 135: Company 1 Infectious Disease Testing Market Net Sales Share, By Geography, 2023 (%)
Figure 136: Company 2 Infectious Disease Testing Market Net Revenue, By Years, 2023-2030* ($)
Figure 137: Company 2 Infectious Disease Testing Market Net Revenue Share, By Business segments, 2023 (%)
Figure 138: Company 2 Infectious Disease Testing Market Net Sales Share, By Geography, 2023 (%)
Figure 139: Company 3 Infectious Disease Testing Market Net Revenue, By Years, 2023-2030* ($)
Figure 140: Company 3 Infectious Disease Testing Market Net Revenue Share, By Business segments, 2023 (%)
Figure 141: Company 3 Infectious Disease Testing Market Net Sales Share, By Geography, 2023 (%)
Figure 142: Company 4 Infectious Disease Testing Market Net Revenue, By Years, 2023-2030* ($)
Figure 143: Company 4 Infectious Disease Testing Market Net Revenue Share, By Business segments, 2023 (%)
Figure 144: Company 4 Infectious Disease Testing Market Net Sales Share, By Geography, 2023 (%)
Figure 145: Company 5 Infectious Disease Testing Market Net Revenue, By Years, 2023-2030* ($)
Figure 146: Company 5 Infectious Disease Testing Market Net Revenue Share, By Business segments, 2023 (%)
Figure 147: Company 5 Infectious Disease Testing Market Net Sales Share, By Geography, 2023 (%)
Figure 148: Company 6 Infectious Disease Testing Market Net Revenue, By Years, 2023-2030* ($)
Figure 149: Company 6 Infectious Disease Testing Market Net Revenue Share, By Business segments, 2023 (%)
Figure 150: Company 6 Infectious Disease Testing Market Net Sales Share, By Geography, 2023 (%)
Figure 151: Company 7 Infectious Disease Testing Market Net Revenue, By Years, 2023-2030* ($)
Figure 152: Company 7 Infectious Disease Testing Market Net Revenue Share, By Business segments, 2023 (%)
Figure 153: Company 7 Infectious Disease Testing Market Net Sales Share, By Geography, 2023 (%)
Figure 154: Company 8 Infectious Disease Testing Market Net Revenue, By Years, 2023-2030* ($)
Figure 155: Company 8 Infectious Disease Testing Market Net Revenue Share, By Business segments, 2023 (%)
Figure 156: Company 8 Infectious Disease Testing Market Net Sales Share, By Geography, 2023 (%)
Figure 157: Company 9 Infectious Disease Testing Market Net Revenue, By Years, 2023-2030* ($)
Figure 158: Company 9 Infectious Disease Testing Market Net Revenue Share, By Business segments, 2023 (%)
Figure 159: Company 9 Infectious Disease Testing Market Net Sales Share, By Geography, 2023 (%)
Figure 160: Company 10 Infectious Disease Testing Market Net Revenue, By Years, 2023-2030* ($)
Figure 161: Company 10 Infectious Disease Testing Market Net Revenue Share, By Business segments, 2023 (%)
Figure 162: Company 10 Infectious Disease Testing Market Net Sales Share, By Geography, 2023 (%)
Figure 163: Company 11 Infectious Disease Testing Market Net Revenue, By Years, 2023-2030* ($)
Figure 164: Company 11 Infectious Disease Testing Market Net Revenue Share, By Business segments, 2023 (%)
Figure 165: Company 11 Infectious Disease Testing Market Net Sales Share, By Geography, 2023 (%)
Figure 166: Company 12 Infectious Disease Testing Market Net Revenue, By Years, 2023-2030* ($)
Figure 167: Company 12 Infectious Disease Testing Market Net Revenue Share, By Business segments, 2023 (%)
Figure 168: Company 12 Infectious Disease Testing Market Net Sales Share, By Geography, 2023 (%)
Figure 169: Company 13 Infectious Disease Testing Market Net Revenue, By Years, 2023-2030* ($)
Figure 170: Company 13 Infectious Disease Testing Market Net Revenue Share, By Business segments, 2023 (%)
Figure 171: Company 13 Infectious Disease Testing Market Net Sales Share, By Geography, 2023 (%)
Figure 172: Company 14 Infectious Disease Testing Market Net Revenue, By Years, 2023-2030* ($)
Figure 173: Company 14 Infectious Disease Testing Market Net Revenue Share, By Business segments, 2023 (%)
Figure 174: Company 14 Infectious Disease Testing Market Net Sales Share, By Geography, 2023 (%)
Figure 175: Company 15 Infectious Disease Testing Market Net Revenue, By Years, 2023-2030* ($)
Figure 176: Company 15 Infectious Disease Testing Market Net Revenue Share, By Business segments, 2023 (%)
Figure 177: Company 15 Infectious Disease Testing Market Net Sales Share, By Geography, 2023 (%)