 Email
Email Print
Print


Protective Packaging Market - Forecast(2024 - 2030)
Protective packaging products are created to safeguard the goods from damages; it can be atmospheric, magnetic, electrostatic, shock and so on. Products comprises of diverse varieties of box or storage containers, space fillers, liners, and spacers. These products are planned to secure packaging from damages. Protection aspects consist of electrical and thermal insulation, fire security, moist protection, shock or vibration diminishing, UV or weather resistance.
Different protective packages are used by different trades such as food & beverages, agriculture, pharmaceuticals, automotive, construction, computers & electronics, textiles and others are some of the end-user industries. Corrugated, solid fiber board, molded pulp, fabricated foam, molded EPS, thermo foam blisters, nonwoven fibres and others are the types of protective packaging market. The report also focuses on different geographic regions and the key countries in terms of changing trends in using protective packaging in various fields.
There are different materials such as foam, paper, paper board, plastics and others that are being used to achieve this objective; Plastic material is one important evolution in this field. The end user industry is the major driver for the protective packaging market to nurture. The protective packaging market has been segmented into different segments such as types, materials, applications, end user industry and geography entirely. Each type varies greatly and the composition is different with different technical specifications. Protective packaging are being used in different applications such as cushion, void-fill, blocking and bracing, surface protection, containment and others. The key user segments include agriculture, food & beverages, pharmaceuticals, automotive, construction, electronics, textiles and many more.
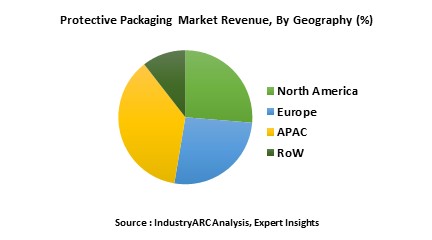
The global market for wet waste management was estimated to be $XX billion in 2015. The global market for protective packaging market estimated to grow at a CAGR of XX% and is forecast to reach $XX billion by 2021. Asia-pacific (APAC) and North America alone are estimated to occupy a share of more than XX% during 2016-2021.
Asia-pacific (APAC) is the leading market for protective packaging market with china leading the charge followed by North America and Europe. APAC region is forecasted to have highest growth in the next few years due to the increase in manufacturing activities, increase in the Internet penetration, and the increase in spending by end consumers for packaged products through e-retailing channels. APAC protective packaging market accounts to XX% of the global market for protective packaging market.
Sample Companies Profiled in this Report are:
E-commerce industry to drive the usage of protective packaging
E-commerce (electronic commerce or EC) is the buying and selling of goods and services, or the transmitting of funds or data, over an electronic network, primarily the Internet. These business transactions occur either business-to-business, business-to-consumer, consumer-to-consumer or consumer-to-business.
The key driver contributing to the growth of the global protective packaging market is its increasing usage in the E-commerce industry. The growing acceptance of the online shopping in both the developing and developed regions of the world is likely to propel the demand for global protective packing industry.
Moreover, acceleration in the global industrial output, along with upsurge in the consumer expenditure on packaged goods across the globe, and demographic drifts such as increase in the number of urban population are further going to drive the market for protective packaging. The opportunities that can be further explored in the global protective packaging market is innovation in technology to develop packaging materials that are sustainable and can be reused and recycled. The availability and high cost of the raw materials is a major restrain in the global protective packaging market.
Therefore, with the extreme usage of E-commerce industry the growth of protective package market is possible.
Different protective packages are used by different trades such as food & beverages, agriculture, pharmaceuticals, automotive, construction, computers & electronics, textiles and others are some of the end-user industries. Corrugated, solid fiber board, molded pulp, fabricated foam, molded EPS, thermo foam blisters, nonwoven fibres and others are the types of protective packaging market. The report also focuses on different geographic regions and the key countries in terms of changing trends in using protective packaging in various fields.
There are different materials such as foam, paper, paper board, plastics and others that are being used to achieve this objective; Plastic material is one important evolution in this field. The end user industry is the major driver for the protective packaging market to nurture. The protective packaging market has been segmented into different segments such as types, materials, applications, end user industry and geography entirely. Each type varies greatly and the composition is different with different technical specifications. Protective packaging are being used in different applications such as cushion, void-fill, blocking and bracing, surface protection, containment and others. The key user segments include agriculture, food & beverages, pharmaceuticals, automotive, construction, electronics, textiles and many more.
The global market for wet waste management was estimated to be $XX billion in 2015. The global market for protective packaging market estimated to grow at a CAGR of XX% and is forecast to reach $XX billion by 2021. Asia-pacific (APAC) and North America alone are estimated to occupy a share of more than XX% during 2016-2021.
Asia-pacific (APAC) is the leading market for protective packaging market with china leading the charge followed by North America and Europe. APAC region is forecasted to have highest growth in the next few years due to the increase in manufacturing activities, increase in the Internet penetration, and the increase in spending by end consumers for packaged products through e-retailing channels. APAC protective packaging market accounts to XX% of the global market for protective packaging market.
Sample Companies Profiled in this Report are:
- Smurfit Kappa Group plc (Ireland)
- RockTenn Company (U.S.)
- Sealed Air Corporation (U.S.)
- Sonoco Products Company (U.S.)
- Huhtamaki OYJ (Finland)
- 10+.
E-commerce industry to drive the usage of protective packaging
E-commerce (electronic commerce or EC) is the buying and selling of goods and services, or the transmitting of funds or data, over an electronic network, primarily the Internet. These business transactions occur either business-to-business, business-to-consumer, consumer-to-consumer or consumer-to-business.
The key driver contributing to the growth of the global protective packaging market is its increasing usage in the E-commerce industry. The growing acceptance of the online shopping in both the developing and developed regions of the world is likely to propel the demand for global protective packing industry.
Moreover, acceleration in the global industrial output, along with upsurge in the consumer expenditure on packaged goods across the globe, and demographic drifts such as increase in the number of urban population are further going to drive the market for protective packaging. The opportunities that can be further explored in the global protective packaging market is innovation in technology to develop packaging materials that are sustainable and can be reused and recycled. The availability and high cost of the raw materials is a major restrain in the global protective packaging market.
Therefore, with the extreme usage of E-commerce industry the growth of protective package market is possible.
1. Protective Packaging Market - Overview
1.1. Definitions and Scope
2. Protective Packaging Market - Executive summary
2.1. Market Revenue, Market Size and Key Trends by Company
2.2. Key Trends by type of Application
2.3. Key Trends segmented by Geography
3. Protective Packaging Market
3.1. Comparative analysis
3.1.1. Product Benchmarking - Top 10 companies
3.1.2. Top 5 Financials Analysis
3.1.3. Market Value split by Top 10 companies
3.1.4. Patent Analysis - Top 10 companies
3.1.5. Pricing Analysis
4. Protective Packaging Market – Startup companies Scenario Premium
4.1. Top 10 startup company Analysis by
4.1.1. Investment
4.1.2. Revenue
4.1.3. Market Shares
4.1.4. Market Size and Application Analysis
4.1.5. Venture Capital and Funding Scenario
5. Protective Packaging Market – Industry Market Entry Scenario Premium
5.1. Regulatory Framework Overview
5.2. New Business and Ease of Doing business index
5.3. Case studies of successful ventures
5.4. Customer Analysis – Top 10 companies
6. Protective Packaging Market Forces
6.1. Drivers
6.2. Constraints
6.3. Challenges
6.4. Porters five force model
6.4.1. Bargaining power of suppliers
6.4.2. Bargaining powers of customers
6.4.3. Threat of new entrants
6.4.4. Rivalry among existing players
6.4.5. Threat of substitutes
7. Protective Packaging Market -Strategic analysis
7.1. Value chain analysis
7.2. Opportunities analysis
7.3. Product life cycle
7.4. Suppliers and distributors Market Share
8. Protective Packaging Market – By Type (Market Size -$Million / $Billion)
8.1. Market Size and Market Share Analysis
8.2. Application Revenue and Trend Research
8.3. Product Segment Analysis
8.3.1. Introduction
8.3.2. Corrugated
8.3.3. Solid Fibre Board
8.3.4. Molded Pulp
8.3.5. Fabricated Foam
8.3.6. Molded EPS
8.3.7. Thermo Foam Blisters
8.3.8. Nonwoven Fibres
8.3.9 Others
9. Protective Packaging Market – By Material (Market Size -$Million / $Billion)
9.1. Foam
9.2. Paper
9.3. Paper Board
9.4. Plastic
9.5. Others
10. Protective Packaging Market – By Function (Market Size -$Million / $Billion)
10.1. Cushion
10.2. Void-Fill
10.3. Blocking & Bracing
10.4. Surface Protection
10.5. Containment
10.6. Others
11. Protective Packaging Market – By Industry (Market Size -$Million / $Billion)
11.1. Agriculture
11.2. Food & Beverages
11.3. Pharmaceuticals
11.4. Automotive
11.5. Construction
11.6. Electronics
11.7. Textiles
11.8. Others
12. Protective Packaging - By Geography (Market Size -$Million / $Billion)
12.1. Protective Packaging Market - North America Segment Research
12.2. North America Market Research (Million / $Billion)
12.2.1. Segment type Size and Market Size Analysis
12.2.2. Revenue and Trends
12.2.3. Application Revenue and Trends by type of Application
12.2.4. Company Revenue and Product Analysis
12.2.5. North America Product type and Application Market Size
12.2.5.1. U.S.
12.2.5.2. Canada
12.2.5.3. Mexico
12.2.5.4. Rest of North America
12.3. Protective Packaging - South America Segment Research
12.4. South America Market Research (Market Size -$Million / $Billion)
12.4.1. Segment type Size and Market Size Analysis
12.4.2. Revenue and Trends
12.4.3. Application Revenue and Trends by type of Application
12.4.4. Company Revenue and Product Analysis
12.4.5. South America Product type and Application Market Size
12.4.5.1. Brazil
12.4.5.2. Venezuela
12.4.5.3. Argentina
12.4.5.4. Ecuador
12.4.5.5. Peru
12.4.5.6. Colombia
12.4.5.7. Costa Rica
12.4.5.8. Rest of South America
12.5. Protective Packaging - Europe Segment Research
12.6. Europe Market Research (Market Size -$Million / $Billion)
12.6.1. Segment type Size and Market Size Analysis
12.6.2. Revenue and Trends
12.6.3. Application Revenue and Trends by type of Application
12.6.4. Company Revenue and Product Analysis
12.6.5. Europe Segment Product type and Application Market Size
12.6.5.1. U.K
12.6.5.2. Germany
12.6.5.3. Italy
12.6.5.4. France
12.6.5.5. Netherlands
12.6.5.6. Belgium
12.6.5.7. Spain
12.6.5.8. Denmark
12.6.5.9. Rest of Europe
12.7. Protective Packaging – APAC Segment Research
12.8. APAC Market Research (Market Size -$Million / $Billion)
12.8.1. Segment type Size and Market Size Analysis
12.8.2. Revenue and Trends
12.8.3. Application Revenue and Trends by type of Application
12.8.4. Company Revenue and Product Analysis
12.8.5. APAC Segment – Product type and Application Market Size
12.8.5.1. China
12.8.5.2. Australia
12.8.5.3. Japan
12.8.5.4. South Korea
12.8.5.5. India
12.8.5.6. Taiwan
12.8.5.7. Malaysia
13. Protective Packaging Market - Entropy
13.1. New product launches
13.2. M&A's, collaborations, JVs and partnerships
14. Protective Packaging Market – Industry / Segment Competition landscape Premium
14.1. Market Share Analysis
14.1.1. Market Share by Country- Top companies
14.1.2. Market Share by Region- Top 10 companies
14.1.3. Market Share by type of Application – Top 10 companies
14.1.4. Market Share by type of Product / Product category- Top 10 companies
14.1.5. Market Share at global level- Top 10 companies
14.1.6. Best Practises for companies
15. Protective Packaging Market – Key Company List by Country Premium
16. Protective Packaging Market Company Analysis
16.1. Market Share, Company Revenue, Products, M&A, Developments
16.2. Smurfit Kappa Group plc (Ireland)
16.3. RockTenn Company (U.S.)
16.4. Sealed Air Corporation (U.S.)
16.5. Sonoco Products Company (U.S.)
16.6. Huhtamaki OYJ (Finland)
16.7. Company 6
16.8. Company 7
16.9. Company 8
16.10. Company 9
16.11. Company 10 and more
"*Financials would be provided on a best efforts basis for private companies"
17. Protective Packaging Market - Appendix
17.1. Abbreviations
17.2. Sources
18. Protective Packaging Market - Methodology
18.1. Research Methodology
18.1.1. Company Expert Interviews
18.1.2. Industry Databases
18.1.3. Associations
18.1.4. Company News
18.1.5. Company Annual Reports
18.1.6. Application Trends
18.1.7. New Products and Product database
18.1.8. Company Transcripts
18.1.9. R&D Trends
18.1.10. Key Opinion Leaders Interviews
18.1.11. Supply and Demand Trends
List of Tables
Table 1: Protective Packaging Market Overview 2023-2030
Table 2: Protective Packaging Market Leader Analysis 2023-2030 (US$)
Table 3: Protective Packaging Market Product Analysis 2023-2030 (US$)
Table 4: Protective Packaging Market End User Analysis 2023-2030 (US$)
Table 5: Protective Packaging Market Patent Analysis 2013-2023* (US$)
Table 6: Protective Packaging Market Financial Analysis 2023-2030 (US$)
Table 7: Protective Packaging Market Driver Analysis 2023-2030 (US$)
Table 8: Protective Packaging Market Challenges Analysis 2023-2030 (US$)
Table 9: Protective Packaging Market Constraint Analysis 2023-2030 (US$)
Table 10: Protective Packaging Market Supplier Bargaining Power Analysis 2023-2030 (US$)
Table 11: Protective Packaging Market Buyer Bargaining Power Analysis 2023-2030 (US$)
Table 12: Protective Packaging Market Threat of Substitutes Analysis 2023-2030 (US$)
Table 13: Protective Packaging Market Threat of New Entrants Analysis 2023-2030 (US$)
Table 14: Protective Packaging Market Degree of Competition Analysis 2023-2030 (US$)
Table 15: Protective Packaging Market Value Chain Analysis 2023-2030 (US$)
Table 16: Protective Packaging Market Pricing Analysis 2023-2030 (US$)
Table 17: Protective Packaging Market Opportunities Analysis 2023-2030 (US$)
Table 18: Protective Packaging Market Product Life Cycle Analysis 2023-2030 (US$)
Table 19: Protective Packaging Market Supplier Analysis 2023-2030 (US$)
Table 20: Protective Packaging Market Distributor Analysis 2023-2030 (US$)
Table 21: Protective Packaging Market Trend Analysis 2023-2030 (US$)
Table 22: Protective Packaging Market Size 2023 (US$)
Table 23: Protective Packaging Market Forecast Analysis 2023-2030 (US$)
Table 24: Protective Packaging Market Sales Forecast Analysis 2023-2030 (Units)
Table 25: Protective Packaging Market, Revenue & Volume, By Type, 2023-2030 ($)
Table 26: Protective Packaging Market By Type, Revenue & Volume, By Corrugated, 2023-2030 ($)
Table 27: Protective Packaging Market By Type, Revenue & Volume, By Solid Fibre Board, 2023-2030 ($)
Table 28: Protective Packaging Market By Type, Revenue & Volume, By Molded Pulp, 2023-2030 ($)
Table 29: Protective Packaging Market By Type, Revenue & Volume, By Fabricated Foam, 2023-2030 ($)
Table 30: Protective Packaging Market By Type, Revenue & Volume, By Molded EPS, 2023-2030 ($)
Table 31: Protective Packaging Market, Revenue & Volume, By Material, 2023-2030 ($)
Table 32: Protective Packaging Market By Material, Revenue & Volume, By Foam, 2023-2030 ($)
Table 33: Protective Packaging Market By Material, Revenue & Volume, By Paper, 2023-2030 ($)
Table 34: Protective Packaging Market By Material, Revenue & Volume, By Paper Board, 2023-2030 ($)
Table 35: Protective Packaging Market By Material, Revenue & Volume, By Plastic, 2023-2030 ($)
Table 36: Protective Packaging Market, Revenue & Volume, By Function, 2023-2030 ($)
Table 37: Protective Packaging Market By Function, Revenue & Volume, By Cushion, 2023-2030 ($)
Table 38: Protective Packaging Market By Function, Revenue & Volume, By Void-Fill, 2023-2030 ($)
Table 39: Protective Packaging Market By Function, Revenue & Volume, By Blocking & Bracing, 2023-2030 ($)
Table 40: Protective Packaging Market By Function, Revenue & Volume, By Surface Protection, 2023-2030 ($)
Table 41: Protective Packaging Market By Function, Revenue & Volume, By Containment, 2023-2030 ($)
Table 42: Protective Packaging Market, Revenue & Volume, By Industry, 2023-2030 ($)
Table 43: Protective Packaging Market By Industry, Revenue & Volume, By Agriculture, 2023-2030 ($)
Table 44: Protective Packaging Market By Industry, Revenue & Volume, By Food & Beverages, 2023-2030 ($)
Table 45: Protective Packaging Market By Industry, Revenue & Volume, By Pharmaceuticals, 2023-2030 ($)
Table 46: Protective Packaging Market By Industry, Revenue & Volume, By Automotive, 2023-2030 ($)
Table 47: Protective Packaging Market By Industry, Revenue & Volume, By Construction, 2023-2030 ($)
Table 48: North America Protective Packaging Market, Revenue & Volume, By Type, 2023-2030 ($)
Table 49: North America Protective Packaging Market, Revenue & Volume, By Material, 2023-2030 ($)
Table 50: North America Protective Packaging Market, Revenue & Volume, By Function, 2023-2030 ($)
Table 51: North America Protective Packaging Market, Revenue & Volume, By Industry, 2023-2030 ($)
Table 52: South america Protective Packaging Market, Revenue & Volume, By Type, 2023-2030 ($)
Table 53: South america Protective Packaging Market, Revenue & Volume, By Material, 2023-2030 ($)
Table 54: South america Protective Packaging Market, Revenue & Volume, By Function, 2023-2030 ($)
Table 55: South america Protective Packaging Market, Revenue & Volume, By Industry, 2023-2030 ($)
Table 56: Europe Protective Packaging Market, Revenue & Volume, By Type, 2023-2030 ($)
Table 57: Europe Protective Packaging Market, Revenue & Volume, By Material, 2023-2030 ($)
Table 58: Europe Protective Packaging Market, Revenue & Volume, By Function, 2023-2030 ($)
Table 59: Europe Protective Packaging Market, Revenue & Volume, By Industry, 2023-2030 ($)
Table 60: APAC Protective Packaging Market, Revenue & Volume, By Type, 2023-2030 ($)
Table 61: APAC Protective Packaging Market, Revenue & Volume, By Material, 2023-2030 ($)
Table 62: APAC Protective Packaging Market, Revenue & Volume, By Function, 2023-2030 ($)
Table 63: APAC Protective Packaging Market, Revenue & Volume, By Industry, 2023-2030 ($)
Table 64: Middle East & Africa Protective Packaging Market, Revenue & Volume, By Type, 2023-2030 ($)
Table 65: Middle East & Africa Protective Packaging Market, Revenue & Volume, By Material, 2023-2030 ($)
Table 66: Middle East & Africa Protective Packaging Market, Revenue & Volume, By Function, 2023-2030 ($)
Table 67: Middle East & Africa Protective Packaging Market, Revenue & Volume, By Industry, 2023-2030 ($)
Table 68: Russia Protective Packaging Market, Revenue & Volume, By Type, 2023-2030 ($)
Table 69: Russia Protective Packaging Market, Revenue & Volume, By Material, 2023-2030 ($)
Table 70: Russia Protective Packaging Market, Revenue & Volume, By Function, 2023-2030 ($)
Table 71: Russia Protective Packaging Market, Revenue & Volume, By Industry, 2023-2030 ($)
Table 72: Israel Protective Packaging Market, Revenue & Volume, By Type, 2023-2030 ($)
Table 73: Israel Protective Packaging Market, Revenue & Volume, By Material, 2023-2030 ($)
Table 74: Israel Protective Packaging Market, Revenue & Volume, By Function, 2023-2030 ($)
Table 75: Israel Protective Packaging Market, Revenue & Volume, By Industry, 2023-2030 ($)
Table 76: Top Companies 2023 (US$) Protective Packaging Market, Revenue & Volume
Table 77: Product Launch 2023-2030 Protective Packaging Market, Revenue & Volume
Table 78: Mergers & Acquistions 2023-2030 Protective Packaging Market, Revenue & Volume
List of Figures
Figure 1: Overview of Protective Packaging Market 2023-2030
Figure 2: Market Share Analysis for Protective Packaging Market 2023 (US$)
Figure 3: Product Comparison in Protective Packaging Market 2023-2030 (US$)
Figure 4: End User Profile for Protective Packaging Market 2023-2030 (US$)
Figure 5: Patent Application and Grant in Protective Packaging Market 2013-2023* (US$)
Figure 6: Top 5 Companies Financial Analysis in Protective Packaging Market 2023-2030 (US$)
Figure 7: Market Entry Strategy in Protective Packaging Market 2023-2030
Figure 8: Ecosystem Analysis in Protective Packaging Market 2023
Figure 9: Average Selling Price in Protective Packaging Market 2023-2030
Figure 10: Top Opportunites in Protective Packaging Market 2023-2030
Figure 11: Market Life Cycle Analysis in Protective Packaging Market
Figure 12: GlobalBy Type Protective Packaging Market Revenue, 2023-2030 ($)
Figure 13: GlobalBy Material Protective Packaging Market Revenue, 2023-2030 ($)
Figure 14: GlobalBy Function Protective Packaging Market Revenue, 2023-2030 ($)
Figure 15: GlobalBy Industry Protective Packaging Market Revenue, 2023-2030 ($)
Figure 16: Global Protective Packaging Market - By Geography
Figure 17: Global Protective Packaging Market Value & Volume, By Geography, 2023-2030 ($)
Figure 18: Global Protective Packaging Market CAGR, By Geography, 2023-2030 (%)
Figure 19: North America Protective Packaging Market Value & Volume, 2023-2030 ($)
Figure 20: US Protective Packaging Market Value & Volume, 2023-2030 ($)
Figure 21: US GDP and Population, 2023-2030 ($)
Figure 22: US GDP – Composition of 2023, By Sector of Origin
Figure 23: US Export and Import Value & Volume, 2023-2030 ($)
Figure 24: Canada Protective Packaging Market Value & Volume, 2023-2030 ($)
Figure 25: Canada GDP and Population, 2023-2030 ($)
Figure 26: Canada GDP – Composition of 2023, By Sector of Origin
Figure 27: Canada Export and Import Value & Volume, 2023-2030 ($)
Figure 28: Mexico Protective Packaging Market Value & Volume, 2023-2030 ($)
Figure 29: Mexico GDP and Population, 2023-2030 ($)
Figure 30: Mexico GDP – Composition of 2023, By Sector of Origin
Figure 31: Mexico Export and Import Value & Volume, 2023-2030 ($)
Figure 32: South America Protective Packaging Market Value & Volume, 2023-2030 ($)
Figure 33: Brazil Protective Packaging Market Value & Volume, 2023-2030 ($)
Figure 34: Brazil GDP and Population, 2023-2030 ($)
Figure 35: Brazil GDP – Composition of 2023, By Sector of Origin
Figure 36: Brazil Export and Import Value & Volume, 2023-2030 ($)
Figure 37: Venezuela Protective Packaging Market Value & Volume, 2023-2030 ($)
Figure 38: Venezuela GDP and Population, 2023-2030 ($)
Figure 39: Venezuela GDP – Composition of 2023, By Sector of Origin
Figure 40: Venezuela Export and Import Value & Volume, 2023-2030 ($)
Figure 41: Argentina Protective Packaging Market Value & Volume, 2023-2030 ($)
Figure 42: Argentina GDP and Population, 2023-2030 ($)
Figure 43: Argentina GDP – Composition of 2023, By Sector of Origin
Figure 44: Argentina Export and Import Value & Volume, 2023-2030 ($)
Figure 45: Ecuador Protective Packaging Market Value & Volume, 2023-2030 ($)
Figure 46: Ecuador GDP and Population, 2023-2030 ($)
Figure 47: Ecuador GDP – Composition of 2023, By Sector of Origin
Figure 48: Ecuador Export and Import Value & Volume, 2023-2030 ($)
Figure 49: Peru Protective Packaging Market Value & Volume, 2023-2030 ($)
Figure 50: Peru GDP and Population, 2023-2030 ($)
Figure 51: Peru GDP – Composition of 2023, By Sector of Origin
Figure 52: Peru Export and Import Value & Volume, 2023-2030 ($)
Figure 53: Colombia Protective Packaging Market Value & Volume, 2023-2030 ($)
Figure 54: Colombia GDP and Population, 2023-2030 ($)
Figure 55: Colombia GDP – Composition of 2023, By Sector of Origin
Figure 56: Colombia Export and Import Value & Volume, 2023-2030 ($)
Figure 57: Costa Rica Protective Packaging Market Value & Volume, 2023-2030 ($)
Figure 58: Costa Rica GDP and Population, 2023-2030 ($)
Figure 59: Costa Rica GDP – Composition of 2023, By Sector of Origin
Figure 60: Costa Rica Export and Import Value & Volume, 2023-2030 ($)
Figure 61: Europe Protective Packaging Market Value & Volume, 2023-2030 ($)
Figure 62: U.K Protective Packaging Market Value & Volume, 2023-2030 ($)
Figure 63: U.K GDP and Population, 2023-2030 ($)
Figure 64: U.K GDP – Composition of 2023, By Sector of Origin
Figure 65: U.K Export and Import Value & Volume, 2023-2030 ($)
Figure 66: Germany Protective Packaging Market Value & Volume, 2023-2030 ($)
Figure 67: Germany GDP and Population, 2023-2030 ($)
Figure 68: Germany GDP – Composition of 2023, By Sector of Origin
Figure 69: Germany Export and Import Value & Volume, 2023-2030 ($)
Figure 70: Italy Protective Packaging Market Value & Volume, 2023-2030 ($)
Figure 71: Italy GDP and Population, 2023-2030 ($)
Figure 72: Italy GDP – Composition of 2023, By Sector of Origin
Figure 73: Italy Export and Import Value & Volume, 2023-2030 ($)
Figure 74: France Protective Packaging Market Value & Volume, 2023-2030 ($)
Figure 75: France GDP and Population, 2023-2030 ($)
Figure 76: France GDP – Composition of 2023, By Sector of Origin
Figure 77: France Export and Import Value & Volume, 2023-2030 ($)
Figure 78: Netherlands Protective Packaging Market Value & Volume, 2023-2030 ($)
Figure 79: Netherlands GDP and Population, 2023-2030 ($)
Figure 80: Netherlands GDP – Composition of 2023, By Sector of Origin
Figure 81: Netherlands Export and Import Value & Volume, 2023-2030 ($)
Figure 82: Belgium Protective Packaging Market Value & Volume, 2023-2030 ($)
Figure 83: Belgium GDP and Population, 2023-2030 ($)
Figure 84: Belgium GDP – Composition of 2023, By Sector of Origin
Figure 85: Belgium Export and Import Value & Volume, 2023-2030 ($)
Figure 86: Spain Protective Packaging Market Value & Volume, 2023-2030 ($)
Figure 87: Spain GDP and Population, 2023-2030 ($)
Figure 88: Spain GDP – Composition of 2023, By Sector of Origin
Figure 89: Spain Export and Import Value & Volume, 2023-2030 ($)
Figure 90: Denmark Protective Packaging Market Value & Volume, 2023-2030 ($)
Figure 91: Denmark GDP and Population, 2023-2030 ($)
Figure 92: Denmark GDP – Composition of 2023, By Sector of Origin
Figure 93: Denmark Export and Import Value & Volume, 2023-2030 ($)
Figure 94: APAC Protective Packaging Market Value & Volume, 2023-2030 ($)
Figure 95: China Protective Packaging Market Value & Volume, 2023-2030
Figure 96: China GDP and Population, 2023-2030 ($)
Figure 97: China GDP – Composition of 2023, By Sector of Origin
Figure 98: China Export and Import Value & Volume, 2023-2030 ($) Protective Packaging Market China Export and Import Value & Volume, 2023-2030 ($)
Figure 99: Australia Protective Packaging Market Value & Volume, 2023-2030 ($)
Figure 100: Australia GDP and Population, 2023-2030 ($)
Figure 101: Australia GDP – Composition of 2023, By Sector of Origin
Figure 102: Australia Export and Import Value & Volume, 2023-2030 ($)
Figure 103: South Korea Protective Packaging Market Value & Volume, 2023-2030 ($)
Figure 104: South Korea GDP and Population, 2023-2030 ($)
Figure 105: South Korea GDP – Composition of 2023, By Sector of Origin
Figure 106: South Korea Export and Import Value & Volume, 2023-2030 ($)
Figure 107: India Protective Packaging Market Value & Volume, 2023-2030 ($)
Figure 108: India GDP and Population, 2023-2030 ($)
Figure 109: India GDP – Composition of 2023, By Sector of Origin
Figure 110: India Export and Import Value & Volume, 2023-2030 ($)
Figure 111: Taiwan Protective Packaging Market Value & Volume, 2023-2030 ($)
Figure 112: Taiwan GDP and Population, 2023-2030 ($)
Figure 113: Taiwan GDP – Composition of 2023, By Sector of Origin
Figure 114: Taiwan Export and Import Value & Volume, 2023-2030 ($)
Figure 115: Malaysia Protective Packaging Market Value & Volume, 2023-2030 ($)
Figure 116: Malaysia GDP and Population, 2023-2030 ($)
Figure 117: Malaysia GDP – Composition of 2023, By Sector of Origin
Figure 118: Malaysia Export and Import Value & Volume, 2023-2030 ($)
Figure 119: Hong Kong Protective Packaging Market Value & Volume, 2023-2030 ($)
Figure 120: Hong Kong GDP and Population, 2023-2030 ($)
Figure 121: Hong Kong GDP – Composition of 2023, By Sector of Origin
Figure 122: Hong Kong Export and Import Value & Volume, 2023-2030 ($)
Figure 123: Middle East & Africa Protective Packaging Market Middle East & Africa 3D Printing Market Value & Volume, 2023-2030 ($)
Figure 124: Russia Protective Packaging Market Value & Volume, 2023-2030 ($)
Figure 125: Russia GDP and Population, 2023-2030 ($)
Figure 126: Russia GDP – Composition of 2023, By Sector of Origin
Figure 127: Russia Export and Import Value & Volume, 2023-2030 ($)
Figure 128: Israel Protective Packaging Market Value & Volume, 2023-2030 ($)
Figure 129: Israel GDP and Population, 2023-2030 ($)
Figure 130: Israel GDP – Composition of 2023, By Sector of Origin
Figure 131: Israel Export and Import Value & Volume, 2023-2030 ($)
Figure 132: Entropy Share, By Strategies, 2023-2030* (%) Protective Packaging Market
Figure 133: Developments, 2023-2030* Protective Packaging Market
Figure 134: Company 1 Protective Packaging Market Net Revenue, By Years, 2023-2030* ($)
Figure 135: Company 1 Protective Packaging Market Net Revenue Share, By Business segments, 2023 (%)
Figure 136: Company 1 Protective Packaging Market Net Sales Share, By Geography, 2023 (%)
Figure 137: Company 2 Protective Packaging Market Net Revenue, By Years, 2023-2030* ($)
Figure 138: Company 2 Protective Packaging Market Net Revenue Share, By Business segments, 2023 (%)
Figure 139: Company 2 Protective Packaging Market Net Sales Share, By Geography, 2023 (%)
Figure 140: Company 3 Protective Packaging Market Net Revenue, By Years, 2023-2030* ($)
Figure 141: Company 3 Protective Packaging Market Net Revenue Share, By Business segments, 2023 (%)
Figure 142: Company 3 Protective Packaging Market Net Sales Share, By Geography, 2023 (%)
Figure 143: Company 4 Protective Packaging Market Net Revenue, By Years, 2023-2030* ($)
Figure 144: Company 4 Protective Packaging Market Net Revenue Share, By Business segments, 2023 (%)
Figure 145: Company 4 Protective Packaging Market Net Sales Share, By Geography, 2023 (%)
Figure 146: Company 5 Protective Packaging Market Net Revenue, By Years, 2023-2030* ($)
Figure 147: Company 5 Protective Packaging Market Net Revenue Share, By Business segments, 2023 (%)
Figure 148: Company 5 Protective Packaging Market Net Sales Share, By Geography, 2023 (%)
Figure 149: Company 6 Protective Packaging Market Net Revenue, By Years, 2023-2030* ($)
Figure 150: Company 6 Protective Packaging Market Net Revenue Share, By Business segments, 2023 (%)
Figure 151: Company 6 Protective Packaging Market Net Sales Share, By Geography, 2023 (%)
Figure 152: Company 7 Protective Packaging Market Net Revenue, By Years, 2023-2030* ($)
Figure 153: Company 7 Protective Packaging Market Net Revenue Share, By Business segments, 2023 (%)
Figure 154: Company 7 Protective Packaging Market Net Sales Share, By Geography, 2023 (%)
Figure 155: Company 8 Protective Packaging Market Net Revenue, By Years, 2023-2030* ($)
Figure 156: Company 8 Protective Packaging Market Net Revenue Share, By Business segments, 2023 (%)
Figure 157: Company 8 Protective Packaging Market Net Sales Share, By Geography, 2023 (%)
Figure 158: Company 9 Protective Packaging Market Net Revenue, By Years, 2023-2030* ($)
Figure 159: Company 9 Protective Packaging Market Net Revenue Share, By Business segments, 2023 (%)
Figure 160: Company 9 Protective Packaging Market Net Sales Share, By Geography, 2023 (%)
Figure 161: Company 10 Protective Packaging Market Net Revenue, By Years, 2023-2030* ($)
Figure 162: Company 10 Protective Packaging Market Net Revenue Share, By Business segments, 2023 (%)
Figure 163: Company 10 Protective Packaging Market Net Sales Share, By Geography, 2023 (%)
Figure 164: Company 11 Protective Packaging Market Net Revenue, By Years, 2023-2030* ($)
Figure 165: Company 11 Protective Packaging Market Net Revenue Share, By Business segments, 2023 (%)
Figure 166: Company 11 Protective Packaging Market Net Sales Share, By Geography, 2023 (%)
Figure 167: Company 12 Protective Packaging Market Net Revenue, By Years, 2023-2030* ($)
Figure 168: Company 12 Protective Packaging Market Net Revenue Share, By Business segments, 2023 (%)
Figure 169: Company 12 Protective Packaging Market Net Sales Share, By Geography, 2023 (%)
Figure 170: Company 13 Protective Packaging Market Net Revenue, By Years, 2023-2030* ($)
Figure 171: Company 13 Protective Packaging Market Net Revenue Share, By Business segments, 2023 (%)
Figure 172: Company 13 Protective Packaging Market Net Sales Share, By Geography, 2023 (%)
Figure 173: Company 14 Protective Packaging Market Net Revenue, By Years, 2023-2030* ($)
Figure 174: Company 14 Protective Packaging Market Net Revenue Share, By Business segments, 2023 (%)
Figure 175: Company 14 Protective Packaging Market Net Sales Share, By Geography, 2023 (%)
Figure 176: Company 15 Protective Packaging Market Net Revenue, By Years, 2023-2030* ($)
Figure 177: Company 15 Protective Packaging Market Net Revenue Share, By Business segments, 2023 (%)
Figure 178: Company 15 Protective Packaging Market Net Sales Share, By Geography, 2023 (%)