 Email
Email Print
Print


Waste Paper Management Market - Forecast(2024 - 2030)
Paper is an essential commodity with which all of us are closely associated in our daily life. Its socio-economic importance in the overall development of the country holds a significant place; this industry is directly linked with the industrial and educational growth in the country. Waste paper management can be accomplished by recycling the waste paper. Recycling is process of reusing the used materials (waste) by converting it into new and useful products. This is done to reduce the consumption of raw materials that would have been used. Recycling consumes less energy and offers a great way of controlling air, water and land pollution. Paper waste that can be recycled include books, newspapers, magazines, cardboard boxes and envelopes.
The waste paper management market is primarily driven by socio-economic factors such as increasing public awareness about environment. Moreover, Laws and regulations enforced by government is another major factor that compels paper and paper product manufacturers to reuse and recycle waste papers. Climate change across the world is also an emerging key driver for this market.
The global market for waste paper management is classified by paper grade, by type of management, by source of waste paper and by type of service. The market by paper grade has been sub-segmented to old corrugated containers, mixed paper, newspaper, and high grade de-inked paper and pulp substitutes among others. Similarly, all other segments are also divided into sub segments to provide a holistic view of the market. The market has also been analyzed by different geographical regions wherein country wise analysis has been provided.
The global market for waste paper management was estimated to be $XX billion in 2015. The global market for waste paper management is estimated to grow at a CAGR of XX% and is forecast to reach $XX billion by 2021. The waste paper management is forecast to have the highest growth of XX% during the forecast period 2016-2021. Americas and APAC together are estimated to occupy a share of more than XX% in 2015.
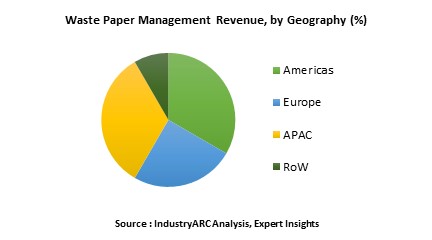
APAC is the leading market for waste paper management in 2015. China and India are emerging as growth economies. Growing economies, increasing population, and the resultant disposable income of people were said to be acting as the main drivers for increased opportunities in these countries followed by Americas and Europe. APAC accounts to XX% of the global market for waste paper management and is the fastest growing market followed by Americas.
Apart from this, this report also looks into whole value chain, pricing analysis opportunity analysis of this market. This report also covers the major patents and also the constraints and challenges faced by this market. Competitive landscape for each of the product types is highlighted and market players are profiled with attributes of Company Overview, Financial Overview, Business Strategies, Product Portfolio and Recent Developments. The report contains the most detailed and in-depth segmentation of the waste paper management market.
Sample Companies Profiled in this Report are:
The waste paper management market is primarily driven by socio-economic factors such as increasing public awareness about environment. Moreover, Laws and regulations enforced by government is another major factor that compels paper and paper product manufacturers to reuse and recycle waste papers. Climate change across the world is also an emerging key driver for this market.
The global market for waste paper management is classified by paper grade, by type of management, by source of waste paper and by type of service. The market by paper grade has been sub-segmented to old corrugated containers, mixed paper, newspaper, and high grade de-inked paper and pulp substitutes among others. Similarly, all other segments are also divided into sub segments to provide a holistic view of the market. The market has also been analyzed by different geographical regions wherein country wise analysis has been provided.
The global market for waste paper management was estimated to be $XX billion in 2015. The global market for waste paper management is estimated to grow at a CAGR of XX% and is forecast to reach $XX billion by 2021. The waste paper management is forecast to have the highest growth of XX% during the forecast period 2016-2021. Americas and APAC together are estimated to occupy a share of more than XX% in 2015.
APAC is the leading market for waste paper management in 2015. China and India are emerging as growth economies. Growing economies, increasing population, and the resultant disposable income of people were said to be acting as the main drivers for increased opportunities in these countries followed by Americas and Europe. APAC accounts to XX% of the global market for waste paper management and is the fastest growing market followed by Americas.
Apart from this, this report also looks into whole value chain, pricing analysis opportunity analysis of this market. This report also covers the major patents and also the constraints and challenges faced by this market. Competitive landscape for each of the product types is highlighted and market players are profiled with attributes of Company Overview, Financial Overview, Business Strategies, Product Portfolio and Recent Developments. The report contains the most detailed and in-depth segmentation of the waste paper management market.
Sample Companies Profiled in this Report are:
- International Paper Company (U.S.)
- Veolia Environnement S.A. (France)
- Mondi Group (South Africa)
- Waste Management, Inc. (U.S.)
- Georgia-Pacific LLC (U.S.)
- 10+.
1. Market Overview
2. Executive Summary
3. Waste Paper Management Landscape
3.1. Market Share Analysis
3.2. Comparative Analysis
3.2.1. Product Benchmarking
3.2.2. End user Profiling
3.2.3. Top 5 Financials Analysis
4. Waste Paper Management Forces
4.1. Market Drivers
4.2. Market Constraints & Challenges
4.3. Attractiveness of the Waste Paper Management
4.3.1. Power of Suppliers
4.3.2. Threats From New Entrants
4.3.3. Power of Buyer
4.3.4. Threat From Substitute Product
4.3.5. Degree of Competition
5. Waste Paper Management-Strategic Analysis
5.1. Waste Paper Management - Value Chain Analysis
5.2. Pricing Analysis
5.3. Opportunity Analysis
5.4. Product Life Cycle
5.5. Suppliers and Distributors
5.6. SWOT Analysis
6. Waste Paper Management – By Paper Grade
6.1. Introduction
6.2. Old Corrugated Containers
6.3. Mixed Paper
6.4. Newspaper
6.5. High Grade De-Inked Paper
6.6. Pulp Substitute
6.7. Others
7. Waste Paper Management - By Type
7.1. Introduction
7.2. Reduce
7.3. Replace
7.4. Reuse
7.5. Recycle
7.6. Recover
7.7. Others
8. Waste Paper Management - By Source Of Waste Paper
8.1. Introduction
8.2. Residential
8.3. Industrial
8.4. Commercial
8.5. Institutional
8.6. Others
9. Waste Paper Management - By Service
9.1. Introduction
9.2. Collection and Transportation
9.3. Storage
9.4. Segregation
9.5. Processing
10. Waste Paper Management -By Geography
10.1. Americas
10.1.1. U.S.
10.1.2. Canada
10.1.3. Mexico
10.1.4. Brazil
10.1.5. Others
10.2. Europe
10.2.1. U.K.
10.2.2. Germany
10.2.3. Italy
10.2.4. France
10.2.5. Spain
10.2.6. Others
10.3. Asia
10.3.1. China
10.3.2. South Korea
10.3.3. Japan
10.3.4. India
10.3.5. Others
10.4. Rest of The World (RoW)
11. Waste Paper Management Entropy
11.1. New Product Developments
11.2. Mergers and Acquisitions
12. Company Profiles
*More than 10 Companies are profiled in this Research Report*
"*Financials would be provided on a best efforts basis for private companies"
2. Executive Summary
3. Waste Paper Management Landscape
3.1. Market Share Analysis
3.2. Comparative Analysis
3.2.1. Product Benchmarking
3.2.2. End user Profiling
3.2.3. Top 5 Financials Analysis
4. Waste Paper Management Forces
4.1. Market Drivers
4.2. Market Constraints & Challenges
4.3. Attractiveness of the Waste Paper Management
4.3.1. Power of Suppliers
4.3.2. Threats From New Entrants
4.3.3. Power of Buyer
4.3.4. Threat From Substitute Product
4.3.5. Degree of Competition
5. Waste Paper Management-Strategic Analysis
5.1. Waste Paper Management - Value Chain Analysis
5.2. Pricing Analysis
5.3. Opportunity Analysis
5.4. Product Life Cycle
5.5. Suppliers and Distributors
5.6. SWOT Analysis
6. Waste Paper Management – By Paper Grade
6.1. Introduction
6.2. Old Corrugated Containers
6.3. Mixed Paper
6.4. Newspaper
6.5. High Grade De-Inked Paper
6.6. Pulp Substitute
6.7. Others
7. Waste Paper Management - By Type
7.1. Introduction
7.2. Reduce
7.3. Replace
7.4. Reuse
7.5. Recycle
7.6. Recover
7.7. Others
8. Waste Paper Management - By Source Of Waste Paper
8.1. Introduction
8.2. Residential
8.3. Industrial
8.4. Commercial
8.5. Institutional
8.6. Others
9. Waste Paper Management - By Service
9.1. Introduction
9.2. Collection and Transportation
9.3. Storage
9.4. Segregation
9.5. Processing
10. Waste Paper Management -By Geography
10.1. Americas
10.1.1. U.S.
10.1.2. Canada
10.1.3. Mexico
10.1.4. Brazil
10.1.5. Others
10.2. Europe
10.2.1. U.K.
10.2.2. Germany
10.2.3. Italy
10.2.4. France
10.2.5. Spain
10.2.6. Others
10.3. Asia
10.3.1. China
10.3.2. South Korea
10.3.3. Japan
10.3.4. India
10.3.5. Others
10.4. Rest of The World (RoW)
11. Waste Paper Management Entropy
11.1. New Product Developments
11.2. Mergers and Acquisitions
12. Company Profiles
12.1. Company 1
12.2. Company 2
12.3. Company 3
12.4. Company 4
12.5. Company 5
12.6. Company 6
12.7. Company 7
12.8. Company 8
12.9. Company 9
12.10. Company 10
"*Financials would be provided on a best efforts basis for private companies"
13. Appendix
13.1. List of Abbreviations
13.2. Sources
13.3. Research Methodology
13.4. Expert Insights
13.5. Disclaimer
List of Tables
Table 1: Waste Paper Management Market Overview 2023-2030
Table 2: Waste Paper Management Market Leader Analysis 2023-2030 (US$)
Table 3: Waste Paper Management Market Product Analysis 2023-2030 (US$)
Table 4: Waste Paper Management Market End User Analysis 2023-2030 (US$)
Table 5: Waste Paper Management Market Patent Analysis 2013-2023* (US$)
Table 6: Waste Paper Management Market Financial Analysis 2023-2030 (US$)
Table 7: Waste Paper Management Market Driver Analysis 2023-2030 (US$)
Table 8: Waste Paper Management Market Challenges Analysis 2023-2030 (US$)
Table 9: Waste Paper Management Market Constraint Analysis 2023-2030 (US$)
Table 10: Waste Paper Management Market Supplier Bargaining Power Analysis 2023-2030 (US$)
Table 11: Waste Paper Management Market Buyer Bargaining Power Analysis 2023-2030 (US$)
Table 12: Waste Paper Management Market Threat of Substitutes Analysis 2023-2030 (US$)
Table 13: Waste Paper Management Market Threat of New Entrants Analysis 2023-2030 (US$)
Table 14: Waste Paper Management Market Degree of Competition Analysis 2023-2030 (US$)
Table 15: Waste Paper Management Market Value Chain Analysis 2023-2030 (US$)
Table 16: Waste Paper Management Market Pricing Analysis 2023-2030 (US$)
Table 17: Waste Paper Management Market Opportunities Analysis 2023-2030 (US$)
Table 18: Waste Paper Management Market Product Life Cycle Analysis 2023-2030 (US$)
Table 19: Waste Paper Management Market Supplier Analysis 2023-2030 (US$)
Table 20: Waste Paper Management Market Distributor Analysis 2023-2030 (US$)
Table 21: Waste Paper Management Market Trend Analysis 2023-2030 (US$)
Table 22: Waste Paper Management Market Size 2023 (US$)
Table 23: Waste Paper Management Market Forecast Analysis 2023-2030 (US$)
Table 24: Waste Paper Management Market Sales Forecast Analysis 2023-2030 (Units)
Table 25: Waste Paper Management Market, Revenue & Volume, By Type, 2023-2030 ($)
Table 26: Waste Paper Management Market By Type, Revenue & Volume, By Reduce, 2023-2030 ($)
Table 27: Waste Paper Management Market By Type, Revenue & Volume, By Replace, 2023-2030 ($)
Table 28: Waste Paper Management Market By Type, Revenue & Volume, By Reuse, 2023-2030 ($)
Table 29: Waste Paper Management Market By Type, Revenue & Volume, By Recycle, 2023-2030 ($)
Table 30: Waste Paper Management Market By Type, Revenue & Volume, By Recover, 2023-2030 ($)
Table 31: Waste Paper Management Market, Revenue & Volume, By Paper Grade, 2023-2030 ($)
Table 32: Waste Paper Management Market By Paper Grade, Revenue & Volume, By Old Corrugated Containers, 2023-2030 ($)
Table 33: Waste Paper Management Market By Paper Grade, Revenue & Volume, By Mixed Paper, 2023-2030 ($)
Table 34: Waste Paper Management Market By Paper Grade, Revenue & Volume, By Newspaper, 2023-2030 ($)
Table 35: Waste Paper Management Market By Paper Grade, Revenue & Volume, By High Grade De-Inked Paper, 2023-2030 ($)
Table 36: Waste Paper Management Market By Paper Grade, Revenue & Volume, By Pulp Substitute, 2023-2030 ($)
Table 37: Waste Paper Management Market, Revenue & Volume, By Source Of Waste Paper, 2023-2030 ($)
Table 38: Waste Paper Management Market By Source Of Waste Paper, Revenue & Volume, By Residential, 2023-2030 ($)
Table 39: Waste Paper Management Market By Source Of Waste Paper, Revenue & Volume, By Industrial, 2023-2030 ($)
Table 40: Waste Paper Management Market By Source Of Waste Paper, Revenue & Volume, By Commercial, 2023-2030 ($)
Table 41: Waste Paper Management Market By Source Of Waste Paper, Revenue & Volume, By Institutional, 2023-2030 ($)
Table 42: Waste Paper Management Market, Revenue & Volume, By Service, 2023-2030 ($)
Table 43: Waste Paper Management Market By Service, Revenue & Volume, By Collection and Transportation, 2023-2030 ($)
Table 44: Waste Paper Management Market By Service, Revenue & Volume, By Storage, 2023-2030 ($)
Table 45: Waste Paper Management Market By Service, Revenue & Volume, By Segregation, 2023-2030 ($)
Table 46: Waste Paper Management Market By Service, Revenue & Volume, By Processing, 2023-2030 ($)
Table 47: North America Waste Paper Management Market, Revenue & Volume, By Type, 2023-2030 ($)
Table 48: North America Waste Paper Management Market, Revenue & Volume, By Paper Grade, 2023-2030 ($)
Table 49: North America Waste Paper Management Market, Revenue & Volume, By Source Of Waste Paper, 2023-2030 ($)
Table 50: North America Waste Paper Management Market, Revenue & Volume, By Service, 2023-2030 ($)
Table 51: South america Waste Paper Management Market, Revenue & Volume, By Type, 2023-2030 ($)
Table 52: South america Waste Paper Management Market, Revenue & Volume, By Paper Grade, 2023-2030 ($)
Table 53: South america Waste Paper Management Market, Revenue & Volume, By Source Of Waste Paper, 2023-2030 ($)
Table 54: South america Waste Paper Management Market, Revenue & Volume, By Service, 2023-2030 ($)
Table 55: Europe Waste Paper Management Market, Revenue & Volume, By Type, 2023-2030 ($)
Table 56: Europe Waste Paper Management Market, Revenue & Volume, By Paper Grade, 2023-2030 ($)
Table 57: Europe Waste Paper Management Market, Revenue & Volume, By Source Of Waste Paper, 2023-2030 ($)
Table 58: Europe Waste Paper Management Market, Revenue & Volume, By Service, 2023-2030 ($)
Table 59: APAC Waste Paper Management Market, Revenue & Volume, By Type, 2023-2030 ($)
Table 60: APAC Waste Paper Management Market, Revenue & Volume, By Paper Grade, 2023-2030 ($)
Table 61: APAC Waste Paper Management Market, Revenue & Volume, By Source Of Waste Paper, 2023-2030 ($)
Table 62: APAC Waste Paper Management Market, Revenue & Volume, By Service, 2023-2030 ($)
Table 63: Middle East & Africa Waste Paper Management Market, Revenue & Volume, By Type, 2023-2030 ($)
Table 64: Middle East & Africa Waste Paper Management Market, Revenue & Volume, By Paper Grade, 2023-2030 ($)
Table 65: Middle East & Africa Waste Paper Management Market, Revenue & Volume, By Source Of Waste Paper, 2023-2030 ($)
Table 66: Middle East & Africa Waste Paper Management Market, Revenue & Volume, By Service, 2023-2030 ($)
Table 67: Russia Waste Paper Management Market, Revenue & Volume, By Type, 2023-2030 ($)
Table 68: Russia Waste Paper Management Market, Revenue & Volume, By Paper Grade, 2023-2030 ($)
Table 69: Russia Waste Paper Management Market, Revenue & Volume, By Source Of Waste Paper, 2023-2030 ($)
Table 70: Russia Waste Paper Management Market, Revenue & Volume, By Service, 2023-2030 ($)
Table 71: Israel Waste Paper Management Market, Revenue & Volume, By Type, 2023-2030 ($)
Table 72: Israel Waste Paper Management Market, Revenue & Volume, By Paper Grade, 2023-2030 ($)
Table 73: Israel Waste Paper Management Market, Revenue & Volume, By Source Of Waste Paper, 2023-2030 ($)
Table 74: Israel Waste Paper Management Market, Revenue & Volume, By Service, 2023-2030 ($)
Table 75: Top Companies 2023 (US$)Waste Paper Management Market, Revenue & Volume
Table 76: Product Launch 2023-2030Waste Paper Management Market, Revenue & Volume
Table 77: Mergers & Acquistions 2023-2030Waste Paper Management Market, Revenue & Volume
List of Figures
Figure 1: Overview of Waste Paper Management Market 2023-2030
Figure 2: Market Share Analysis for Waste Paper Management Market 2023 (US$)
Figure 3: Product Comparison in Waste Paper Management Market 2023-2030 (US$)
Figure 4: End User Profile for Waste Paper Management Market 2023-2030 (US$)
Figure 5: Patent Application and Grant in Waste Paper Management Market 2013-2023* (US$)
Figure 6: Top 5 Companies Financial Analysis in Waste Paper Management Market 2023-2030 (US$)
Figure 7: Market Entry Strategy in Waste Paper Management Market 2023-2030
Figure 8: Ecosystem Analysis in Waste Paper Management Market 2023
Figure 9: Average Selling Price in Waste Paper Management Market 2023-2030
Figure 10: Top Opportunites in Waste Paper Management Market 2023-2030
Figure 11: Market Life Cycle Analysis in Waste Paper Management Market
Figure 12: GlobalBy TypeWaste Paper Management Market Revenue, 2023-2030 ($)
Figure 13: GlobalBy Paper GradeWaste Paper Management Market Revenue, 2023-2030 ($)
Figure 14: GlobalBy Source Of Waste PaperWaste Paper Management Market Revenue, 2023-2030 ($)
Figure 15: Global By ServiceWaste Paper Management Market Revenue, 2023-2030 ($)
Figure 16: Global Waste Paper Management Market - By Geography
Figure 17: Global Waste Paper Management Market Value & Volume, By Geography, 2023-2030 ($)
Figure 18: Global Waste Paper Management Market CAGR, By Geography, 2023-2030 (%)
Figure 19: North America Waste Paper Management Market Value & Volume, 2023-2030 ($)
Figure 20: US Waste Paper Management Market Value & Volume, 2023-2030 ($)
Figure 21: US GDP and Population, 2023-2030 ($)
Figure 22: US GDP – Composition of 2023, By Sector of Origin
Figure 23: US Export and Import Value & Volume, 2023-2030 ($)
Figure 24: Canada Waste Paper Management Market Value & Volume, 2023-2030 ($)
Figure 25: Canada GDP and Population, 2023-2030 ($)
Figure 26: Canada GDP – Composition of 2023, By Sector of Origin
Figure 27: Canada Export and Import Value & Volume, 2023-2030 ($)
Figure 28: Mexico Waste Paper Management Market Value & Volume, 2023-2030 ($)
Figure 29: Mexico GDP and Population, 2023-2030 ($)
Figure 30: Mexico GDP – Composition of 2023, By Sector of Origin
Figure 31: Mexico Export and Import Value & Volume, 2023-2030 ($)
Figure 32: South America Waste Paper Management Market Value & Volume, 2023-2030 ($)
Figure 33: Brazil Waste Paper Management Market Value & Volume, 2023-2030 ($)
Figure 34: Brazil GDP and Population, 2023-2030 ($)
Figure 35: Brazil GDP – Composition of 2023, By Sector of Origin
Figure 36: Brazil Export and Import Value & Volume, 2023-2030 ($)
Figure 37: Venezuela Waste Paper Management Market Value & Volume, 2023-2030 ($)
Figure 38: Venezuela GDP and Population, 2023-2030 ($)
Figure 39: Venezuela GDP – Composition of 2023, By Sector of Origin
Figure 40: Venezuela Export and Import Value & Volume, 2023-2030 ($)
Figure 41: Argentina Waste Paper Management Market Value & Volume, 2023-2030 ($)
Figure 42: Argentina GDP and Population, 2023-2030 ($)
Figure 43: Argentina GDP – Composition of 2023, By Sector of Origin
Figure 44: Argentina Export and Import Value & Volume, 2023-2030 ($)
Figure 45: Ecuador Waste Paper Management Market Value & Volume, 2023-2030 ($)
Figure 46: Ecuador GDP and Population, 2023-2030 ($)
Figure 47: Ecuador GDP – Composition of 2023, By Sector of Origin
Figure 48: Ecuador Export and Import Value & Volume, 2023-2030 ($)
Figure 49: Peru Waste Paper Management Market Value & Volume, 2023-2030 ($)
Figure 50: Peru GDP and Population, 2023-2030 ($)
Figure 51: Peru GDP – Composition of 2023, By Sector of Origin
Figure 52: Peru Export and Import Value & Volume, 2023-2030 ($)
Figure 53: Colombia Waste Paper Management Market Value & Volume, 2023-2030 ($)
Figure 54: Colombia GDP and Population, 2023-2030 ($)
Figure 55: Colombia GDP – Composition of 2023, By Sector of Origin
Figure 56: Colombia Export and Import Value & Volume, 2023-2030 ($)
Figure 57: Costa Rica Waste Paper Management Market Value & Volume, 2023-2030 ($)
Figure 58: Costa Rica GDP and Population, 2023-2030 ($)
Figure 59: Costa Rica GDP – Composition of 2023, By Sector of Origin
Figure 60: Costa Rica Export and Import Value & Volume, 2023-2030 ($)
Figure 61: Europe Waste Paper Management Market Value & Volume, 2023-2030 ($)
Figure 62: U.K Waste Paper Management Market Value & Volume, 2023-2030 ($)
Figure 63: U.K GDP and Population, 2023-2030 ($)
Figure 64: U.K GDP – Composition of 2023, By Sector of Origin
Figure 65: U.K Export and Import Value & Volume, 2023-2030 ($)
Figure 66: Germany Waste Paper Management Market Value & Volume, 2023-2030 ($)
Figure 67: Germany GDP and Population, 2023-2030 ($)
Figure 68: Germany GDP – Composition of 2023, By Sector of Origin
Figure 69: Germany Export and Import Value & Volume, 2023-2030 ($)
Figure 70: Italy Waste Paper Management Market Value & Volume, 2023-2030 ($)
Figure 71: Italy GDP and Population, 2023-2030 ($)
Figure 72: Italy GDP – Composition of 2023, By Sector of Origin
Figure 73: Italy Export and Import Value & Volume, 2023-2030 ($)
Figure 74: France Waste Paper Management Market Value & Volume, 2023-2030 ($)
Figure 75: France GDP and Population, 2023-2030 ($)
Figure 76: France GDP – Composition of 2023, By Sector of Origin
Figure 77: France Export and Import Value & Volume, 2023-2030 ($)
Figure 78: Netherlands Waste Paper Management Market Value & Volume, 2023-2030 ($)
Figure 79: Netherlands GDP and Population, 2023-2030 ($)
Figure 80: Netherlands GDP – Composition of 2023, By Sector of Origin
Figure 81: Netherlands Export and Import Value & Volume, 2023-2030 ($)
Figure 82: Belgium Waste Paper Management Market Value & Volume, 2023-2030 ($)
Figure 83: Belgium GDP and Population, 2023-2030 ($)
Figure 84: Belgium GDP – Composition of 2023, By Sector of Origin
Figure 85: Belgium Export and Import Value & Volume, 2023-2030 ($)
Figure 86: Spain Waste Paper Management Market Value & Volume, 2023-2030 ($)
Figure 87: Spain GDP and Population, 2023-2030 ($)
Figure 88: Spain GDP – Composition of 2023, By Sector of Origin
Figure 89: Spain Export and Import Value & Volume, 2023-2030 ($)
Figure 90: Denmark Waste Paper Management Market Value & Volume, 2023-2030 ($)
Figure 91: Denmark GDP and Population, 2023-2030 ($)
Figure 92: Denmark GDP – Composition of 2023, By Sector of Origin
Figure 93: Denmark Export and Import Value & Volume, 2023-2030 ($)
Figure 94: APAC Waste Paper Management Market Value & Volume, 2023-2030 ($)
Figure 95: China Waste Paper Management Market Value & Volume, 2023-2030
Figure 96: China GDP and Population, 2023-2030 ($)
Figure 97: China GDP – Composition of 2023, By Sector of Origin
Figure 98: China Export and Import Value & Volume, 2023-2030 ($)Waste Paper Management Market China Export and Import Value & Volume, 2023-2030 ($)
Figure 99: Australia Waste Paper Management Market Value & Volume, 2023-2030 ($)
Figure 100: Australia GDP and Population, 2023-2030 ($)
Figure 101: Australia GDP – Composition of 2023, By Sector of Origin
Figure 102: Australia Export and Import Value & Volume, 2023-2030 ($)
Figure 103: South Korea Waste Paper Management Market Value & Volume, 2023-2030 ($)
Figure 104: South Korea GDP and Population, 2023-2030 ($)
Figure 105: South Korea GDP – Composition of 2023, By Sector of Origin
Figure 106: South Korea Export and Import Value & Volume, 2023-2030 ($)
Figure 107: India Waste Paper Management Market Value & Volume, 2023-2030 ($)
Figure 108: India GDP and Population, 2023-2030 ($)
Figure 109: India GDP – Composition of 2023, By Sector of Origin
Figure 110: India Export and Import Value & Volume, 2023-2030 ($)
Figure 111: Taiwan Waste Paper Management Market Value & Volume, 2023-2030 ($)
Figure 112: Taiwan GDP and Population, 2023-2030 ($)
Figure 113: Taiwan GDP – Composition of 2023, By Sector of Origin
Figure 114: Taiwan Export and Import Value & Volume, 2023-2030 ($)
Figure 115: Malaysia Waste Paper Management Market Value & Volume, 2023-2030 ($)
Figure 116: Malaysia GDP and Population, 2023-2030 ($)
Figure 117: Malaysia GDP – Composition of 2023, By Sector of Origin
Figure 118: Malaysia Export and Import Value & Volume, 2023-2030 ($)
Figure 119: Hong Kong Waste Paper Management Market Value & Volume, 2023-2030 ($)
Figure 120: Hong Kong GDP and Population, 2023-2030 ($)
Figure 121: Hong Kong GDP – Composition of 2023, By Sector of Origin
Figure 122: Hong Kong Export and Import Value & Volume, 2023-2030 ($)
Figure 123: Middle East & Africa Waste Paper Management Market Middle East & Africa 3D Printing Market Value & Volume, 2023-2030 ($)
Figure 124: Russia Waste Paper Management Market Value & Volume, 2023-2030 ($)
Figure 125: Russia GDP and Population, 2023-2030 ($)
Figure 126: Russia GDP – Composition of 2023, By Sector of Origin
Figure 127: Russia Export and Import Value & Volume, 2023-2030 ($)
Figure 128: Israel Waste Paper Management Market Value & Volume, 2023-2030 ($)
Figure 129: Israel GDP and Population, 2023-2030 ($)
Figure 130: Israel GDP – Composition of 2023, By Sector of Origin
Figure 131: Israel Export and Import Value & Volume, 2023-2030 ($)
Figure 132: Entropy Share, By Strategies, 2023-2030* (%)Waste Paper Management Market
Figure 133: Developments, 2023-2030*Waste Paper Management Market
Figure 134: Company 1 Waste Paper Management Market Net Revenue, By Years, 2023-2030* ($)
Figure 135: Company 1 Waste Paper Management Market Net Revenue Share, By Business segments, 2023 (%)
Figure 136: Company 1 Waste Paper Management Market Net Sales Share, By Geography, 2023 (%)
Figure 137: Company 2 Waste Paper Management Market Net Revenue, By Years, 2023-2030* ($)
Figure 138: Company 2 Waste Paper Management Market Net Revenue Share, By Business segments, 2023 (%)
Figure 139: Company 2 Waste Paper Management Market Net Sales Share, By Geography, 2023 (%)
Figure 140: Company 3 Waste Paper Management Market Net Revenue, By Years, 2023-2030* ($)
Figure 141: Company 3 Waste Paper Management Market Net Revenue Share, By Business segments, 2023 (%)
Figure 142: Company 3 Waste Paper Management Market Net Sales Share, By Geography, 2023 (%)
Figure 143: Company 4 Waste Paper Management Market Net Revenue, By Years, 2023-2030* ($)
Figure 144: Company 4 Waste Paper Management Market Net Revenue Share, By Business segments, 2023 (%)
Figure 145: Company 4 Waste Paper Management Market Net Sales Share, By Geography, 2023 (%)
Figure 146: Company 5 Waste Paper Management Market Net Revenue, By Years, 2023-2030* ($)
Figure 147: Company 5 Waste Paper Management Market Net Revenue Share, By Business segments, 2023 (%)
Figure 148: Company 5 Waste Paper Management Market Net Sales Share, By Geography, 2023 (%)
Figure 149: Company 6 Waste Paper Management Market Net Revenue, By Years, 2023-2030* ($)
Figure 150: Company 6 Waste Paper Management Market Net Revenue Share, By Business segments, 2023 (%)
Figure 151: Company 6 Waste Paper Management Market Net Sales Share, By Geography, 2023 (%)
Figure 152: Company 7 Waste Paper Management Market Net Revenue, By Years, 2023-2030* ($)
Figure 153: Company 7 Waste Paper Management Market Net Revenue Share, By Business segments, 2023 (%)
Figure 154: Company 7 Waste Paper Management Market Net Sales Share, By Geography, 2023 (%)
Figure 155: Company 8 Waste Paper Management Market Net Revenue, By Years, 2023-2030* ($)
Figure 156: Company 8 Waste Paper Management Market Net Revenue Share, By Business segments, 2023 (%)
Figure 157: Company 8 Waste Paper Management Market Net Sales Share, By Geography, 2023 (%)
Figure 158: Company 9 Waste Paper Management Market Net Revenue, By Years, 2023-2030* ($)
Figure 159: Company 9 Waste Paper Management Market Net Revenue Share, By Business segments, 2023 (%)
Figure 160: Company 9 Waste Paper Management Market Net Sales Share, By Geography, 2023 (%)
Figure 161: Company 10 Waste Paper Management Market Net Revenue, By Years, 2023-2030* ($)
Figure 162: Company 10 Waste Paper Management Market Net Revenue Share, By Business segments, 2023 (%)
Figure 163: Company 10 Waste Paper Management Market Net Sales Share, By Geography, 2023 (%)
Figure 164: Company 11 Waste Paper Management Market Net Revenue, By Years, 2023-2030* ($)
Figure 165: Company 11 Waste Paper Management Market Net Revenue Share, By Business segments, 2023 (%)
Figure 166: Company 11 Waste Paper Management Market Net Sales Share, By Geography, 2023 (%)
Figure 167: Company 12 Waste Paper Management Market Net Revenue, By Years, 2023-2030* ($)
Figure 168: Company 12 Waste Paper Management Market Net Revenue Share, By Business segments, 2023 (%)
Figure 169: Company 12 Waste Paper Management Market Net Sales Share, By Geography, 2023 (%)
Figure 170: Company 13 Waste Paper Management Market Net Revenue, By Years, 2023-2030* ($)
Figure 171: Company 13 Waste Paper Management Market Net Revenue Share, By Business segments, 2023 (%)
Figure 172: Company 13 Waste Paper Management Market Net Sales Share, By Geography, 2023 (%)
Figure 173: Company 14 Waste Paper Management Market Net Revenue, By Years, 2023-2030* ($)
Figure 174: Company 14 Waste Paper Management Market Net Revenue Share, By Business segments, 2023 (%)
Figure 175: Company 14 Waste Paper Management Market Net Sales Share, By Geography, 2023 (%)
Figure 176: Company 15 Waste Paper Management Market Net Revenue, By Years, 2023-2030* ($)
Figure 177: Company 15 Waste Paper Management Market Net Revenue Share, By Business segments, 2023 (%)
Figure 178: Company 15 Waste Paper Management Market Net Sales Share, By Geography, 2023 (%)