Coiled Tubing Market-By Service ; By Operation ; By Application ; By End User (Oil and Gas Industry, Engineering Procurement and Construction Industry and others) & Geographic Analysis - Forecast (2024 - 2030)

Report Code: EPR 0014 Report Format: PDF + Excel

Coiled Tubing Market Overview:

The Coiled Tubing Market size is estimated to reach US$ 75.49 billion by 2030, after growing at a CAGR of 4.3% from 2024 to 2030. The coiled tubing market is defined by its continuous steel or composite tubing that is both flexible and robust, specifically designed for oil and gas exploration applications. This technology is integral to the industry, providing a versatile solution for downhole operations due to its adaptability, rigidity, and strength. As the oil and gas sector experiences a surge in exploration and production activities, the coiled tubing market is witnessing notable growth. Moreover, Ongoing improvements in materials and well-intervention techniques contribute to the market's development, enhancing the overall efficiency of operations. Coiled tubing emerges as a preferred choice for well maintenance, stimulation, and drilling operations, offering a cost-effective alternative to traditional methods. Additionally, Strategic collaborations and innovative product developments by key market players play a pivotal role in maintaining a competitive edge. Companies are actively engaging in partnerships and introducing cutting-edge solutions to address the evolving needs of the industry. As a result, the coiled tubing market is characterized by its pivotal role in oil and gas exploration, with continuous advancements in technology and a growing demand for cost-effective solutions driving its expansion. Strategic collaborations and product innovations are key factors ensuring the market's competitiveness, making it poised for sustained development in the forecast years.

Coiled Tubing Market Report Coverage

The “Coiled Tubing Market Report – Forecast (2024-2030)” by IndustryARC, covers an in-depth analysis of the following segments in the Coiled Tubing Industry.
By Service: Well Intervention & Production, Drilling, Perforating, Fracturing, Engineering Services, Milling Services, Nitrogen services and others.
By Operations: Circulation, Pumping, Logging, Perforation, Milling and Others.
By Technology/Services: Software Solutions, Hardware
By Location: On-Shore, Off-Shore
By Application: Wellbore Cleanouts, Electrical Submersible Pump Cable Conduit, Fracturing, Pipeline Cleanout, Fishing, Cementing, Nitrogen Jetting and others.
By End Use Industry: Oil and gas Industry, Engineering Procurement and Construction Industry, Others
By Geography: North America (U.S, Canada, Mexico), South America (Brazil, Argentina, and others), Europe (Germany, UK, France, Italy, Spain, and Others), APAC (China, Japan India, SK, Australia and Others), and RoW (Middle East and Africa)

Key Takeaways

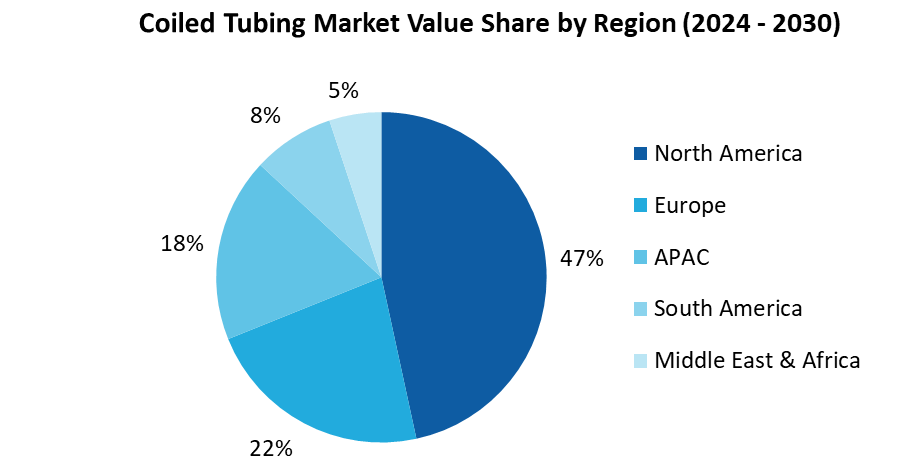
  • North America dominates the Coiled Tubing Market share of 46.6% in 2023, owing to its advanced oil and gas industry, technological innovation, and substantial investments in exploration and production activities.
  • The development of unconventional resources, such as shale oil and gas, has increased the demand for coiled tubing services. Coiled tubing is often employed in hydraulic fracturing (fracking) operations in these unconventional reservoirs.
  • Well intervention services, including well cleaning, stimulation, and logging, are major applications of coiled tubing. As older wells require maintenance and newer wells require optimization, as a result growing the Demand for Well Intervention Services using coiled tubing continues to increase.

Coiled Tubing Market

For more details on this report - Request for Sample

Coiled Tubing Market Segment Analysis – by Service

Well Intervention & Production segment held a significant share of the coiled tubing market in 2023. The Well Intervention & Production segment, particularly the Coiled Tubing Market, is driven by increasing demand for efficient oil and gas extraction. Growing exploration activities, aging oil wells requiring maintenance, and the need for enhanced reservoir recovery contribute to the market's demand. For instance, according to the Canadian Association of Petroleum Producers, Capital spending in Canadian oil and gas is projected to increase from $37 billion in 2022 to $40 billion in 2023, This investment is pivotal, contributing to a significant GDP impact of $168 billion, as per Statistics Canada. Also, for instance, Abu Dhabi National Oil Company (ADNOC) is a prominent player in the global oil and gas sector, involved in all industry facets. With ambitious goals, ADNOC aims to achieve a maximum sustainable production capacity of 5 million barrels by 2030, showcasing its commitment to industry leadership and growth. As a result, significant investments underscore the heightened demand for efficient well intervention solutions, indicating robust growth prospects for Well Intervention & Production.

Coiled Tubing Market Segment Analysis – by Application

Wellbore Cleanouts segment held a significant share of the Coiled Tubing market in 2023. The wellbore cleanouts and coiled tubing market is witnessing significant growth globally, primarily driven by robust demand in the oil and gas sector. Coiled tubing finds extensive applications, particularly in wellbore cleanouts, where it is employed to eliminate sand, wax, and debris that may impede production or disrupt downhole equipment. The escalating demand is further fueled by cleanout operations during fracturing processes, addressing issues such as screen outs or perforation bridging, preventing proppant accumulation in the wellbore. This increasing demand underscores the crucial role of coiled tubing in optimizing well performance and maintaining operational efficiency.

Coiled Tubing Market Segment Analysis – by Geography

North America held the largest Coiled Tubing Market share of up to 46.6% in 2023. to boost its growth prospects in the North American region during the forecast period. North America dominates the global coiled tubing market, primarily owing to rapid industrialization and robust exploration and production endeavors. The region's leading position is further bolstered by the escalating global demand for petroleum products, offering profitable prospects for coiled tubing service providers. The surge in requirements for conventional fuels, including petrol, diesel, and kerosene, particularly from the transportation and power generation sectors, serves as a pivotal driver propelling the coiled tubing market's growth in North America. These are factors positions the region as a key player in the coiled tubing industry, poised for sustained expansion amidst the evolving energy landscape.

Coiled Tubing Market Drivers

Increased Exploration and Production Activities

The surge in oil and gas exploration, notably in unconventional resources such as shale, tight gas, and heavy oil, is fueling the demand for coiled tubing services. Integral to well intervention and stimulation procedures, coiled tubing plays a pivotal role in sustaining and augmenting production rates. This heightened exploration and production activity underscores the significance of coiled tubing services in maintaining operational efficiency and maximizing output in the energy sector.

Increasing Energy Demand

The escalating global energy demand propels the coiled tubing market forward. With an ever-growing need for energy resources, particularly in oil and gas sectors, there's a heightened requirement for efficient extraction methods. Coiled tubing technology offers a versatile and cost-effective solution for various well intervention and drilling operations, catering to the increasing complexities of resource extraction. Its flexibility, mobility, and ability to access challenging environments make it indispensable in meeting the surging energy demands worldwide. As industries strive to optimize production and enhance operational efficiency, coiled tubing emerges as a crucial component in the quest for sustainable energy solutions.

Coiled Tubing Market Challenges

Risks Associated with Coiled Tubing Operations 

Coiled tubing operations pose inherent risks, including wellbore instability, equipment failure, and exposure to high-pressure environments. Regulatory constraints on operational safety can impede market expansion. Safeguarding personnel and equipment is paramount to mitigate these risks. Comprehensive risk assessment, adherence to industry standards, and continuous training are essential to ensure safe coiled tubing operations. Implementing robust safety protocols not only protects personnel but also sustains operational integrity, fostering long-term growth in the coiled tubing market.

Coiled Tubing Industry Outlook

Technology launches, acquisitions, and R&D activities are key strategies adopted by players in the Coiled Tubing Market. The top 10 companies in the Coiled Tubing Market are Exxon Mobil Corporation, Halliburton Co, Baker Hughes Inc., Weatherford International, Trican Well Services Ltd, Calfrac Well Services Ltd, Schlumberger Limited, C&J Energy Services, RPC, Inc., STEP Energy Services, among others

Recent Developments:

  • In March 2023, Archer Limited's acquisition of Baker Hughes' Coil Tubing and Pumping business in the UK was approved by the UK Competition and Markets Authority (CMA).
  • In May 2023, Halliburton unveiled its groundbreaking coiled tubing intervention system in New Iberia, Louisiana, featuring the V135HP injector, a reel capable of managing 36,000 feet of 2-3/8-inch tubing, and a 750-ton tension lift frame. The system boasts the longest coiled tubing string ever deployed, composed of 120,000 pounds yield strength alloy steel, and a lift frame twice the standard size.
  • In September 2022, STEP Energy Services Ltd. (STEP) announced that its US subsidiary, STEP Energy Services (USA) Ltd., acquired four ultradeep capacity coiled tubing units, ancillary equipment, and divisional leadership and operational personnel from ProPetro Holding Corp. for CAD 20.5 million. The acquisition solidifies STEP as a provider of deep-capacity coiled tubing services, with a background in the Permian Basin and other oil and gas-producing areas.

For more Energy and Power Market reports, please click here

1. Coiled Tubing Market - Overview
    1.1     Definitions and Scope
2. Coiled Tubing Market - Executive Summary
    2.1    Key Trends by Service
    2.2    Key Trends by Operations
    2.3    Key Trends by Location
    2.4    Key Trends by Applications
    2.5    Key Trends by End User
    2.6    Key Trends by Geography
3.    Coiled Tubing Market - Comparative Analysis
    3.1    Company Benchmarking 
    3.2    Global Financial Analysis
    3.3    Market Share Analysis
    3.4    Patent Analysis
    3.5    Pricing Analysis
4.    Coiled Tubing Market - Start-up Companies Scenario
    4.1     Key Start-up Company Analysis by
        4.1.1    Investment
        4.1.2    Revenue
        4.1.3    Venture Capital and Funding Scenario
5.    Coiled Tubing Market – Market Entry Scenario Premium
    5.1    Regulatory Framework Overview
    5.2    New Business and Ease of Doing Business Index
    5.3    Case Studies of Successful Ventures
6.    Coiled Tubing Market - Forces
    6.1    Market Drivers
    6.2    Market Constraints/Challenges
    6.3    Porter’s Five Force Model
        6.3.1    Bargaining power of suppliers
        6.3.2    Bargaining powers of customers
        6.3.3    Threat of new entrants
        6.3.4    Rivalry among existing players
        6.3.5    Threat of substitutes 
7.    Coiled Tubing Market – Strategic Analysis
    7.1     Value Chain Analysis
    7.2     Opportunities Analysis
    7.3     Market Life Cycle
8.    Coiled Tubing Market– By Service (Market Size -$Million/Billion) 
    8.1    Well Intervention & Production
        8.1.1    Well Cleaning Service
        8.1.2    Well Completion Service
    8.2    Drilling
        8.2.1    Directional Drilling
        8.2.2    Managed Pressure Drilling
        8.2.3    Seismic-Guided Drilling
    8.3    Perforating
        8.3.1    Live well Perforating
        8.3.2    Subsea well Perforating
        8.3.3    Depleted well Perforating
    8.4    Fracturing
    8.5    Engineering Services
    8.6    Milling Services
    8.7    Nitrogen services 
    8.8    others.
9.    Coiled Tubing Market – By Operation (Market Size -$Million/Billion)
    9.1    Circulation
    9.2    Pumping
    9.3    Logging
    9.4    Perforation
    9.5    Milling
    9.6    Others.
10.    Coiled Tubing Market – By Location (Market Size - $Million/$Billion)
    10.1    On-Shore
    10.2    Off-Shore
11.    Coiled Tubing Market – By Application (Market Size - $Million/$Billion)
    11.1    Wellbore Cleanouts
    11.2    Electrical Submersible Pump Cable Conduit
    11.3    Fracturing
    11.4    Pipeline Cleanout
    11.5    Fishing 
    11.6    Cementing
    11.7    Nitrogen Jetting
    11.8    Others. 
12.    Coiled Tubing Market – By End-user (Market Size -$Million/Billion)
    12.1    Oil and Gas Industry
    12.2    Engineering Procurement and Construction Industry 
    12.3    Others 
13.    Coiled Tubing Market – by Geography (Market Size - $Million/$Billion)
    13.1    North America
        13.1.1    U.S.
        13.1.2    Canada
        13.1.3    Mexico
    13.2    Europe
        13.2.1     U.K.
        13.2.2     Germany
        13.2.3    France
        13.2.4    Italy
        13.2.5    Spain
        13.2.6    Rest of Europe
    13.3    Asia-Pacific
        13.3.1    China
        13.3.2    Japan
        13.3.3    India
        13.3.4    South Korea
        13.3.5    Australia & New Zealand
        13.3.6    Rest of Asia-Pacific
    13.4    South America
        13.4.1    Brazil
        13.4.2    Argentina
        13.4.3    Rest of South America
    13.5    Rest of The World
        13.5.1    Middle East
        13.5.2    Africa
14.    Coiled Tubing Market - Entropy
15.    Coiled Tubing Market – Industry/Segment Competition Landscape
    15.1    Market Share Analysis
        15.1.1    Global Market Share – Key Companies
        15.1.2    Market Share by Region – Key Companies
        15.1.3    Market Share by Countries – Key Companies
    15.2    Competition Matrix
    15.3    Best Practices for Companies
16.    Coiled Tubing Market – Key Company List by Country Premium
17.    Coiled Tubing Market- Company Analysis
    17.1    Exxon Mobile Corporation
    17.2    Halliburton Co 
    17.3    Baker Hughes Inc.
    17.4    Weatherford International 
    17.5    Trican Well Services Ltd
    17.6    Calfrac Well Services Ltd
    17.7    Schlumberger Limited
    17.8    C&J Energy Services
    17.9    RPC, Inc.
    17.10    STEP Energy Services 
* "Financials would be provided to private companies on best-efforts basis." 
 
List of Tables:
 
Table 1: Coiled Tubing Market Overview 2023-2030
Table 2: Coiled Tubing Market Leader Analysis 2023-2030 (US$)
Table 3: Coiled Tubing Market Product Analysis 2023-2030 (US$)
Table 4: Coiled Tubing Market End User Analysis 2023-2030 (US$)
Table 5: Coiled Tubing Market Patent Analysis 2013-2023* (US$)
Table 6: Coiled Tubing Market Financial Analysis 2023-2030 (US$)
Table 7: Coiled Tubing Market Driver Analysis 2023-2030 (US$)
Table 8: Coiled Tubing Market Challenges Analysis 2023-2030 (US$)
Table 9: Coiled Tubing Market Constraint Analysis 2023-2030 (US$)
Table 10: Coiled Tubing Market Supplier Bargaining Power Analysis 2023-2030 (US$)
Table 11: Coiled Tubing Market Buyer Bargaining Power Analysis 2023-2030 (US$)
Table 12: Coiled Tubing Market Threat of Substitutes Analysis 2023-2030 (US$)
Table 13: Coiled Tubing Market Threat of New Entrants Analysis 2023-2030 (US$)
Table 14: Coiled Tubing Market Degree of Competition Analysis 2023-2030 (US$)
Table 15: Coiled Tubing Market Value Chain Analysis 2023-2030 (US$)
Table 16: Coiled Tubing Market Pricing Analysis 2023-2030 (US$)
Table 17: Coiled Tubing Market Opportunities Analysis 2023-2030 (US$)
Table 18: Coiled Tubing Market Product Life Cycle Analysis 2023-2030 (US$)
Table 19: Coiled Tubing Market Supplier Analysis 2023-2030 (US$)
Table 20: Coiled Tubing Market Distributor Analysis 2023-2030 (US$)
Table 21: Coiled Tubing Market Trend Analysis 2023-2030 (US$)
Table 22: Coiled Tubing Market Size 2023 (US$)
Table 23: Coiled Tubing Market Forecast Analysis 2023-2030 (US$)
Table 24: Coiled Tubing Market Sales Forecast Analysis 2023-2030 (Units)
Table 25: Coiled Tubing Market, Revenue & Volume, By Services, 2023-2030 ($)
Table 26: Coiled Tubing Market By Services, Revenue & Volume, By Well Intervention & Production, 2023-2030 ($)
Table 27: Coiled Tubing Market By Services, Revenue & Volume, By Drilling, 2023-2030 ($)
Table 28: Coiled Tubing Market By Services, Revenue & Volume, By Perforating, 2023-2030 ($)
Table 29: Coiled Tubing Market By Services, Revenue & Volume, By Fracturing, 2023-2030 ($)
Table 30: Coiled Tubing Market By Services, Revenue & Volume, By Engineering services, 2023-2030 ($)
Table 31: Coiled Tubing Market, Revenue & Volume, By Operations, 2023-2030 ($)
Table 32: Coiled Tubing Market By Operations, Revenue & Volume, By Circulation, 2023-2030 ($)
Table 33: Coiled Tubing Market By Operations, Revenue & Volume, By Pumping, 2023-2030 ($)
Table 34: Coiled Tubing Market By Operations, Revenue & Volume, By Logging, 2023-2030 ($)
Table 35: Coiled Tubing Market By Operations, Revenue & Volume, By Perforation, 2023-2030 ($)
Table 36: Coiled Tubing Market, Revenue & Volume, By Application, 2023-2030 ($)
Table 37: Coiled Tubing Market By Application, Revenue & Volume, By Wellbore Cleanouts, 2023-2030 ($)
Table 38: Coiled Tubing Market By Application, Revenue & Volume, By Electrical Submersible Pump Cable Conduit, 2023-2030 ($)
Table 39: Coiled Tubing Market By Application, Revenue & Volume, By Fracturing, 2023-2030 ($)
Table 40: Coiled Tubing Market By Application, Revenue & Volume, By Pipeline Cleanout, 2023-2030 ($)
Table 41: Coiled Tubing Market By Application, Revenue & Volume, By Fishing, 2023-2030 ($)
Table 42: North America Coiled Tubing Market, Revenue & Volume, By Services, 2023-2030 ($)
Table 43: North America Coiled Tubing Market, Revenue & Volume, By Operations, 2023-2030 ($)
Table 44: North America Coiled Tubing Market, Revenue & Volume, By Application, 2023-2030 ($)
Table 45: South america Coiled Tubing Market, Revenue & Volume, By Services, 2023-2030 ($)
Table 46: South america Coiled Tubing Market, Revenue & Volume, By Operations, 2023-2030 ($)
Table 47: South america Coiled Tubing Market, Revenue & Volume, By Application, 2023-2030 ($)
Table 48: Europe Coiled Tubing Market, Revenue & Volume, By Services, 2023-2030 ($)
Table 49: Europe Coiled Tubing Market, Revenue & Volume, By Operations, 2023-2030 ($)
Table 50: Europe Coiled Tubing Market, Revenue & Volume, By Application, 2023-2030 ($)
Table 51: APAC Coiled Tubing Market, Revenue & Volume, By Services, 2023-2030 ($)
Table 52: APAC Coiled Tubing Market, Revenue & Volume, By Operations, 2023-2030 ($)
Table 53: APAC Coiled Tubing Market, Revenue & Volume, By Application, 2023-2030 ($)
Table 54: Middle East & Africa Coiled Tubing Market, Revenue & Volume, By Services, 2023-2030 ($)
Table 55: Middle East & Africa Coiled Tubing Market, Revenue & Volume, By Operations, 2023-2030 ($)
Table 56: Middle East & Africa Coiled Tubing Market, Revenue & Volume, By Application, 2023-2030 ($)
Table 57: Russia Coiled Tubing Market, Revenue & Volume, By Services, 2023-2030 ($)
Table 58: Russia Coiled Tubing Market, Revenue & Volume, By Operations, 2023-2030 ($)
Table 59: Russia Coiled Tubing Market, Revenue & Volume, By Application, 2023-2030 ($)
Table 60: Israel Coiled Tubing Market, Revenue & Volume, By Services, 2023-2030 ($)
Table 61: Israel Coiled Tubing Market, Revenue & Volume, By Operations, 2023-2030 ($)
Table 62: Israel Coiled Tubing Market, Revenue & Volume, By Application, 2023-2030 ($)
Table 63: Top Companies 2023 (US$) Coiled Tubing Market, Revenue & Volume
Table 64: Product Launch 2023-2030 Coiled Tubing Market, Revenue & Volume
Table 65: Mergers & Acquistions 2023-2030 Coiled Tubing Market, Revenue & Volume
 
 
List of Figures:
 
Figure 1: Overview of Coiled Tubing Market 2023-2030
Figure 2: Market Share Analysis for Coiled Tubing Market 2023 (US$)
Figure 3: Product Comparison in Coiled Tubing Market 2023-2030 (US$)
Figure 4: End User Profile for Coiled Tubing Market 2023-2030 (US$)
Figure 5: Patent Application and Grant in Coiled Tubing Market 2013-2023* (US$)
Figure 6: Top 5 Companies Financial Analysis in Coiled Tubing Market 2023-2030 (US$)
Figure 7: Market Entry Strategy in Coiled Tubing Market 2023-2030
Figure 8: Ecosystem Analysis in Coiled Tubing Market 2023
Figure 9: Average Selling Price in Coiled Tubing Market 2023-2030
Figure 10: Top Opportunites in Coiled Tubing Market 2023-2030
Figure 11: Market Life Cycle Analysis in Coiled Tubing Market
Figure 12: GlobalBy Services Coiled Tubing Market Revenue, 2023-2030 ($)
Figure 13: GlobalBy Operations Coiled Tubing Market Revenue, 2023-2030 ($)
Figure 14: GlobalBy Application Coiled Tubing Market Revenue, 2023-2030 ($)
Figure 15: Global Coiled Tubing Market - By Geography
Figure 16: Global Coiled Tubing Market Value & Volume, By Geography, 2023-2030 ($) 
Figure 17: Global Coiled Tubing Market CAGR, By Geography, 2023-2030 (%)
Figure 18: North America Coiled Tubing Market Value & Volume, 2023-2030 ($)
Figure 19: US Coiled Tubing Market Value & Volume, 2023-2030 ($)
Figure 20: US GDP and Population, 2023-2030 ($)
Figure 21: US GDP – Composition of 2023, By Sector of Origin
Figure 22: US Export and Import Value & Volume, 2023-2030 ($)
Figure 23: Canada Coiled Tubing Market Value & Volume, 2023-2030 ($)
Figure 24: Canada GDP and Population, 2023-2030 ($)
Figure 25: Canada GDP – Composition of 2023, By Sector of Origin
Figure 26: Canada Export and Import Value & Volume, 2023-2030 ($)
Figure 27: Mexico Coiled Tubing Market Value & Volume, 2023-2030 ($)
Figure 28: Mexico GDP and Population, 2023-2030 ($)
Figure 29: Mexico GDP – Composition of 2023, By Sector of Origin
Figure 30: Mexico Export and Import Value & Volume, 2023-2030 ($)
Figure 31: South America Coiled Tubing Market Value & Volume, 2023-2030 ($)
Figure 32: Brazil Coiled Tubing Market Value & Volume, 2023-2030 ($)
Figure 33: Brazil GDP and Population, 2023-2030 ($)
Figure 34: Brazil GDP – Composition of 2023, By Sector of Origin
Figure 35: Brazil Export and Import Value & Volume, 2023-2030 ($)
Figure 36: Venezuela Coiled Tubing Market Value & Volume, 2023-2030 ($)
Figure 37: Venezuela GDP and Population, 2023-2030 ($)
Figure 38: Venezuela GDP – Composition of 2023, By Sector of Origin
Figure 39: Venezuela Export and Import Value & Volume, 2023-2030 ($)
Figure 40: Argentina Coiled Tubing Market Value & Volume, 2023-2030 ($)
Figure 41: Argentina GDP and Population, 2023-2030 ($)
Figure 42: Argentina GDP – Composition of 2023, By Sector of Origin
Figure 43: Argentina Export and Import Value & Volume, 2023-2030 ($)
Figure 44: Ecuador Coiled Tubing Market Value & Volume, 2023-2030 ($)
Figure 45: Ecuador GDP and Population, 2023-2030 ($)
Figure 46: Ecuador GDP – Composition of 2023, By Sector of Origin
Figure 47: Ecuador Export and Import Value & Volume, 2023-2030 ($)
Figure 48: Peru Coiled Tubing Market Value & Volume, 2023-2030 ($)
Figure 49: Peru GDP and Population, 2023-2030 ($)
Figure 50: Peru GDP – Composition of 2023, By Sector of Origin
Figure 51: Peru Export and Import Value & Volume, 2023-2030 ($)
Figure 52: Colombia Coiled Tubing Market Value & Volume, 2023-2030 ($)
Figure 53: Colombia GDP and Population, 2023-2030 ($)
Figure 54: Colombia GDP – Composition of 2023, By Sector of Origin
Figure 55: Colombia Export and Import Value & Volume, 2023-2030 ($)
Figure 56: Costa Rica Coiled Tubing Market Value & Volume, 2023-2030 ($)
Figure 57: Costa Rica GDP and Population, 2023-2030 ($)
Figure 58: Costa Rica GDP – Composition of 2023, By Sector of Origin
Figure 59: Costa Rica Export and Import Value & Volume, 2023-2030 ($)
Figure 60: Europe Coiled Tubing Market Value & Volume, 2023-2030 ($)
Figure 61: U.K Coiled Tubing Market Value & Volume, 2023-2030 ($)
Figure 62: U.K GDP and Population, 2023-2030 ($)
Figure 63: U.K GDP – Composition of 2023, By Sector of Origin
Figure 64: U.K Export and Import Value & Volume, 2023-2030 ($)
Figure 65: Germany Coiled Tubing Market Value & Volume, 2023-2030 ($)
Figure 66: Germany GDP and Population, 2023-2030 ($)
Figure 67: Germany GDP – Composition of 2023, By Sector of Origin
Figure 68: Germany Export and Import Value & Volume, 2023-2030 ($)
Figure 69: Italy Coiled Tubing Market Value & Volume, 2023-2030 ($)
Figure 70: Italy GDP and Population, 2023-2030 ($)
Figure 71: Italy GDP – Composition of 2023, By Sector of Origin
Figure 72: Italy Export and Import Value & Volume, 2023-2030 ($)
Figure 73: France Coiled Tubing Market Value & Volume, 2023-2030 ($)
Figure 74: France GDP and Population, 2023-2030 ($)
Figure 75: France GDP – Composition of 2023, By Sector of Origin
Figure 76: France Export and Import Value & Volume, 2023-2030 ($)
Figure 77: Netherlands Coiled Tubing Market Value & Volume, 2023-2030 ($)
Figure 78: Netherlands GDP and Population, 2023-2030 ($)
Figure 79: Netherlands GDP – Composition of 2023, By Sector of Origin
Figure 80: Netherlands Export and Import Value & Volume, 2023-2030 ($)
Figure 81: Belgium Coiled Tubing Market Value & Volume, 2023-2030 ($)
Figure 82: Belgium GDP and Population, 2023-2030 ($)
Figure 83: Belgium GDP – Composition of 2023, By Sector of Origin
Figure 84: Belgium Export and Import Value & Volume, 2023-2030 ($)
Figure 85: Spain Coiled Tubing Market Value & Volume, 2023-2030 ($)
Figure 86: Spain GDP and Population, 2023-2030 ($)
Figure 87: Spain GDP – Composition of 2023, By Sector of Origin
Figure 88: Spain Export and Import Value & Volume, 2023-2030 ($)
Figure 89: Denmark Coiled Tubing Market Value & Volume, 2023-2030 ($)
Figure 90: Denmark GDP and Population, 2023-2030 ($)
Figure 91: Denmark GDP – Composition of 2023, By Sector of Origin
Figure 92: Denmark Export and Import Value & Volume, 2023-2030 ($)
Figure 93: APAC Coiled Tubing Market Value & Volume, 2023-2030 ($)
Figure 94: China Coiled Tubing Market Value & Volume, 2023-2030
Figure 95: China GDP and Population, 2023-2030 ($)
Figure 96: China GDP – Composition of 2023, By Sector of Origin
Figure 97: China Export and Import Value & Volume, 2023-2030 ($) Coiled Tubing Market China Export and Import Value & Volume, 2023-2030 ($)
Figure 98: Australia Coiled Tubing Market Value & Volume, 2023-2030 ($)
Figure 99: Australia GDP and Population, 2023-2030 ($)
Figure 100: Australia GDP – Composition of 2023, By Sector of Origin
Figure 101: Australia Export and Import Value & Volume, 2023-2030 ($)
Figure 102: South Korea Coiled Tubing Market Value & Volume, 2023-2030 ($)
Figure 103: South Korea GDP and Population, 2023-2030 ($)
Figure 104: South Korea GDP – Composition of 2023, By Sector of Origin
Figure 105: South Korea Export and Import Value & Volume, 2023-2030 ($)
Figure 106: India Coiled Tubing Market Value & Volume, 2023-2030 ($)
Figure 107: India GDP and Population, 2023-2030 ($)
Figure 108: India GDP – Composition of 2023, By Sector of Origin
Figure 109: India Export and Import Value & Volume, 2023-2030 ($)
Figure 110: Taiwan Coiled Tubing Market Value & Volume, 2023-2030 ($)
Figure 111: Taiwan GDP and Population, 2023-2030 ($)
Figure 112: Taiwan GDP – Composition of 2023, By Sector of Origin
Figure 113: Taiwan Export and Import Value & Volume, 2023-2030 ($)
Figure 114: Malaysia Coiled Tubing Market Value & Volume, 2023-2030 ($)
Figure 115: Malaysia GDP and Population, 2023-2030 ($)
Figure 116: Malaysia GDP – Composition of 2023, By Sector of Origin
Figure 117: Malaysia Export and Import Value & Volume, 2023-2030 ($)
Figure 118: Hong Kong Coiled Tubing Market Value & Volume, 2023-2030 ($)
Figure 119: Hong Kong GDP and Population, 2023-2030 ($)
Figure 120: Hong Kong GDP – Composition of 2023, By Sector of Origin
Figure 121: Hong Kong Export and Import Value & Volume, 2023-2030 ($)
Figure 122: Middle East & Africa Coiled Tubing Market Middle East & Africa 3D Printing Market Value & Volume, 2023-2030 ($)
Figure 123: Russia Coiled Tubing Market Value & Volume, 2023-2030 ($)
Figure 124: Russia GDP and Population, 2023-2030 ($)
Figure 125: Russia GDP – Composition of 2023, By Sector of Origin
Figure 126: Russia Export and Import Value & Volume, 2023-2030 ($)
Figure 127: Israel Coiled Tubing Market Value & Volume, 2023-2030 ($)
Figure 128: Israel GDP and Population, 2023-2030 ($)
Figure 129: Israel GDP – Composition of 2023, By Sector of Origin
Figure 130: Israel Export and Import Value & Volume, 2023-2030 ($)
Figure 131: Entropy Share, By Strategies, 2023-2030* (%) Coiled Tubing Market 
Figure 132: Developments, 2023-2030* Coiled Tubing Market 
Figure 133: Company 1 Coiled Tubing Market Net Revenue, By Years, 2023-2030* ($)
Figure 134: Company 1 Coiled Tubing Market Net Revenue Share, By Business segments, 2023 (%)
Figure 135: Company 1 Coiled Tubing Market Net Sales Share, By Geography, 2023 (%)
Figure 136: Company 2 Coiled Tubing Market Net Revenue, By Years, 2023-2030* ($)
Figure 137: Company 2 Coiled Tubing Market Net Revenue Share, By Business segments, 2023 (%)
Figure 138: Company 2 Coiled Tubing Market Net Sales Share, By Geography, 2023 (%)
Figure 139: Company 3 Coiled Tubing Market Net Revenue, By Years, 2023-2030* ($)
Figure 140: Company 3 Coiled Tubing Market Net Revenue Share, By Business segments, 2023 (%)
Figure 141: Company 3 Coiled Tubing Market Net Sales Share, By Geography, 2023 (%)
Figure 142: Company 4 Coiled Tubing Market Net Revenue, By Years, 2023-2030* ($)
Figure 143: Company 4 Coiled Tubing Market Net Revenue Share, By Business segments, 2023 (%)
Figure 144: Company 4 Coiled Tubing Market Net Sales Share, By Geography, 2023 (%)
Figure 145: Company 5 Coiled Tubing Market Net Revenue, By Years, 2023-2030* ($)
Figure 146: Company 5 Coiled Tubing Market Net Revenue Share, By Business segments, 2023 (%)
Figure 147: Company 5 Coiled Tubing Market Net Sales Share, By Geography, 2023 (%)
Figure 148: Company 6 Coiled Tubing Market Net Revenue, By Years, 2023-2030* ($)
Figure 149: Company 6 Coiled Tubing Market Net Revenue Share, By Business segments, 2023 (%)
Figure 150: Company 6 Coiled Tubing Market Net Sales Share, By Geography, 2023 (%)
Figure 151: Company 7 Coiled Tubing Market Net Revenue, By Years, 2023-2030* ($)
Figure 152: Company 7 Coiled Tubing Market Net Revenue Share, By Business segments, 2023 (%)
Figure 153: Company 7 Coiled Tubing Market Net Sales Share, By Geography, 2023 (%)
Figure 154: Company 8 Coiled Tubing Market Net Revenue, By Years, 2023-2030* ($)
Figure 155: Company 8 Coiled Tubing Market Net Revenue Share, By Business segments, 2023 (%)
Figure 156: Company 8 Coiled Tubing Market Net Sales Share, By Geography, 2023 (%)
Figure 157: Company 9 Coiled Tubing Market Net Revenue, By Years, 2023-2030* ($)
Figure 158: Company 9 Coiled Tubing Market Net Revenue Share, By Business segments, 2023 (%)
Figure 159: Company 9 Coiled Tubing Market Net Sales Share, By Geography, 2023 (%)
Figure 160: Company 10 Coiled Tubing Market Net Revenue, By Years, 2023-2030* ($)
Figure 161: Company 10 Coiled Tubing Market Net Revenue Share, By Business segments, 2023 (%)
Figure 162: Company 10 Coiled Tubing Market Net Sales Share, By Geography, 2023 (%)
Figure 163: Company 11 Coiled Tubing Market Net Revenue, By Years, 2023-2030* ($)
Figure 164: Company 11 Coiled Tubing Market Net Revenue Share, By Business segments, 2023 (%)
Figure 165: Company 11 Coiled Tubing Market Net Sales Share, By Geography, 2023 (%)
Figure 166: Company 12 Coiled Tubing Market Net Revenue, By Years, 2023-2030* ($)
Figure 167: Company 12 Coiled Tubing Market Net Revenue Share, By Business segments, 2023 (%)
Figure 168: Company 12 Coiled Tubing Market Net Sales Share, By Geography, 2023 (%)
Figure 169: Company 13 Coiled Tubing Market Net Revenue, By Years, 2023-2030* ($)
Figure 170: Company 13 Coiled Tubing Market Net Revenue Share, By Business segments, 2023 (%)
Figure 171: Company 13 Coiled Tubing Market Net Sales Share, By Geography, 2023 (%)
Figure 172: Company 14 Coiled Tubing Market Net Revenue, By Years, 2023-2030* ($)
Figure 173: Company 14 Coiled Tubing Market Net Revenue Share, By Business segments, 2023 (%)
Figure 174: Company 14 Coiled Tubing Market Net Sales Share, By Geography, 2023 (%)
Figure 175: Company 15 Coiled Tubing Market Net Revenue, By Years, 2023-2030* ($)
Figure 176: Company 15 Coiled Tubing Market Net Revenue Share, By Business segments, 2023 (%)
Figure 177: Company 15 Coiled Tubing Market Net Sales Share, By Geography, 2023 (%)