 Email
Email Print
Print


Feed Fats and Proteins Market - Forecast(2024 - 2030)
Feed additives and supplements have a vital existence pertaining to the performance enhancement of dairy animals as well as poultry. Presently, they are very important for feed formulation and vital for the preparation of a balanced diet. Major type of additives and supplements that are being used are prebiotics, antibiotic growth promoters, probiotics, mould inhibitors, toxin binders, enzymes, anti-coccidial supplements, amino acids, acidifiers, by-pass fat, non-antibiotic growth promoters, antioxidant and more. Many of these products are imported from developed countries. Fishmeal and meat-meal are the most popularly used poultry feed owing to their high production and availability, better consciousness a well as better meal in most poultry rations. However, the quality of fishmeal is degrading which has consequently led soybean meal to replace fishmeal and meat.
Meat-meal, fishmeal, bone-meal and dicalcium phosphate of bone origin are the basic raw ingredients existing for animal feeding. Moreover, government has set nutritional standards for cattle and poultry keeping in mind numerous factors which include genotype, environment, quality of available raw materials, maintenance methods, production and reproduction requirements and more. Major types of feed fats and proteins commercially available based on their source are meat & bone meal, blood meal, corn, soybean, tallow and more. The report also focuses on different geographic regions and the key countries in terms of changing trends in feed fats and proteins market in various fields.
The feed fats and proteins market is segregated on the basis of source which includes animals, plants and others. Moreover by livestock, the market is segmented into ruminants, poultry, swine, equine, aqua and others. An animal needs proteins and fats in suitable quantity in order to pure lactation, growth and reproduction, disparity or deficits of the same will cause a sub-optimal performance and health of the animal. Moreover, there is a continuous necessity to deliver extra support in improvement of animal production systems and their related feeding prerequisites in developing countries.
The available livestock are the major driver for the feed, fats and proteins market to grow. feed, fats and proteins derive their in various livestock like ruminants, poultry, aqua, swine, equine and more. APAC dominated the global feed, fats and proteins market. The economic development in this region is all set to drive the demand of feed, fats and proteins materials. Major players involved in this market are mainly concentrating on R&D initiatives and new product developments to cater the needs of customers.
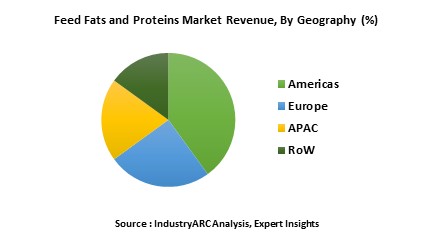
APAC is the leading market for Feed Fats and Proteins with China and India leading the charge. APAC region is anticipated to have highest growth in the next few years owing to growing adoption of Feed Fats and Proteins in various feedstocks. A strong economic growth and population growth is the key driver of the market in this region. Americas, especially U.S. is the second largest market pertaining to feed fats and proteins followed by Europe. Some of the major factors which fuel the growth of feed, fats and proteins in Europe include growing meat consumption, food safety concerns as well as growing meat prices. RoW occupied the least share, but the consumption is increasing at a greater pace due to the rise in population, change to nutritious food, increased demand in animal proteins, and so on.
The global feed fats and proteins market is evaluated based on key attributes such as source, livestock and others. Each of the segmentations in the report has been studied to give comprehensive analysis of global feed fats and proteins market. The overall market has also been consolidated from the perspective of different geographic locations into standard geographic regions and key economies for this market. Additionally, this report encompasses opportunity analysis, porter analysis, pricing analysis and market forces such as drivers, constraints and challenges that are involved to drive the overall market.
Sample Companies Profiled in this Report are:
This report gives detailed information about the product value chain right from the beginning which includes raw materials till end-use. The market is analyzed based on the key attributes such as the power in the hands of producers and consumers, analysis on the degree of competition, and threats from substitutes and new entrants. The study includes the demand of this particular market on a global and regional scale for a six year period of 2016-2021, both in terms of volume(kilo tons) and revenue($ million).
Meat-meal, fishmeal, bone-meal and dicalcium phosphate of bone origin are the basic raw ingredients existing for animal feeding. Moreover, government has set nutritional standards for cattle and poultry keeping in mind numerous factors which include genotype, environment, quality of available raw materials, maintenance methods, production and reproduction requirements and more. Major types of feed fats and proteins commercially available based on their source are meat & bone meal, blood meal, corn, soybean, tallow and more. The report also focuses on different geographic regions and the key countries in terms of changing trends in feed fats and proteins market in various fields.
The feed fats and proteins market is segregated on the basis of source which includes animals, plants and others. Moreover by livestock, the market is segmented into ruminants, poultry, swine, equine, aqua and others. An animal needs proteins and fats in suitable quantity in order to pure lactation, growth and reproduction, disparity or deficits of the same will cause a sub-optimal performance and health of the animal. Moreover, there is a continuous necessity to deliver extra support in improvement of animal production systems and their related feeding prerequisites in developing countries.
The available livestock are the major driver for the feed, fats and proteins market to grow. feed, fats and proteins derive their in various livestock like ruminants, poultry, aqua, swine, equine and more. APAC dominated the global feed, fats and proteins market. The economic development in this region is all set to drive the demand of feed, fats and proteins materials. Major players involved in this market are mainly concentrating on R&D initiatives and new product developments to cater the needs of customers.
APAC is the leading market for Feed Fats and Proteins with China and India leading the charge. APAC region is anticipated to have highest growth in the next few years owing to growing adoption of Feed Fats and Proteins in various feedstocks. A strong economic growth and population growth is the key driver of the market in this region. Americas, especially U.S. is the second largest market pertaining to feed fats and proteins followed by Europe. Some of the major factors which fuel the growth of feed, fats and proteins in Europe include growing meat consumption, food safety concerns as well as growing meat prices. RoW occupied the least share, but the consumption is increasing at a greater pace due to the rise in population, change to nutritious food, increased demand in animal proteins, and so on.
The global feed fats and proteins market is evaluated based on key attributes such as source, livestock and others. Each of the segmentations in the report has been studied to give comprehensive analysis of global feed fats and proteins market. The overall market has also been consolidated from the perspective of different geographic locations into standard geographic regions and key economies for this market. Additionally, this report encompasses opportunity analysis, porter analysis, pricing analysis and market forces such as drivers, constraints and challenges that are involved to drive the overall market.
Sample Companies Profiled in this Report are:
- Archer Daniels Midland Company (ADM)
- Darling International Inc.
- Roquette Freres
- Lansing Trade Group LLC
- Omega Protein Corporation
- 10+.
This report gives detailed information about the product value chain right from the beginning which includes raw materials till end-use. The market is analyzed based on the key attributes such as the power in the hands of producers and consumers, analysis on the degree of competition, and threats from substitutes and new entrants. The study includes the demand of this particular market on a global and regional scale for a six year period of 2016-2021, both in terms of volume(kilo tons) and revenue($ million).
1. Market Overview
2. Executive Summary
3. Feed Fats And Proteins Market Landscape
3.1. Market Share Analysis
3.2. Comparative Analysis
3.2.1. Product Benchmarking
3.2.2. End user Profiling
3.2.3. Top 5 Financials Analysis
4. Feed Fats And Proteins Market Forces
4.1. Market Drivers
4.2. Market Constraints & Challenges
4.3. Attractiveness of the Feed Fats and Proteins Industry
4.3.1. Power of Suppliers
4.3.2. Threats From New Entrants
4.3.3. Power of Buyer
4.3.4. Threat From Substitute Product
4.3.5. Degree of Competition
5. Feed Fats And Proteins Market Strategic Analysis
5.1. Feeds Fats and Proteins Market - Value Chain Analysis
5.2. Pricing Analysis
5.3. Opportunity Analysis
5.4. Product Life Cycle
5.5. Suppliers and Distributors
5.6. SWOT Analysis
6. Feed Fats And Proteins Market -By Source
6.1. Introduction
6.2. Animal
6.2.1. Meat & Bone Meal
6.2.2. Poultry Meal
6.2.3. Tallow
6.2.4. Blood Meal
6.2.5. Feather Meal
6.2.6. Others
6.3. Plants
6.3.1. Corn
6.3.2. Soybean
6.3.3. Cotton Seeds
6.3.4. Wheat
6.3.5. Others
6.4. Others
7. Feed Fats And Proteins Market -By Livestock
7.1. Introduction
7.2. Ruminants
7.3. Poultry
7.4. Aqua
7.5. Swine
7.6. Equine
7.7. Others
8. Feed Fats And Proteins Market -By Geography
8.1. Americas
8.1.1. U.S.
8.1.2. Canada
8.1.3. Mexico
8.1.4. Brazil
8.1.5. Others
8.2. Europe
8.2.1. U.K.
8.2.2. Germany
8.2.3. Italy
8.2.4. France
8.2.5. Spain
8.2.6. Others
8.3. APAC
8.3.1. China
8.3.2. Japan
8.3.3. India
8.3.4. Others
8.4. Rest of The World (RoW)
9. Feed Fats And Proteins Market -Entropy
9.1. New Product Developments
9.2. Mergers and Acquisitions
10. Company Profiles
10.1. Agrana Beteiligungs-AG
10.2. Archer Daniels Midland Company (ADM)
10.3. Bunge Ltd.
10.4. Darling International Inc.
10.5. Euroduna Rohstoffe Gmbh
10.6. Lansing Trade Group LLC.
10.7. Omega Protein Corporation
10.8. Roquette Freres
10.9. The Scoular Company
10.10. BRF S.A
10.11. Land O'Lakes Purina
10.12. Tyson Foods corp
10.13. Smithfield Foods
10.14. ADM Alliance Nutrition
10.15. Xinle City Hongyuan Carbon Black Sales Center
10.16. Wudi Deda Agriculture Co., Limited
10.17. WD STS BIOL. DEVELOPMENT Co., Limited
10.18. Hamate (Tianjin) International Limited
10.19. WD STS BIOL. DEVELOPMENT CO., LIMITED
10.20. Shouguang Ftl Bio. Co., Ltd.
10.21. Qingzhou Ekato Commercial Co., Ltd.
10.22. Nutricorn Co., Limited
10.23. Chengdu Chelation Biology Technology Co., Ltd.
*More than 10 Companies are profiled in this Research Report*
"*Financials would be provided on a best efforts basis for private companies"
11. Appendix
11.1. List of Abbreviations
11.2. Sources
11.3. Research Methodology
11.4. Expert Insights
11.5. Disclaimer
List of Tables
Table 1: Feed Fats and Proteins Market Overview 2023-2030
Table 2: Feed Fats and Proteins Market Leader Analysis 2023-2030 (US$)
Table 3: Feed Fats and Proteins Market Product Analysis 2023-2030 (US$)
Table 4: Feed Fats and Proteins Market End User Analysis 2023-2030 (US$)
Table 5: Feed Fats and Proteins Market Patent Analysis 2013-2023* (US$)
Table 6: Feed Fats and Proteins Market Financial Analysis 2023-2030 (US$)
Table 7: Feed Fats and Proteins Market Driver Analysis 2023-2030 (US$)
Table 8: Feed Fats and Proteins Market Challenges Analysis 2023-2030 (US$)
Table 9: Feed Fats and Proteins Market Constraint Analysis 2023-2030 (US$)
Table 10: Feed Fats and Proteins Market Supplier Bargaining Power Analysis 2023-2030 (US$)
Table 11: Feed Fats and Proteins Market Buyer Bargaining Power Analysis 2023-2030 (US$)
Table 12: Feed Fats and Proteins Market Threat of Substitutes Analysis 2023-2030 (US$)
Table 13: Feed Fats and Proteins Market Threat of New Entrants Analysis 2023-2030 (US$)
Table 14: Feed Fats and Proteins Market Degree of Competition Analysis 2023-2030 (US$)
Table 15: Feed Fats and Proteins Market Value Chain Analysis 2023-2030 (US$)
Table 16: Feed Fats and Proteins Market Pricing Analysis 2023-2030 (US$)
Table 17: Feed Fats and Proteins Market Opportunities Analysis 2023-2030 (US$)
Table 18: Feed Fats and Proteins Market Product Life Cycle Analysis 2023-2030 (US$)
Table 19: Feed Fats and Proteins Market Supplier Analysis 2023-2030 (US$)
Table 20: Feed Fats and Proteins Market Distributor Analysis 2023-2030 (US$)
Table 21: Feed Fats and Proteins Market Trend Analysis 2023-2030 (US$)
Table 22: Feed Fats and Proteins Market Size 2023 (US$)
Table 23: Feed Fats and Proteins Market Forecast Analysis 2023-2030 (US$)
Table 24: Feed Fats and Proteins Market Sales Forecast Analysis 2023-2030 (Units)
Table 25: Feed Fats and Proteins Market, Revenue & Volume, By Source, 2023-2030 ($)
Table 26: Feed Fats and Proteins Market By Source, Revenue & Volume, By Animal, 2023-2030 ($)
Table 27: Feed Fats and Proteins Market By Source, Revenue & Volume, By Plants, 2023-2030 ($)
Table 28: Feed Fats and Proteins Market, Revenue & Volume, By Livestock, 2023-2030 ($)
Table 29: Feed Fats and Proteins Market By Livestock, Revenue & Volume, By Ruminants, 2023-2030 ($)
Table 30: Feed Fats and Proteins Market By Livestock, Revenue & Volume, By Poultry, 2023-2030 ($)
Table 31: Feed Fats and Proteins Market By Livestock, Revenue & Volume, By Aqua, 2023-2030 ($)
Table 32: Feed Fats and Proteins Market By Livestock, Revenue & Volume, By Swine, 2023-2030 ($)
Table 33: Feed Fats and Proteins Market By Livestock, Revenue & Volume, By Equine, 2023-2030 ($)
Table 34: North America Feed Fats and Proteins Market, Revenue & Volume, By Source, 2023-2030 ($)
Table 35: North America Feed Fats and Proteins Market, Revenue & Volume, By Livestock, 2023-2030 ($)
Table 36: South america Feed Fats and Proteins Market, Revenue & Volume, By Source, 2023-2030 ($)
Table 37: South america Feed Fats and Proteins Market, Revenue & Volume, By Livestock, 2023-2030 ($)
Table 38: Europe Feed Fats and Proteins Market, Revenue & Volume, By Source, 2023-2030 ($)
Table 39: Europe Feed Fats and Proteins Market, Revenue & Volume, By Livestock, 2023-2030 ($)
Table 40: APAC Feed Fats and Proteins Market, Revenue & Volume, By Source, 2023-2030 ($)
Table 41: APAC Feed Fats and Proteins Market, Revenue & Volume, By Livestock, 2023-2030 ($)
Table 42: Middle East & Africa Feed Fats and Proteins Market, Revenue & Volume, By Source, 2023-2030 ($)
Table 43: Middle East & Africa Feed Fats and Proteins Market, Revenue & Volume, By Livestock, 2023-2030 ($)
Table 44: Russia Feed Fats and Proteins Market, Revenue & Volume, By Source, 2023-2030 ($)
Table 45: Russia Feed Fats and Proteins Market, Revenue & Volume, By Livestock, 2023-2030 ($)
Table 46: Israel Feed Fats and Proteins Market, Revenue & Volume, By Source, 2023-2030 ($)
Table 47: Israel Feed Fats and Proteins Market, Revenue & Volume, By Livestock, 2023-2030 ($)
Table 48: Top Companies 2023 (US$)Feed Fats and Proteins Market, Revenue & Volume
Table 49: Product Launch 2023-2030Feed Fats and Proteins Market, Revenue & Volume
Table 50: Mergers & Acquistions 2023-2030Feed Fats and Proteins Market, Revenue & Volume
List of Figures
Figure 1: Overview of Feed Fats and Proteins Market 2023-2030
Figure 2: Market Share Analysis for Feed Fats and Proteins Market 2023 (US$)
Figure 3: Product Comparison in Feed Fats and Proteins Market 2023-2030 (US$)
Figure 4: End User Profile for Feed Fats and Proteins Market 2023-2030 (US$)
Figure 5: Patent Application and Grant in Feed Fats and Proteins Market 2013-2023* (US$)
Figure 6: Top 5 Companies Financial Analysis in Feed Fats and Proteins Market 2023-2030 (US$)
Figure 7: Market Entry Strategy in Feed Fats and Proteins Market 2023-2030
Figure 8: Ecosystem Analysis in Feed Fats and Proteins Market 2023
Figure 9: Average Selling Price in Feed Fats and Proteins Market 2023-2030
Figure 10: Top Opportunites in Feed Fats and Proteins Market 2023-2030
Figure 11: Market Life Cycle Analysis in Feed Fats and Proteins Market
Figure 12: GlobalBy SourceFeed Fats and Proteins Market Revenue, 2023-2030 ($)
Figure 13: GlobalBy LivestockFeed Fats and Proteins Market Revenue, 2023-2030 ($)
Figure 14: Global Feed Fats and Proteins Market - By Geography
Figure 15: Global Feed Fats and Proteins Market Value & Volume, By Geography, 2023-2030 ($)
Figure 16: Global Feed Fats and Proteins Market CAGR, By Geography, 2023-2030 (%)
Figure 17: North America Feed Fats and Proteins Market Value & Volume, 2023-2030 ($)
Figure 18: US Feed Fats and Proteins Market Value & Volume, 2023-2030 ($)
Figure 19: US GDP and Population, 2023-2030 ($)
Figure 20: US GDP – Composition of 2023, By Sector of Origin
Figure 21: US Export and Import Value & Volume, 2023-2030 ($)
Figure 22: Canada Feed Fats and Proteins Market Value & Volume, 2023-2030 ($)
Figure 23: Canada GDP and Population, 2023-2030 ($)
Figure 24: Canada GDP – Composition of 2023, By Sector of Origin
Figure 25: Canada Export and Import Value & Volume, 2023-2030 ($)
Figure 26: Mexico Feed Fats and Proteins Market Value & Volume, 2023-2030 ($)
Figure 27: Mexico GDP and Population, 2023-2030 ($)
Figure 28: Mexico GDP – Composition of 2023, By Sector of Origin
Figure 29: Mexico Export and Import Value & Volume, 2023-2030 ($)
Figure 30: South America Feed Fats and Proteins Market Value & Volume, 2023-2030 ($)
Figure 31: Brazil Feed Fats and Proteins Market Value & Volume, 2023-2030 ($)
Figure 32: Brazil GDP and Population, 2023-2030 ($)
Figure 33: Brazil GDP – Composition of 2023, By Sector of Origin
Figure 34: Brazil Export and Import Value & Volume, 2023-2030 ($)
Figure 35: Venezuela Feed Fats and Proteins Market Value & Volume, 2023-2030 ($)
Figure 36: Venezuela GDP and Population, 2023-2030 ($)
Figure 37: Venezuela GDP – Composition of 2023, By Sector of Origin
Figure 38: Venezuela Export and Import Value & Volume, 2023-2030 ($)
Figure 39: Argentina Feed Fats and Proteins Market Value & Volume, 2023-2030 ($)
Figure 40: Argentina GDP and Population, 2023-2030 ($)
Figure 41: Argentina GDP – Composition of 2023, By Sector of Origin
Figure 42: Argentina Export and Import Value & Volume, 2023-2030 ($)
Figure 43: Ecuador Feed Fats and Proteins Market Value & Volume, 2023-2030 ($)
Figure 44: Ecuador GDP and Population, 2023-2030 ($)
Figure 45: Ecuador GDP – Composition of 2023, By Sector of Origin
Figure 46: Ecuador Export and Import Value & Volume, 2023-2030 ($)
Figure 47: Peru Feed Fats and Proteins Market Value & Volume, 2023-2030 ($)
Figure 48: Peru GDP and Population, 2023-2030 ($)
Figure 49: Peru GDP – Composition of 2023, By Sector of Origin
Figure 50: Peru Export and Import Value & Volume, 2023-2030 ($)
Figure 51: Colombia Feed Fats and Proteins Market Value & Volume, 2023-2030 ($)
Figure 52: Colombia GDP and Population, 2023-2030 ($)
Figure 53: Colombia GDP – Composition of 2023, By Sector of Origin
Figure 54: Colombia Export and Import Value & Volume, 2023-2030 ($)
Figure 55: Costa Rica Feed Fats and Proteins Market Value & Volume, 2023-2030 ($)
Figure 56: Costa Rica GDP and Population, 2023-2030 ($)
Figure 57: Costa Rica GDP – Composition of 2023, By Sector of Origin
Figure 58: Costa Rica Export and Import Value & Volume, 2023-2030 ($)
Figure 59: Europe Feed Fats and Proteins Market Value & Volume, 2023-2030 ($)
Figure 60: U.K Feed Fats and Proteins Market Value & Volume, 2023-2030 ($)
Figure 61: U.K GDP and Population, 2023-2030 ($)
Figure 62: U.K GDP – Composition of 2023, By Sector of Origin
Figure 63: U.K Export and Import Value & Volume, 2023-2030 ($)
Figure 64: Germany Feed Fats and Proteins Market Value & Volume, 2023-2030 ($)
Figure 65: Germany GDP and Population, 2023-2030 ($)
Figure 66: Germany GDP – Composition of 2023, By Sector of Origin
Figure 67: Germany Export and Import Value & Volume, 2023-2030 ($)
Figure 68: Italy Feed Fats and Proteins Market Value & Volume, 2023-2030 ($)
Figure 69: Italy GDP and Population, 2023-2030 ($)
Figure 70: Italy GDP – Composition of 2023, By Sector of Origin
Figure 71: Italy Export and Import Value & Volume, 2023-2030 ($)
Figure 72: France Feed Fats and Proteins Market Value & Volume, 2023-2030 ($)
Figure 73: France GDP and Population, 2023-2030 ($)
Figure 74: France GDP – Composition of 2023, By Sector of Origin
Figure 75: France Export and Import Value & Volume, 2023-2030 ($)
Figure 76: Netherlands Feed Fats and Proteins Market Value & Volume, 2023-2030 ($)
Figure 77: Netherlands GDP and Population, 2023-2030 ($)
Figure 78: Netherlands GDP – Composition of 2023, By Sector of Origin
Figure 79: Netherlands Export and Import Value & Volume, 2023-2030 ($)
Figure 80: Belgium Feed Fats and Proteins Market Value & Volume, 2023-2030 ($)
Figure 81: Belgium GDP and Population, 2023-2030 ($)
Figure 82: Belgium GDP – Composition of 2023, By Sector of Origin
Figure 83: Belgium Export and Import Value & Volume, 2023-2030 ($)
Figure 84: Spain Feed Fats and Proteins Market Value & Volume, 2023-2030 ($)
Figure 85: Spain GDP and Population, 2023-2030 ($)
Figure 86: Spain GDP – Composition of 2023, By Sector of Origin
Figure 87: Spain Export and Import Value & Volume, 2023-2030 ($)
Figure 88: Denmark Feed Fats and Proteins Market Value & Volume, 2023-2030 ($)
Figure 89: Denmark GDP and Population, 2023-2030 ($)
Figure 90: Denmark GDP – Composition of 2023, By Sector of Origin
Figure 91: Denmark Export and Import Value & Volume, 2023-2030 ($)
Figure 92: APAC Feed Fats and Proteins Market Value & Volume, 2023-2030 ($)
Figure 93: China Feed Fats and Proteins Market Value & Volume, 2023-2030
Figure 94: China GDP and Population, 2023-2030 ($)
Figure 95: China GDP – Composition of 2023, By Sector of Origin
Figure 96: China Export and Import Value & Volume, 2023-2030 ($)Feed Fats and Proteins Market China Export and Import Value & Volume, 2023-2030 ($)
Figure 97: Australia Feed Fats and Proteins Market Value & Volume, 2023-2030 ($)
Figure 98: Australia GDP and Population, 2023-2030 ($)
Figure 99: Australia GDP – Composition of 2023, By Sector of Origin
Figure 100: Australia Export and Import Value & Volume, 2023-2030 ($)
Figure 101: South Korea Feed Fats and Proteins Market Value & Volume, 2023-2030 ($)
Figure 102: South Korea GDP and Population, 2023-2030 ($)
Figure 103: South Korea GDP – Composition of 2023, By Sector of Origin
Figure 104: South Korea Export and Import Value & Volume, 2023-2030 ($)
Figure 105: India Feed Fats and Proteins Market Value & Volume, 2023-2030 ($)
Figure 106: India GDP and Population, 2023-2030 ($)
Figure 107: India GDP – Composition of 2023, By Sector of Origin
Figure 108: India Export and Import Value & Volume, 2023-2030 ($)
Figure 109: Taiwan Feed Fats and Proteins Market Value & Volume, 2023-2030 ($)
Figure 110: Taiwan GDP and Population, 2023-2030 ($)
Figure 111: Taiwan GDP – Composition of 2023, By Sector of Origin
Figure 112: Taiwan Export and Import Value & Volume, 2023-2030 ($)
Figure 113: Malaysia Feed Fats and Proteins Market Value & Volume, 2023-2030 ($)
Figure 114: Malaysia GDP and Population, 2023-2030 ($)
Figure 115: Malaysia GDP – Composition of 2023, By Sector of Origin
Figure 116: Malaysia Export and Import Value & Volume, 2023-2030 ($)
Figure 117: Hong Kong Feed Fats and Proteins Market Value & Volume, 2023-2030 ($)
Figure 118: Hong Kong GDP and Population, 2023-2030 ($)
Figure 119: Hong Kong GDP – Composition of 2023, By Sector of Origin
Figure 120: Hong Kong Export and Import Value & Volume, 2023-2030 ($)
Figure 121: Middle East & Africa Feed Fats and Proteins Market Middle East & Africa 3D Printing Market Value & Volume, 2023-2030 ($)
Figure 122: Russia Feed Fats and Proteins Market Value & Volume, 2023-2030 ($)
Figure 123: Russia GDP and Population, 2023-2030 ($)
Figure 124: Russia GDP – Composition of 2023, By Sector of Origin
Figure 125: Russia Export and Import Value & Volume, 2023-2030 ($)
Figure 126: Israel Feed Fats and Proteins Market Value & Volume, 2023-2030 ($)
Figure 127: Israel GDP and Population, 2023-2030 ($)
Figure 128: Israel GDP – Composition of 2023, By Sector of Origin
Figure 129: Israel Export and Import Value & Volume, 2023-2030 ($)
Figure 130: Entropy Share, By Strategies, 2023-2030* (%)Feed Fats and Proteins Market
Figure 131: Developments, 2023-2030*Feed Fats and Proteins Market
Figure 132: Company 1 Feed Fats and Proteins Market Net Revenue, By Years, 2023-2030* ($)
Figure 133: Company 1 Feed Fats and Proteins Market Net Revenue Share, By Business segments, 2023 (%)
Figure 134: Company 1 Feed Fats and Proteins Market Net Sales Share, By Geography, 2023 (%)
Figure 135: Company 2 Feed Fats and Proteins Market Net Revenue, By Years, 2023-2030* ($)
Figure 136: Company 2 Feed Fats and Proteins Market Net Revenue Share, By Business segments, 2023 (%)
Figure 137: Company 2 Feed Fats and Proteins Market Net Sales Share, By Geography, 2023 (%)
Figure 138: Company 3 Feed Fats and Proteins Market Net Revenue, By Years, 2023-2030* ($)
Figure 139: Company 3 Feed Fats and Proteins Market Net Revenue Share, By Business segments, 2023 (%)
Figure 140: Company 3 Feed Fats and Proteins Market Net Sales Share, By Geography, 2023 (%)
Figure 141: Company 4 Feed Fats and Proteins Market Net Revenue, By Years, 2023-2030* ($)
Figure 142: Company 4 Feed Fats and Proteins Market Net Revenue Share, By Business segments, 2023 (%)
Figure 143: Company 4 Feed Fats and Proteins Market Net Sales Share, By Geography, 2023 (%)
Figure 144: Company 5 Feed Fats and Proteins Market Net Revenue, By Years, 2023-2030* ($)
Figure 145: Company 5 Feed Fats and Proteins Market Net Revenue Share, By Business segments, 2023 (%)
Figure 146: Company 5 Feed Fats and Proteins Market Net Sales Share, By Geography, 2023 (%)
Figure 147: Company 6 Feed Fats and Proteins Market Net Revenue, By Years, 2023-2030* ($)
Figure 148: Company 6 Feed Fats and Proteins Market Net Revenue Share, By Business segments, 2023 (%)
Figure 149: Company 6 Feed Fats and Proteins Market Net Sales Share, By Geography, 2023 (%)
Figure 150: Company 7 Feed Fats and Proteins Market Net Revenue, By Years, 2023-2030* ($)
Figure 151: Company 7 Feed Fats and Proteins Market Net Revenue Share, By Business segments, 2023 (%)
Figure 152: Company 7 Feed Fats and Proteins Market Net Sales Share, By Geography, 2023 (%)
Figure 153: Company 8 Feed Fats and Proteins Market Net Revenue, By Years, 2023-2030* ($)
Figure 154: Company 8 Feed Fats and Proteins Market Net Revenue Share, By Business segments, 2023 (%)
Figure 155: Company 8 Feed Fats and Proteins Market Net Sales Share, By Geography, 2023 (%)
Figure 156: Company 9 Feed Fats and Proteins Market Net Revenue, By Years, 2023-2030* ($)
Figure 157: Company 9 Feed Fats and Proteins Market Net Revenue Share, By Business segments, 2023 (%)
Figure 158: Company 9 Feed Fats and Proteins Market Net Sales Share, By Geography, 2023 (%)
Figure 159: Company 10 Feed Fats and Proteins Market Net Revenue, By Years, 2023-2030* ($)
Figure 160: Company 10 Feed Fats and Proteins Market Net Revenue Share, By Business segments, 2023 (%)
Figure 161: Company 10 Feed Fats and Proteins Market Net Sales Share, By Geography, 2023 (%)
Figure 162: Company 11 Feed Fats and Proteins Market Net Revenue, By Years, 2023-2030* ($)
Figure 163: Company 11 Feed Fats and Proteins Market Net Revenue Share, By Business segments, 2023 (%)
Figure 164: Company 11 Feed Fats and Proteins Market Net Sales Share, By Geography, 2023 (%)
Figure 165: Company 12 Feed Fats and Proteins Market Net Revenue, By Years, 2023-2030* ($)
Figure 166: Company 12 Feed Fats and Proteins Market Net Revenue Share, By Business segments, 2023 (%)
Figure 167: Company 12 Feed Fats and Proteins Market Net Sales Share, By Geography, 2023 (%)
Figure 168: Company 13 Feed Fats and Proteins Market Net Revenue, By Years, 2023-2030* ($)
Figure 169: Company 13 Feed Fats and Proteins Market Net Revenue Share, By Business segments, 2023 (%)
Figure 170: Company 13 Feed Fats and Proteins Market Net Sales Share, By Geography, 2023 (%)
Figure 171: Company 14 Feed Fats and Proteins Market Net Revenue, By Years, 2023-2030* ($)
Figure 172: Company 14 Feed Fats and Proteins Market Net Revenue Share, By Business segments, 2023 (%)
Figure 173: Company 14 Feed Fats and Proteins Market Net Sales Share, By Geography, 2023 (%)
Figure 174: Company 15 Feed Fats and Proteins Market Net Revenue, By Years, 2023-2030* ($)
Figure 175: Company 15 Feed Fats and Proteins Market Net Revenue Share, By Business segments, 2023 (%)
Figure 176: Company 15 Feed Fats and Proteins Market Net Sales Share, By Geography, 2023 (%)