 Email
Email Print
Print


Mobile Money Market Overview
Mobile Money Market is forecast to reach $456.50 billion by 2030 at a CAGR of 15.2% during 2024-2030. The Mobile Money market is experiencing exponential growth, fueled by the increased utilization of technology in financial transactions and the burgeoning presence of various e-commerce platforms. This trajectory is expected to persist during the forecast period as more individuals worldwide embrace the convenience and efficiency of mobile payment solutions. For instance, In the United Kingdom, findings from the U.K Government’s Financial Lives Survey 2022 indicate a notable shift towards mobile payments, with 47% of adults engaging in this mode of transaction. Similarly, in Germany, mobile devices are responsible for approximately 21% of retail transactions, underscoring the widespread adoption of Mobile Money solutions in mature markets. Additionally, in many regions, particularly in developing countries, Mobile Moneys have witnessed remarkable popularity due to the proliferation of smartphones and the expansion of digital banking services. This trend is indicative of a global movement towards cashless economies, driven by the convenience, security, and accessibility afforded by mobile payment platforms. Moreover, Consumers are increasingly drawn to the seamless experience offered by Mobile Moneys, which eliminate the need for physical cash or cards, streamline transactions, and enhance financial inclusivity. Increasing adoption of non-cash transactions will likely create the demand for the Mobile Money market in the forecast period 2024 to 2030.
Market Snapshot :-

Report Coverage
The report: “Mobile Money Market – Forecast (2024-2030)”, by IndustryARC, covers an in-depth analysis of the following segments of the Mobile Money Market.
By Mode Of Payment: Remote Payment, NFC Payment.
By Stakeholder: Mobile Network Operator, Handset and Other Hardware Solution Manufacturer, Oss/Bss Solution Provider, Software Developer and Cloud Computing, Content and Application Aggregator.
By Application: Mobile Commerce, Mobile Ticketing, Mobile Coupon, Mobile Transfer, Micropayments
By Geography: By Geography: North America, Asia Pacific, Europe, Middle East & Africa, South America, RoW
Key Takeaways
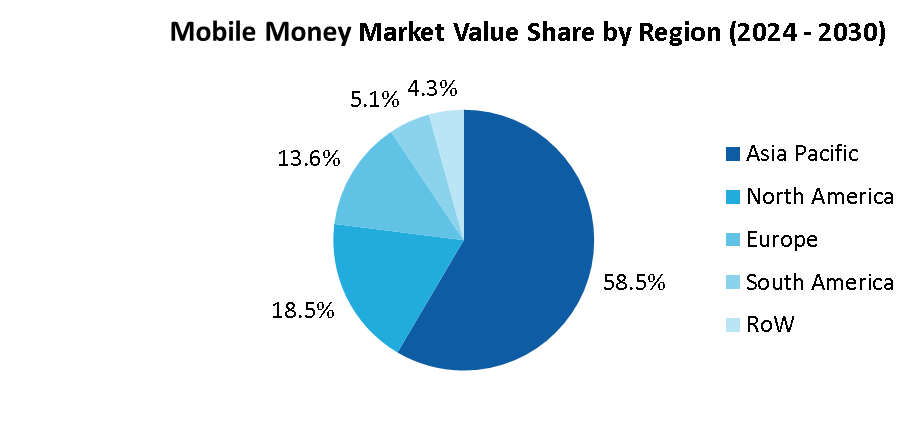
- Asia Pacific dominated the Mobile Money landscape with a 58.45% market share owing to a rise in a number of e-commerce platforms including Flipkart and Alibaba, favorable government initiatives, and regulations to promote the use of digital payment channels.
- NFC technology is estimated to grow at a CAGR of over 29% during the forecast period owing to its ease of use and improved security options as it enables smartphones to exchange data and function as a payment device.
- The COVID-19 pandemic accelerated the shift towards contactless payments, further boosting the adoption of Mobile Moneys. Consumers are increasingly preferring contactless payment methods to minimize physical contact and reduce the risk of virus transmission.
- Mobile Money Market Report forecasts that size is driven by operational efficiency and cost-effectiveness by reducing the processing fees across various industry verticals.
For More Details on This Report - Request for Sample
By Mode of Payment - Segment Analysis
NFC (near-field communication) technology is estimated to grow at a CAGR of over 17.56% during the forecast period. The growing adoption of non-contact payment solutions along with the integration of NFC chips into smart devices is driving the market growth. The popularity of NFC mobile payments is owed to its ease of use and improved security options. It enables smartphones to exchange data and function as a secure payment device, stores the customer’s credit card details, and allows the user to pay at NFC POS terminals through smartphones. NFC mobile payments also help merchants attain operating cost benefits such as reduced cash processing and more effective consumer engagement. Companies are increasingly NFC technologies into their mobile payment solutions to allow fast and easy payment. For instance, in 2022, Google Pay introduced NFC payment, enabling users to conveniently tap their phones on payment terminals, initiating the app automatically for seamless transactions. Confirming payments became effortless with this feature. Similarly, several Android and Microsoft Windows smartphones have also adopted the NFC technology to aid contactless payments. All these technological developments will create the demand for the market.
By Type - Segment Analysis
The semi-closed mobile is growing at the highest CAGR of 14.56% during the forecast period as this wallet requires minimum details for a transaction. Technology players such as Uber, Ola, Flipkart, MakeMyTrip, Paytm, and Amazon are focusing on investing in semi-closed wallets to provide integrated banking experiences to their customers. Companies are leveraging their technological background to provide innovative product offerings to their users. These investments and funding will improve the demand for semi-closed wallets thereby creating opportunities for Mobile Moneys.
Geography - Segment Analysis
Asia Pacific dominated the Mobile Money market share for about 58.45% of the total market in 2023. The economy of APAC is majorly influenced by countries such as China and India. In these countries, the market is driven by a rising number of e-commerce platforms including Flipkart and Alibaba, favorable government initiatives and. For instance, according to the Indian Press Information Bureau, UPI is ubiquitous, spanning street vendors to malls. India leads global digital transactions at 46%, per 2022 data, followed by China, Thailand, and South Korea. Its widespread adoption showcases India's pivotal role in advancing digital payment ecosystems worldwide. Similarly, As of March 2022, Alipay was utilized by 93% of China's digital payment users, with 86% opting for WeChat Pay. These two platforms dominate China's mobile payment sector, collectively commanding over 90% of the market share. This underscores the pivotal role of Asian countries in advancing digital payment ecosystems globally, indicating a robust and continuously growing demand for Mobile Money services across the region
Drivers –Mobile Money Market
Acceptance of Mobile Money payments and offers provided by them.
Mobile Money Market size is driven by the acceptance of Mobile Money payments across various industry verticals. The Mobile Money is a virtual wallet in payment enabled mobile phones has augmented the operational efficiency and cost-effectiveness by reducing the processing fees. For instance, PayPal has expanded its operations across approximately 200 countries, allowing the customers to link their Mobile Moneys to their bank accounts and allowing them to carry a balance. On the other hand, the incentives offered by the Mobile Money companies through discounts and cashbacks augment their demand among individuals. For instance, Amazon Pay offers cashbacks on transactions conducted through it. This kind of offers and incentives will rapidly create the demand for Mobile Moneys.
Initiatives and Regulations of government
The government is pushing players in the banking and payments ecosystem to encourage cashless payments at merchant outlets through Mobile Moneys. For instance, in 2023, India's government aims to expand digital payment services nationwide, ensuring accessibility and convenience for all segments of the population. Similarly. in September 2023, the National Payments Corporation of India (NPCI) introduced 4 new UPI features following UPI's milestone of 10 billion transactions per month. These innovations aim to boost monthly transactions to 100 billion, enhancing user experiences and streamlining payment processes significantly. These initiatives and regulations will create demand for Mobile Moneys.
Challenges – Mobile Money Market
Low Trust in Mobile Moneys
Low trust in Mobile Moneys is a major factor that will hamper the market in the forecast period. For instance, according to the report given by YouGov, about 43% of mobile users don’t trust Mobile Moneys and 38% have low confidence in security. Similarly, most of the consumers are reluctant to adapt to Mobile Moneys as contactless payment presents huge unknown risks and fraud like leaked data, hacking, and e-wallet vulnerabilities. Moreover, less awareness about the benefits of using Mobile Moneys over using cash or credit cards and debit cards for online payment and buying expensive items. All these conditions will restrain the market growth in the forecast period
Market Landscape
Partnership and acquisitions are key strategies adopted by players in the Mobile Money market. Mobile Money's top 10 companies include Apple Inc., Google LLC, Alipay, Square, PayPal, Samsung Electronics, Visa Inc, First Data Corporation, Mastercard Inc., The American Express Company, among others.
Acquisitions/Technology Launches
- In June 2023, Google Wallet expanded its reach into five additional countries, including Albania, Argentina, Bosnia and Herzegovina, North Macedonia, and Montenegro. With NFC support, users can utilize tap-to-pay functionality on Android devices, including Wear OS devices. This expansion follows Google's previous introduction of the app to 12 countries in November.
- In July 2023, PayPal expanded Tap to Pay to Android for Venmo and Zettle, enhancing SMBs' access to mobile payments. This democratizing move empowers businesses with seamless, contactless transactions, fostering financial inclusion and convenience.
- In January 2023, Samsung Electronics expanded Samsung Wallet availability to Australia, Brazil, Canada, Hong Kong, India, Malaysia, Singapore, and Taiwan, offering Galaxy users a secure and convenient app for organizing daily essentials.
1. Mobile Money Market - Overview
1.1 Definitions and Scope
2. Mobile Money Market - Executive Summary
2.1 Key Trends by Mode of Payment
2.2 Key Trends by Stakeholder
2.3 Key Trends by Application
2.4 Key Trends by Geography
3. Mobile Money Market - Comparative Analysis
3.1 Company Benchmarking
3.2 Global Financial Analysis
3.3 Market Share Analysis
3.4 Patent Analysis
3.5 Pricing Analysis
4. Mobile Money Market - Start-up Companies Scenario
4.1 Key Start-up Company Analysis by
4.1.1 Investment
4.1.2 Revenue
4.1.3 Venture Capital and Funding Scenario
5. Mobile Money Market – Market Entry Scenario Premium
5.1 Regulatory Framework Overview
5.2 New Business and Ease of Doing Business Index
5.3 Case Studies of Successful Ventures
6. Mobile Money Market - Forces
6.1 Market Drivers
6.2 Market Constraints/Challenges
6.3 Porter’s Five Force Model
6.3.1 Bargaining power of suppliers
6.3.2 Bargaining powers of customers
6.3.3 Threat of new entrants
6.3.4 Rivalry among existing players
6.3.5 Threat of substitutes
7. Mobile Money Market – Strategic Analysis
7.1 Value Chain Analysis
7.2 Opportunities Analysis
7.3 Market Life Cycle
8. Mobile Money Market– By Mode Of Payment (Market Size -$Million/Billion)
8.1 Remote Payment
8.2 NFC Payment
9. Mobile Money Market– By Stakeholder (Market Size -$Million/Billion)
9.1 Mobile Network Operator
9.2 Handset And Other Hardware Solution Manufacturer
9.3 Oss/Bss Solution Provider
9.4 Software Developer and Cloud Computing
9.5 Content And Application Aggregator
10. Mobile Money Market – By Application (Market Size -$Million/Billion)
10.1 Mobile Commerce
10.1.1 Mobile Money Shopping
10.1.2 Mobile Money Bill Payment
10.1.3 Mobile Money Hotel Booking and Payment
10.1.4 Mobile Money Entertainment and Event Pay
10.2 Mobile Ticketing
10.2.1 Rail Metro and Bus Ticket
10.2.2 Airline Ticket and Boarding Pass
10.3 Mobile Coupon
10.4 Mobile Transfer
10.5 Micropayments
11. Mobile Money Market – by Geography (Market Size - $Million/$Billion)
11.1 North America
11.1.1 U.S.
11.1.2 Canada
11.1.3 Mexico
11.2 Europe
11.2.1 U.K.
11.2.2 Germany
11.2.3 France
11.2.4 Italy
11.2.5 Spain
11.2.6 Rest of Europe
11.3 Asia-Pacific
11.3.1 China
11.3.2 Japan
11.3.3 India
11.3.4 South Korea
11.3.5 Australia & New Zealand
11.3.6 Rest of Asia-Pacific
11.4 South America
11.4.1 Brazil
11.4.2 Argentina
11.4.3 Rest of South America
11.5 Rest of The World
11.5.1 Middle East
11.5.2 Africa
12. Mobile Money Market - Entropy
13. Mobile Money Market – Industry/Segment Competition Landscape
13.1 Market Share Analysis
13.1.1 Global Market Share – Key Companies
13.1.2 Market Share by Region – Key Companies
13.1.3 Market Share by Countries – Key Companies
13.2 Competition Matrix
13.3 Best Practices for Companies
14. Mobile Money Market – Key Company List by Country Premium
15. Mobile Money Market- Company Analysis
15.1 Apple Inc
15.2 Google LLC
15.3 Square
15.4 Alipay
15.5 PayPal
15.6 Samsung Electronics
15.7 Visa Inc
15.8 First Data Corporation
15.9 Mastercard Inc.
15.10 The American Express Company
* "Financials would be provided to private companies on best-efforts basis."
Connect with our experts to get customized reports that best suit your requirements. Our reports include global-level data, niche markets and competitive landscape.
List of Tables
Table 1 Mobile Money Market Overview 2023-2030
Table 2 Mobile Money Market Leader Analysis 2023-2030 (US$)
Table 3 Mobile Money MarketProduct Analysis 2023-2030 (US$)
Table 4 Mobile Money MarketEnd User Analysis 2023-2030 (US$)
Table 5 Mobile Money MarketPatent Analysis 2013-2023* (US$)
Table 6 Mobile Money MarketFinancial Analysis 2023-2030 (US$)
Table 7 Mobile Money Market Driver Analysis 2023-2030 (US$)
Table 8 Mobile Money MarketChallenges Analysis 2023-2030 (US$)
Table 9 Mobile Money MarketConstraint Analysis 2023-2030 (US$)
Table 10 Mobile Money Market Supplier Bargaining Power Analysis 2023-2030 (US$)
Table 11 Mobile Money Market Buyer Bargaining Power Analysis 2023-2030 (US$)
Table 12 Mobile Money Market Threat of Substitutes Analysis 2023-2030 (US$)
Table 13 Mobile Money Market Threat of New Entrants Analysis 2023-2030 (US$)
Table 14 Mobile Money Market Degree of Competition Analysis 2023-2030 (US$)
Table 15 Mobile Money MarketValue Chain Analysis 2023-2030 (US$)
Table 16 Mobile Money MarketPricing Analysis 2023-2030 (US$)
Table 17 Mobile Money MarketOpportunities Analysis 2023-2030 (US$)
Table 18 Mobile Money MarketProduct Life Cycle Analysis 2023-2030 (US$)
Table 19 Mobile Money MarketSupplier Analysis 2023-2030 (US$)
Table 20 Mobile Money MarketDistributor Analysis 2023-2030 (US$)
Table 21 Mobile Money Market Trend Analysis 2023-2030 (US$)
Table 22 Mobile Money Market Size 2023 (US$)
Table 23 Mobile Money Market Forecast Analysis 2023-2030 (US$)
Table 24 Mobile Money Market Sales Forecast Analysis 2023-2030 (Units)
Table 25 Mobile Money Market, Revenue & Volume,By Transaction Mode, 2023-2030 ($)
Table 26 Mobile Money MarketBy Transaction Mode, Revenue & Volume,By Introduction, 2023-2030 ($)
Table 27 Mobile Money MarketBy Transaction Mode, Revenue & Volume,By Near Field Communication (NFC)/Smart Cards, 2023-2030 ($)
Table 28 Mobile Money MarketBy Transaction Mode, Revenue & Volume,By Direct Mobile Billing, 2023-2030 ($)
Table 29 Mobile Money MarketBy Transaction Mode, Revenue & Volume,By Mobile Web/Web Payments, 2023-2030 ($)
Table 30 Mobile Money MarketBy Transaction Mode, Revenue & Volume,By Short Message Services (SMS), 2023-2030 ($)
Table 31 Mobile Money Market, Revenue & Volume,By Nature Of Payments, 2023-2030 ($)
Table 32 Mobile Money MarketBy Nature Of Payments, Revenue & Volume,By Person to Person(P2P), 2023-2030 ($)
Table 33 Mobile Money MarketBy Nature Of Payments, Revenue & Volume,By Person to Business(P2B), 2023-2030 ($)
Table 34 Mobile Money MarketBy Nature Of Payments, Revenue & Volume,By Business to Person(B2P), 2023-2030 ($)
Table 35 Mobile Money MarketBy Nature Of Payments, Revenue & Volume,By Business to Business(B2B), 2023-2030 ($)
Table 36 Mobile Money Market, Revenue & Volume,By Location, 2023-2030 ($)
Table 37 Mobile Money MarketBy Location, Revenue & Volume,By Remote Payments, 2023-2030 ($)
Table 38 Mobile Money MarketBy Location, Revenue & Volume,By Proximity Payments, 2023-2030 ($)
Table 39 Mobile Money Market, Revenue & Volume,By Type Of Purchase, 2023-2030 ($)
Table 40 Mobile Money MarketBy Type Of Purchase, Revenue & Volume,By Airtime Transfers and Top-Ups, 2023-2030 ($)
Table 41 Mobile Money MarketBy Type Of Purchase, Revenue & Volume,By Money Transfers and Payments, 2023-2030 ($)
Table 42 Mobile Money MarketBy Type Of Purchase, Revenue & Volume,By Merchandise and Coupons, 2023-2030 ($)
Table 43 Mobile Money MarketBy Type Of Purchase, Revenue & Volume,By Travelling /Ticketing and Food, 2023-2030 ($)
Table 44 Mobile Money MarketBy Type Of Purchase, Revenue & Volume,By Digital Products, 2023-2030 ($)
Table 45 North America Mobile Money Market, Revenue & Volume,By Transaction Mode, 2023-2030 ($)
Table 46 North America Mobile Money Market, Revenue & Volume,By Nature Of Payments, 2023-2030 ($)
Table 47 North America Mobile Money Market, Revenue & Volume,By Location, 2023-2030 ($)
Table 48 North America Mobile Money Market, Revenue & Volume,By Type Of Purchase, 2023-2030 ($)
Table 49 South america Mobile Money Market, Revenue & Volume,By Transaction Mode, 2023-2030 ($)
Table 50 South america Mobile Money Market, Revenue & Volume,By Nature Of Payments, 2023-2030 ($)
Table 51 South america Mobile Money Market, Revenue & Volume,By Location, 2023-2030 ($)
Table 52 South america Mobile Money Market, Revenue & Volume,By Type Of Purchase, 2023-2030 ($)
Table 53 Europe Mobile Money Market, Revenue & Volume,By Transaction Mode, 2023-2030 ($)
Table 54 Europe Mobile Money Market, Revenue & Volume,By Nature Of Payments, 2023-2030 ($)
Table 55 Europe Mobile Money Market, Revenue & Volume,By Location, 2023-2030 ($)
Table 56 Europe Mobile Money Market, Revenue & Volume,By Type Of Purchase, 2023-2030 ($)
Table 57 APAC Mobile Money Market, Revenue & Volume,By Transaction Mode, 2023-2030 ($)
Table 58 APAC Mobile Money Market, Revenue & Volume,By Nature Of Payments, 2023-2030 ($)
Table 59 APAC Mobile Money Market, Revenue & Volume,By Location, 2023-2030 ($)
Table 60 APAC Mobile Money Market, Revenue & Volume,By Type Of Purchase, 2023-2030 ($)
Table 61 Middle East & Africa Mobile Money Market, Revenue & Volume,By Transaction Mode, 2023-2030 ($)
Table 62 Middle East & Africa Mobile Money Market, Revenue & Volume,By Nature Of Payments, 2023-2030 ($)
Table 63 Middle East & Africa Mobile Money Market, Revenue & Volume,By Location, 2023-2030 ($)
Table 64 Middle East & Africa Mobile Money Market, Revenue & Volume,By Type Of Purchase, 2023-2030 ($)
Table 65 Russia Mobile Money Market, Revenue & Volume,By Transaction Mode, 2023-2030 ($)
Table 66 Russia Mobile Money Market, Revenue & Volume,By Nature Of Payments, 2023-2030 ($)
Table 67 Russia Mobile Money Market, Revenue & Volume,By Location, 2023-2030 ($)
Table 68 Russia Mobile Money Market, Revenue & Volume,By Type Of Purchase, 2023-2030 ($)
Table 69 Israel Mobile Money Market, Revenue & Volume,By Transaction Mode, 2023-2030 ($)
Table 70 Israel Mobile Money Market, Revenue & Volume,By Nature Of Payments, 2023-2030 ($)
Table 71 Israel Mobile Money Market, Revenue & Volume,By Location, 2023-2030 ($)
Table 72 Israel Mobile Money Market, Revenue & Volume,By Type Of Purchase, 2023-2030 ($)
Table 73 Top Companies 2023 (US$)Mobile Money Market, Revenue & Volume,,
Table 74 Product Launch 2023-2030Mobile Money Market, Revenue & Volume,,
Table 75 Mergers & Acquistions 2023-2030Mobile Money Market, Revenue & Volume,,
List of Figures
Figure 1 Overview of Mobile Money Market 2023-2030
Figure 2 Market Share Analysis for Mobile Money Market 2023 (US$)
Figure 3 Product Comparison in Mobile Money Market 2023-2030 (US$)
Figure 4 End User Profile for Mobile Money Market 2023-2030 (US$)
Figure 5 Patent Application and Grant in Mobile Money Market 2013-2023* (US$)
Figure 6 Top 5 Companies Financial Analysis in Mobile Money Market 2023-2030 (US$)
Figure 7 Market Entry Strategy in Mobile Money Market 2023-2030
Figure 8 Ecosystem Analysis in Mobile Money Market2023
Figure 9 Average Selling Price in Mobile Money Market 2023-2030
Figure 10 Top Opportunites in Mobile Money Market 2023-2030
Figure 11 Market Life Cycle Analysis in Mobile Money Market
Figure 12 GlobalBy Transaction ModeMobile Money Market Revenue, 2023-2030 ($)
Figure 13 GlobalBy Nature Of PaymentsMobile Money Market Revenue, 2023-2030 ($)
Figure 14 GlobalBy LocationMobile Money Market Revenue, 2023-2030 ($)
Figure 15 GlobalBy Type Of PurchaseMobile Money Market Revenue, 2023-2030 ($)
Figure 16 Global Mobile Money Market - By Geography
Figure 17 Global Mobile Money Market Value & Volume, By Geography, 2023-2030 ($)
Figure 18 Global Mobile Money Market CAGR, By Geography, 2023-2030 (%)
Figure 19 North America Mobile Money Market Value & Volume, 2023-2030 ($)
Figure 20 US Mobile Money Market Value & Volume, 2023-2030 ($)
Figure 21 US GDP and Population, 2023-2030 ($)
Figure 22 US GDP – Composition of 2023, By Sector of Origin
Figure 23 US Export and Import Value & Volume, 2023-2030 ($)
Figure 24 Canada Mobile Money Market Value & Volume, 2023-2030 ($)
Figure 25 Canada GDP and Population, 2023-2030 ($)
Figure 26 Canada GDP – Composition of 2023, By Sector of Origin
Figure 27 Canada Export and Import Value & Volume, 2023-2030 ($)
Figure 28 Mexico Mobile Money Market Value & Volume, 2023-2030 ($)
Figure 29 Mexico GDP and Population, 2023-2030 ($)
Figure 30 Mexico GDP – Composition of 2023, By Sector of Origin
Figure 31 Mexico Export and Import Value & Volume, 2023-2030 ($)
Figure 32 South America Mobile Money MarketSouth America 3D Printing Market Value & Volume, 2023-2030 ($)
Figure 33 Brazil Mobile Money Market Value & Volume, 2023-2030 ($)
Figure 34 Brazil GDP and Population, 2023-2030 ($)
Figure 35 Brazil GDP – Composition of 2023, By Sector of Origin
Figure 36 Brazil Export and Import Value & Volume, 2023-2030 ($)
Figure 37 Venezuela Mobile Money Market Value & Volume, 2023-2030 ($)
Figure 38 Venezuela GDP and Population, 2023-2030 ($)
Figure 39 Venezuela GDP – Composition of 2023, By Sector of Origin
Figure 40 Venezuela Export and Import Value & Volume, 2023-2030 ($)
Figure 41 Argentina Mobile Money Market Value & Volume, 2023-2030 ($)
Figure 42 Argentina GDP and Population, 2023-2030 ($)
Figure 43 Argentina GDP – Composition of 2023, By Sector of Origin
Figure 44 Argentina Export and Import Value & Volume, 2023-2030 ($)
Figure 45 Ecuador Mobile Money Market Value & Volume, 2023-2030 ($)
Figure 46 Ecuador GDP and Population, 2023-2030 ($)
Figure 47 Ecuador GDP – Composition of 2023, By Sector of Origin
Figure 48 Ecuador Export and Import Value & Volume, 2023-2030 ($)
Figure 49 Peru Mobile Money Market Value & Volume, 2023-2030 ($)
Figure 50 Peru GDP and Population, 2023-2030 ($)
Figure 51 Peru GDP – Composition of 2023, By Sector of Origin
Figure 52 Peru Export and Import Value & Volume, 2023-2030 ($)
Figure 53 Colombia Mobile Money Market Value & Volume, 2023-2030 ($)
Figure 54 Colombia GDP and Population, 2023-2030 ($)
Figure 55 Colombia GDP – Composition of 2023, By Sector of Origin
Figure 56 Colombia Export and Import Value & Volume, 2023-2030 ($)
Figure 57 Costa Rica Mobile Money MarketCosta Rica 3D Printing Market Value & Volume, 2023-2030 ($)
Figure 58 Costa Rica GDP and Population, 2023-2030 ($)
Figure 59 Costa Rica GDP – Composition of 2023, By Sector of Origin
Figure 60 Costa Rica Export and Import Value & Volume, 2023-2030 ($)
Figure 61 Europe Mobile Money Market Value & Volume, 2023-2030 ($)
Figure 62 U.K Mobile Money Market Value & Volume, 2023-2030 ($)
Figure 63 U.K GDP and Population, 2023-2030 ($)
Figure 64 U.K GDP – Composition of 2023, By Sector of Origin
Figure 65 U.K Export and Import Value & Volume, 2023-2030 ($)
Figure 66 Germany Mobile Money Market Value & Volume, 2023-2030 ($)
Figure 67 Germany GDP and Population, 2023-2030 ($)
Figure 68 Germany GDP – Composition of 2023, By Sector of Origin
Figure 69 Germany Export and Import Value & Volume, 2023-2030 ($)
Figure 70 Italy Mobile Money Market Value & Volume, 2023-2030 ($)
Figure 71 Italy GDP and Population, 2023-2030 ($)
Figure 72 Italy GDP – Composition of 2023, By Sector of Origin
Figure 73 Italy Export and Import Value & Volume, 2023-2030 ($)
Figure 74 France Mobile Money Market Value & Volume, 2023-2030 ($)
Figure 75 France GDP and Population, 2023-2030 ($)
Figure 76 France GDP – Composition of 2023, By Sector of Origin
Figure 77 France Export and Import Value & Volume, 2023-2030 ($)
Figure 78 Netherlands Mobile Money Market Value & Volume, 2023-2030 ($)
Figure 79 Netherlands GDP and Population, 2023-2030 ($)
Figure 80 Netherlands GDP – Composition of 2023, By Sector of Origin
Figure 81 Netherlands Export and Import Value & Volume, 2023-2030 ($)
Figure 82 Belgium Mobile Money Market Value & Volume, 2023-2030 ($)
Figure 83 Belgium GDP and Population, 2023-2030 ($)
Figure 84 Belgium GDP – Composition of 2023, By Sector of Origin
Figure 85 Belgium Export and Import Value & Volume, 2023-2030 ($)
Figure 86 Spain Mobile Money Market Value & Volume, 2023-2030 ($)
Figure 87 Spain GDP and Population, 2023-2030 ($)
Figure 88 Spain GDP – Composition of 2023, By Sector of Origin
Figure 89 Spain Export and Import Value & Volume, 2023-2030 ($)
Figure 90 Denmark Mobile Money Market Value & Volume, 2023-2030 ($)
Figure 91 Denmark GDP and Population, 2023-2030 ($)
Figure 92 Denmark GDP – Composition of 2023, By Sector of Origin
Figure 93 Denmark Export and Import Value & Volume, 2023-2030 ($)
Figure 94 APAC Mobile Money Market Value & Volume, 2023-2030 ($)
Figure 95 China Mobile Money MarketValue & Volume, 2023-2030
Figure 96 China GDP and Population, 2023-2030 ($)
Figure 97 China GDP – Composition of 2023, By Sector of Origin
Figure 98 China Export and Import Value & Volume, 2023-2030 ($)Mobile Money MarketChina Export and Import Value & Volume, 2023-2030 ($)
Figure 99 Australia Mobile Money Market Value & Volume, 2023-2030 ($)
Figure 100 Australia GDP and Population, 2023-2030 ($)
Figure 101 Australia GDP – Composition of 2023, By Sector of Origin
Figure 102 Australia Export and Import Value & Volume, 2023-2030 ($)
Figure 103 South Korea Mobile Money Market Value & Volume, 2023-2030 ($)
Figure 104 South Korea GDP and Population, 2023-2030 ($)
Figure 105 South Korea GDP – Composition of 2023, By Sector of Origin
Figure 106 South Korea Export and Import Value & Volume, 2023-2030 ($)
Figure 107 India Mobile Money Market Value & Volume, 2023-2030 ($)
Figure 108 India GDP and Population, 2023-2030 ($)
Figure 109 India GDP – Composition of 2023, By Sector of Origin
Figure 110 India Export and Import Value & Volume, 2023-2030 ($)
Figure 111 Taiwan Mobile Money MarketTaiwan 3D Printing Market Value & Volume, 2023-2030 ($)
Figure 112 Taiwan GDP and Population, 2023-2030 ($)
Figure 113 Taiwan GDP – Composition of 2023, By Sector of Origin
Figure 114 Taiwan Export and Import Value & Volume, 2023-2030 ($)
Figure 115 Malaysia Mobile Money MarketMalaysia 3D Printing Market Value & Volume, 2023-2030 ($)
Figure 116 Malaysia GDP and Population, 2023-2030 ($)
Figure 117 Malaysia GDP – Composition of 2023, By Sector of Origin
Figure 118 Malaysia Export and Import Value & Volume, 2023-2030 ($)
Figure 119 Hong Kong Mobile Money MarketHong Kong 3D Printing Market Value & Volume, 2023-2030 ($)
Figure 120 Hong Kong GDP and Population, 2023-2030 ($)
Figure 121 Hong Kong GDP – Composition of 2023, By Sector of Origin
Figure 122 Hong Kong Export and Import Value & Volume, 2023-2030 ($)
Figure 123 Middle East & Africa Mobile Money MarketMiddle East & Africa 3D Printing Market Value & Volume, 2023-2030 ($)
Figure 124 Russia Mobile Money MarketRussia 3D Printing Market Value & Volume, 2023-2030 ($)
Figure 125 Russia GDP and Population, 2023-2030 ($)
Figure 126 Russia GDP – Composition of 2023, By Sector of Origin
Figure 127 Russia Export and Import Value & Volume, 2023-2030 ($)
Figure 128 Israel Mobile Money Market Value & Volume, 2023-2030 ($)
Figure 129 Israel GDP and Population, 2023-2030 ($)
Figure 130 Israel GDP – Composition of 2023, By Sector of Origin
Figure 131 Israel Export and Import Value & Volume, 2023-2030 ($)
Figure 132 Entropy Share, By Strategies, 2023-2030* (%)Mobile Money Market
Figure 133 Developments, 2023-2030*Mobile Money Market
Figure 134 Company 1 Mobile Money Market Net Revenue, By Years, 2023-2030* ($)
Figure 135 Company 1 Mobile Money Market Net Revenue Share, By Business segments, 2023 (%)
Figure 136 Company 1 Mobile Money Market Net Sales Share, By Geography, 2023 (%)
Figure 137 Company 2 Mobile Money Market Net Revenue, By Years, 2023-2030* ($)
Figure 138 Company 2 Mobile Money Market Net Revenue Share, By Business segments, 2023 (%)
Figure 139 Company 2 Mobile Money Market Net Sales Share, By Geography, 2023 (%)
Figure 140 Company 3Mobile Money Market Net Revenue, By Years, 2023-2030* ($)
Figure 141 Company 3Mobile Money Market Net Revenue Share, By Business segments, 2023 (%)
Figure 142 Company 3Mobile Money Market Net Sales Share, By Geography, 2023 (%)
Figure 143 Company 4 Mobile Money Market Net Revenue, By Years, 2023-2030* ($)
Figure 144 Company 4 Mobile Money Market Net Revenue Share, By Business segments, 2023 (%)
Figure 145 Company 4 Mobile Money Market Net Sales Share, By Geography, 2023 (%)
Figure 146 Company 5 Mobile Money Market Net Revenue, By Years, 2023-2030* ($)
Figure 147 Company 5 Mobile Money Market Net Revenue Share, By Business segments, 2023 (%)
Figure 148 Company 5 Mobile Money Market Net Sales Share, By Geography, 2023 (%)
Figure 149 Company 6 Mobile Money Market Net Revenue, By Years, 2023-2030* ($)
Figure 150 Company 6 Mobile Money Market Net Revenue Share, By Business segments, 2023 (%)
Figure 151 Company 6 Mobile Money Market Net Sales Share, By Geography, 2023 (%)
Figure 152 Company 7 Mobile Money Market Net Revenue, By Years, 2023-2030* ($)
Figure 153 Company 7 Mobile Money Market Net Revenue Share, By Business segments, 2023 (%)
Figure 154 Company 7 Mobile Money Market Net Sales Share, By Geography, 2023 (%)
Figure 155 Company 8 Mobile Money Market Net Revenue, By Years, 2023-2030* ($)
Figure 156 Company 8 Mobile Money Market Net Revenue Share, By Business segments, 2023 (%)
Figure 157 Company 8 Mobile Money Market Net Sales Share, By Geography, 2023 (%)
Figure 158 Company 9 Mobile Money Market Net Revenue, By Years, 2023-2030* ($)
Figure 159 Company 9 Mobile Money Market Net Revenue Share, By Business segments, 2023 (%)
Figure 160 Company 9 Mobile Money Market Net Sales Share, By Geography, 2023 (%)
Figure 161 Company 10 Mobile Money Market Net Revenue, By Years, 2023-2030* ($)
Figure 162 Company 10 Mobile Money Market Net Revenue Share, By Business segments, 2023 (%)
Figure 163 Company 10 Mobile Money Market Net Sales Share, By Geography, 2023 (%)
Figure 164 Company 11 Mobile Money Market Net Revenue, By Years, 2023-2030* ($)
Figure 165 Company 11 Mobile Money Market Net Revenue Share, By Business segments, 2023 (%)
Figure 166 Company 11 Mobile Money Market Net Sales Share, By Geography, 2023 (%)
Figure 167 Company 12 Mobile Money Market Net Revenue, By Years, 2023-2030* ($)
Figure 168 Company 12 Mobile Money Market Net Revenue Share, By Business segments, 2023 (%)
Figure 169 Company 12 Mobile Money Market Net Sales Share, By Geography, 2023 (%)
Figure 170 Company 13Mobile Money Market Net Revenue, By Years, 2023-2030* ($)
Figure 171 Company 13Mobile Money Market Net Revenue Share, By Business segments, 2023 (%)
Figure 172 Company 13Mobile Money Market Net Sales Share, By Geography, 2023 (%)
Figure 173 Company 14 Mobile Money Market Net Revenue, By Years, 2023-2030* ($)
Figure 174 Company 14 Mobile Money Market Net Revenue Share, By Business segments, 2023 (%)
Figure 175 Company 14 Mobile Money Market Net Sales Share, By Geography, 2023 (%)
Figure 176 Company 15 Mobile Money Market Net Revenue, By Years, 2023-2030* ($)
Figure 177 Company 15 Mobile Money Market Net Revenue Share, By Business segments, 2023 (%)
Figure 178 Company 15 Mobile Money Market Net Sales Share, By Geography, 2023 (%)