 Email
Email Print
Print


Point-Of-Use Water Treatment System Market - Forecast(2024 - 2030)
Point-of-Use Water Treatment Systems Market Overview:
Point-of-Use Water Treatment Systems are becoming exceedingly common across various application facilities particularly in homes, schools, residential and non-residential facilities. The main goal of such systems are for the treatment of smaller, continuous supply of water for consumption. This market is segmented based on its technology, design, applicable standards and end users.
Point-of-Use Water Treatment Systems Market Outlook:
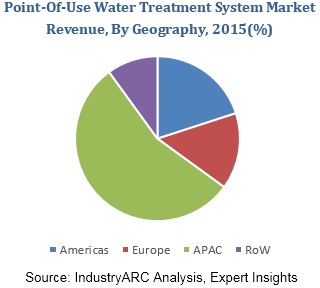
According to an IndustryArc report, Point-of-Use Water Treatment Systems market was valuated at $9.5 billion in 2015 and is expected to reach $15.6 billion by 2022. Water purification has become the need of the hour as UN records more than 4 billion cases of diarrhea every year due with the major cause being water contamination. Health institutes, public organizations, governments and NGOs have been aggressive in promoting many of these water treatment systems particularly in the developing countries where access to safe drinking water is limited or scarce.
Point-of-Use Water Treatment Systems Market Growth drivers:
One of the major growth contributors to the Point-of-Use Water Treatment Systems market is the growing human population especially in the developing countries with a current population of 7.6 billion. It is expected to rise to 8.6 billion in 2030. This exponential growth will surely trigger a rise in demand for Point-of-Use Water Treatment Systems as natural resources such as clean water become scarcer.
Innovative, sustainable and energy efficient water treatment technologies are being innovated almost daily due to the immensely high demand for safe and pure drinking water. Nanotechnology based solutions, UV and UF treatment combinations, organic and biodegradable filtering solutions are some of the key innovations been developed. Furthermore, the lack of access to safe drinking water is a global issue that affects all humanity and thus this triggered a global participation in developing newer treatment technologies that is affordable to the common man especially in the developing countries.
Point-of-Use Water Treatment Systems Market Challenges:
The prime challenge faced by the Point-of-Use Water Treatment Systems market is the varying quality of water available across a wide geographical area. The chemical and physical properties of water differ from place to place, such as heavy metal contamination, hard and soft water, etc. This means key players need to design either universal water treatment solution or particular treatment solutions targeting particular geographical areas.
Another major challenge to the Point-of-Use Water Treatment Systems market is the wide penetration of purified water bottle companies that also serve to solve the problem of unsustainable and toxic drinking water. Places like Flint, Michigan, USA has an aggravated problem of lead contamination in drinking water. Thus, bottled water seem to be the safer option compared to Point-of-Use Water Treatment Systems as perceived by the affected citizens. During the Flint water crisis, many residents claimed that they do not trust filter systems but only choose to use bottled water. Thus the trust level in these Point-of-Use Water Treatment Systems were at an all-time low, especially when it was the right time, for an increase in demand for such systems.
Point-of-Use Water Treatment Systems Market Research Scope:
The base year of the study is 2017, with forecast done up to 2023. The study presents a thorough analysis of the competitive landscape, taking into account the market shares of the leading companies. It also provides information on unit shipments. These provide the key market participants with the necessary business intelligence and help them understand the future of the Point-of-Use Water Treatment Systems market. The assessment includes the forecast, an overview of the competitive structure, the market shares of the competitors, as well as the market trends, market demands, market drivers, market challenges, and product analysis. The market drivers and restraints have been assessed to fathom their impact over the forecast period. This report further identifies the key opportunities for growth while also detailing the key challenges and possible threats. The key areas of focus include the types of plastics in the Point-of-Use Water Treatment Systems market, and their specific applications in different types of vehicles.
Point-of-Use Water Treatment Systems Market Report: Industry Coverage
Point-of-Use Water Treatment Systems– By Technology: Filtration Methods, Reverse Osmosis Systems, Distillation Systems, etc
Point-of-Use Water Treatment Systems– By Design: Personal water bottle with filter, Pour through filter with pitcher, Faucet Mounted Filter with diverter, etc
Point-of-Use Water Treatment Systems– By Applicable Standards: NSF International, ANSI (American National Standards Institute), US EPA (Environmental Protection Agency), JWPA (Japan Water Purifier Association), etc
Point-of-Use Water Treatment Systems– By End User: Residential and Non-Residential
The Point-of-Use Water Treatment Systems market report also analyzes the major geographic regions for the market as well as the major countries for the market in these regions. The regions and countries covered in the study include:
- North America: The U.S., Canada, Mexico
- South America: Brazil, Venezuela, Argentina, Ecuador, Peru, Colombia, Costa Rica
- Europe: The U.K., Germany, Italy, France, The Netherlands, Belgium, Spain, Denmark
- APAC: China, Japan, Australia, South Korea, India, Taiwan, Malaysia, Hong Kong
- Middle East and Africa: Israel, South Africa, Saudi Arabia
Point-of-Use Water Treatment Systems Market Key Players Perspective:
Some of the Key players in this market that have been studied for this report include: CP Kelco Oil Field Group, Huntsman Corporation, Croda International PLC, Weatherford International, Stepan Company, Enviro Fluid, Rimpro-India, Evonik Industries AG, Flotek Industries and others
Market Research and Market Trends of Point-of-Use Water Treatment Systems Market
- Researchers at the Yale University have developed a nanocoagulant material for the treatment of water contaminants. This new nanotechnology based water treatment system was inspired by the sea organism named, Actinia that captures its prey using its tentacles. This treatment method is highly novel, as it significantly removes contaminants in a single coagulative action, without the need for multiple treatment processes. Creating an efficient and easy-to-operate technology to remove all contaminants from water is key to addressing global water scarcity.
- Based on World Health Organization, there are an estimated 1.7 billion cases of childhood diarrhoeal disease every year as a result of lack of safe drinking water and sanitation. Researchers in India have recently come up with a solution to this problem with a water treatment system using nanotechnology. This water treatment technology uses composite nanoparticles that emit silver ions which result in destroying contaminants. The researchers claim that this kind of water treatment systems using nanotechnology, will have a vital role in the future water treatment system market.
- Havells India recently entered the Point-of-Use Water Treatment Systems market, with one of its key products named Havells Max 100% RO & UV. This new product claims to include 7 purification segments including UV and RO treatment processes. As new players enter the water purification market segment in developing countries like India confirms the theory that increasing urbanization pan India, would lead to an increase in demand for Point-of-Use Water Treatment Systems in the future.
- Fairey Industrial Ceramics Limited trading as Doulton Water Filters.
1. Point-of-Use Water Treatment Systems Market - Overview
1.1. Definitions and Scope
2. Point-of-Use Water Treatment Systems Market - Executive summary
2.1. Market Revenue, Market Size and Key Trends by Company
2.2. Key Trends by type of Application
2.3. Key Trends segmented by Geography
3. Point-of-Use Water Treatment Systems Market
3.1. Comparative analysis
3.1.1. Product Benchmarking - Top 10 companies
3.1.2. Top 5 Financials Analysis
3.1.3. Market Value split by Top 10 companies
3.1.4. Patent Analysis - Top 10 companies
3.1.5. Pricing Analysis
4. Point-of-Use Water Treatment Systems Market – Startup companies Scenario Premium
4.1. Top 10 startup company Analysis by
4.1.1. Investment
4.1.2. Revenue
4.1.3. Market Shares
4.1.4. Market Size and Application Analysis
4.1.5. Venture Capital and Funding Scenario
5. Point-of-Use Water Treatment Systems Market – Industry Market Entry Scenario Premium
5.1. Regulatory Framework Overview
5.2. New Business and Ease of Doing business index
5.3. Case studies of successful ventures
5.4. Customer Analysis – Top 10 companies
6. Point-of-Use Water Treatment Systems Market Forces
6.1. Drivers
6.2. Constraints
6.3. Challenges
6.4. Porters five force model
6.4.1. Bargaining power of suppliers
6.4.2. Bargaining powers of customers
6.4.3. Threat of new entrants
6.4.4. Rivalry among existing players
6.4.5. Threat of substitutes
7. Point-of-Use Water Treatment Systems Market -Strategic analysis
7.1. Value chain analysis
7.2. Opportunities analysis
7.3. Product life cycle
8. Point-of-Use Water Treatment Systems - By Technology (Market Size -$Million / $Billion)
8.1. Segment type Size and Market Share Analysis
8.2. Application Revenue and Trends by type of Application
8.3. Application Segment Analysis by Type
8.3.1. Filtration Methods
8.3.1.1. Mechanical Filters
8.3.1.2. Activated Carbon Filters
8.3.1.2.1. Block Form
8.3.1.2.2. Granular Form
8.3.1.3. Bio-sand Filters
8.3.1.4. Cartridge Filters
8.3.2. Reverse Osmosis Systems
8.3.3. Distillation Systems
8.3.4. Disinfection and Oxidation
8.3.4.1. UV Radiation
8.3.4.2. Ozonization
8.3.4.3. Chlorination
8.3.5. Ion Exchange
8.3.5.1. Anion Exchange
8.3.5.2. Cation Exchange
8.3.6. Air Stripping/Aeration
8.3.6.1. Packed Tower Aeration
8.3.7. Others
9. Point-of-Use Water Treatment Systems - By End User (Market Size -$Million / $Billion)
9.1. Residential
9.2. Non-Residential
9.2.1. Educational Institutions
9.2.2. Commercial
9.2. Healthcare
9.2.4. Industrial
10. Point-of-Use Water Treatment Systems - By Design (Market Size -$Million / $Billion)
10.1. Personalwater bottle with filter
10.2. Pour through filter with pitcher
10.3. Faucet Mounted Filter with diverter.
10.4. Counter top manual fill system.
10.5. Counter top system connected to sink faucet.
10.6. Plumbed into sink faucet.
10.7. Plumbed into separate tap
10.8. Replacement Filters
10.9. Flow-Through Units
10.10. Others
11. Point-of-Use Water Treatment Systems - By Applicable Standards/Regulations (Market Size -$Million / $Billion)
11.1. NSF International
11.2. ANSI (American National Standards Institute)
11.3. US EPA (Environmental Protection Agency)
11.4. JWPA (Japan Water Purifier Association)
11.5. Others
12. Point-of-Use Water Treatment Systems - By Geography (Market Size -$Million / $Billion)
12.1. Point-of-Use Water Treatment Systems Market - North America Segment Research
12.2. North America Market Research (Million / $Billion)
12.2.1. Segment type Size and Market Size Analysis
12.2.2. Revenue and Trends
12.2.3. Application Revenue and Trends by type of Application
12.2.4. Company Revenue and Product Analysis
12.2.5. North America Product type and Application Market Size
12.2.5.1. U.S.
12.2.5.2. Canada
12.2.5.3. Mexico
12.2.5.4. Rest of North America
12.3. Point-of-Use Water Treatment Systems - South America Segment Research
12.4. South America Market Research (Market Size -$Million / $Billion)
12.4.1. Segment type Size and Market Size Analysis
12.4.2. Revenue and Trends
12.4.3. Application Revenue and Trends by type of Application
12.4.4. Company Revenue and Product Analysis
12.4.5. South America Product type and Application Market Size
12.4.5.1. Brazil
12.4.5.2. Venezuela
12.4.5.3. Argentina
12.4.5.4. Ecuador
12.4.5.5. Peru
12.4.5.6. Colombia
12.4.5.7. Costa Rica
12.4.5.8. Rest of South America
12.5. Point-of-Use Water Treatment Systems - Europe Segment Research
12.6. Europe Market Research (Market Size -$Million / $Billion)
12.6.1. Segment type Size and Market Size Analysis
12.6.2. Revenue and Trends
12.6.3. Application Revenue and Trends by type of Application
12.6.4. Company Revenue and Product Analysis
12.6.5. Europe Segment Product type and Application Market Size
12.6.5.1. U.K
12.6.5.2. Germany
12.6.5.3. Italy
12.6.5.4. France
12.6.5.5. Netherlands
12.6.5.6. Belgium
12.6.5.7. Spain
12.6.5.8. Denmark
12.6.5.9. Rest of Europe
12.7. Point-of-Use Water Treatment Systems – APAC Segment Research
12.8. APAC Market Research (Market Size -$Million / $Billion)
12.8.1. Segment type Size and Market Size Analysis
12.8.2. Revenue and Trends
12.8.3. Application Revenue and Trends by type of Application
12.8.4. Company Revenue and Product Analysis
12.8.5. APAC Segment – Product type and Application Market Size
12.8.5.1. China
12.8.5.2. Australia
12.8.5.3. Japan
12.8.5.4. South Korea
12.8.5.5. India
12.8.5.6. Taiwan
12.8.5.7. Malaysia
13. Point-of-Use Water Treatment Systems Market - Entropy
13.1. New product launches
13.2. M&A's, collaborations, JVs and partnerships
14. Point-of-Use Water Treatment Systems Market – Industry / Segment Competition landscape Premium
14.1. Market Share Analysis
14.1.1. Market Share by Country- Top companies
14.1.2. Market Share by Region- Top 10 companies
14.1.3. Market Share by type of Application – Top 10 companies
14.1.4. Market Share by type of Product / Product category- Top 10 companies
14.1.5. Market Share at global level- Top 10 companies
14.1.6. Best Practises for companies
15. Point-of-Use Water Treatment Systems Market – Key Company List by Country Premium
16. Point-of-Use Water Treatment Systems Market Company Analysis
16.1. Market Share, Company Revenue, Products, M&A, Developments
16.2. CP Kelco Oil Field Group
16.3. Huntsman Corporation
16.4. Croda International PLC
16.5. Weatherford International
16.6. Stepan Company
16.7. Enviro Fluid
16.8. Enviro Fluid
16.9. Enviro Fluid
16.10. Flotek Industries
16.11. Company 10
16.12. Company 11
16.13. Company 12 and more
"*Financials would be provided on a best efforts basis for private companies"
17. Point-of-Use Water Treatment Systems Market -Appendix
17.1. Abbreviations
17.2. Sources
18. Point-of-Use Water Treatment Systems Market -Methodology Premium
18.1. Research Methodology
18.1.1. Company Expert Interviews
18.1.2. Industry Databases
18.1.3. Associations
18.1.4. Company News
18.1.5. Company Annual Reports
18.1.6. Application Trends
18.1.7. New Products and Product database
18.1.8. Company Transcripts
18.1.9. R&D Trends
18.1.10. Key Opinion Leaders Interviews
18.1.11. Supply and Demand Trends
List of Tables
Table 1: Point-Of-Use Water Treatment System Market Overview 2023-2030
Table 2: Point-Of-Use Water Treatment System Market Leader Analysis 2023-2030 (US$)
Table 3: Point-Of-Use Water Treatment System Market Product Analysis 2023-2030 (US$)
Table 4: Point-Of-Use Water Treatment System Market End User Analysis 2023-2030 (US$)
Table 5: Point-Of-Use Water Treatment System Market Patent Analysis 2013-2023* (US$)
Table 6: Point-Of-Use Water Treatment System Market Financial Analysis 2023-2030 (US$)
Table 7: Point-Of-Use Water Treatment System Market Driver Analysis 2023-2030 (US$)
Table 8: Point-Of-Use Water Treatment System Market Challenges Analysis 2023-2030 (US$)
Table 9: Point-Of-Use Water Treatment System Market Constraint Analysis 2023-2030 (US$)
Table 10: Point-Of-Use Water Treatment System Market Supplier Bargaining Power Analysis 2023-2030 (US$)
Table 11: Point-Of-Use Water Treatment System Market Buyer Bargaining Power Analysis 2023-2030 (US$)
Table 12: Point-Of-Use Water Treatment System Market Threat of Substitutes Analysis 2023-2030 (US$)
Table 13: Point-Of-Use Water Treatment System Market Threat of New Entrants Analysis 2023-2030 (US$)
Table 14: Point-Of-Use Water Treatment System Market Degree of Competition Analysis 2023-2030 (US$)
Table 15: Point-Of-Use Water Treatment System Market Value Chain Analysis 2023-2030 (US$)
Table 16: Point-Of-Use Water Treatment System Market Pricing Analysis 2023-2030 (US$)
Table 17: Point-Of-Use Water Treatment System Market Opportunities Analysis 2023-2030 (US$)
Table 18: Point-Of-Use Water Treatment System Market Product Life Cycle Analysis 2023-2030 (US$)
Table 19: Point-Of-Use Water Treatment System Market Supplier Analysis 2023-2030 (US$)
Table 20: Point-Of-Use Water Treatment System Market Distributor Analysis 2023-2030 (US$)
Table 21: Point-Of-Use Water Treatment System Market Trend Analysis 2023-2030 (US$)
Table 22: Point-Of-Use Water Treatment System Market Size 2023 (US$)
Table 23: Point-Of-Use Water Treatment System Market Forecast Analysis 2023-2030 (US$)
Table 24: Point-Of-Use Water Treatment System Market Sales Forecast Analysis 2023-2030 (Units)
Table 25: Point-Of-Use Water Treatment System Market, Revenue & Volume, By Technology, 2023-2030 ($)
Table 26: Point-Of-Use Water Treatment System Market By Technology, Revenue & Volume, By Filtration Methods, 2023-2030 ($)
Table 27: Point-Of-Use Water Treatment System Market By Technology, Revenue & Volume, By Reverse Osmosis Systems, 2023-2030 ($)
Table 28: Point-Of-Use Water Treatment System Market By Technology, Revenue & Volume, By Distillation Systems, 2023-2030 ($)
Table 29: Point-Of-Use Water Treatment System Market By Technology, Revenue & Volume, By Disinfection and Oxidation, 2023-2030 ($)
Table 30: Point-Of-Use Water Treatment System Market By Technology, Revenue & Volume, By Ion Exchange, 2023-2030 ($)
Table 31: Point-Of-Use Water Treatment System Market, Revenue & Volume, By Devices, 2023-2030 ($)
Table 32: Point-Of-Use Water Treatment System Market By Devices, Revenue & Volume, By Tabletop Pitcher, 2023-2030 ($)
Table 33: Point-Of-Use Water Treatment System Market By Devices, Revenue & Volume, By Faucet-Mounted Filters, 2023-2030 ($)
Table 34: Point-Of-Use Water Treatment System Market By Devices, Revenue & Volume, By Counter-Top Units, 2023-2030 ($)
Table 35: Point-Of-Use Water Treatment System Market By Devices, Revenue & Volume, By Under-the-Sink Filters, 2023-2030 ($)
Table 36: Point-Of-Use Water Treatment System Market By Devices, Revenue & Volume, By Replacement Filters, 2023-2030 ($)
Table 37: Point-Of-Use Water Treatment System Market, Revenue & Volume, By End User, 2023-2030 ($)
Table 38: Point-Of-Use Water Treatment System Market By End User, Revenue & Volume, By Residential, 2023-2030 ($)
Table 39: Point-Of-Use Water Treatment System Market By End User, Revenue & Volume, By Non-Residential, 2023-2030 ($)
Table 40: North America Point-Of-Use Water Treatment System Market, Revenue & Volume, By Technology, 2023-2030 ($)
Table 41: North America Point-Of-Use Water Treatment System Market, Revenue & Volume, By Devices, 2023-2030 ($)
Table 42: North America Point-Of-Use Water Treatment System Market, Revenue & Volume, By End User, 2023-2030 ($)
Table 43: South america Point-Of-Use Water Treatment System Market, Revenue & Volume, By Technology, 2023-2030 ($)
Table 44: South america Point-Of-Use Water Treatment System Market, Revenue & Volume, By Devices, 2023-2030 ($)
Table 45: South america Point-Of-Use Water Treatment System Market, Revenue & Volume, By End User, 2023-2030 ($)
Table 46: Europe Point-Of-Use Water Treatment System Market, Revenue & Volume, By Technology, 2023-2030 ($)
Table 47: Europe Point-Of-Use Water Treatment System Market, Revenue & Volume, By Devices, 2023-2030 ($)
Table 48: Europe Point-Of-Use Water Treatment System Market, Revenue & Volume, By End User, 2023-2030 ($)
Table 49: APAC Point-Of-Use Water Treatment System Market, Revenue & Volume, By Technology, 2023-2030 ($)
Table 50: APAC Point-Of-Use Water Treatment System Market, Revenue & Volume, By Devices, 2023-2030 ($)
Table 51: APAC Point-Of-Use Water Treatment System Market, Revenue & Volume, By End User, 2023-2030 ($)
Table 52: Middle East & Africa Point-Of-Use Water Treatment System Market, Revenue & Volume, By Technology, 2023-2030 ($)
Table 53: Middle East & Africa Point-Of-Use Water Treatment System Market, Revenue & Volume, By Devices, 2023-2030 ($)
Table 54: Middle East & Africa Point-Of-Use Water Treatment System Market, Revenue & Volume, By End User, 2023-2030 ($)
Table 55: Russia Point-Of-Use Water Treatment System Market, Revenue & Volume, By Technology, 2023-2030 ($)
Table 56: Russia Point-Of-Use Water Treatment System Market, Revenue & Volume, By Devices, 2023-2030 ($)
Table 57: Russia Point-Of-Use Water Treatment System Market, Revenue & Volume, By End User, 2023-2030 ($)
Table 58: Israel Point-Of-Use Water Treatment System Market, Revenue & Volume, By Technology, 2023-2030 ($)
Table 59: Israel Point-Of-Use Water Treatment System Market, Revenue & Volume, By Devices, 2023-2030 ($)
Table 60: Israel Point-Of-Use Water Treatment System Market, Revenue & Volume, By End User, 2023-2030 ($)
Table 61: Top Companies 2023 (US$)Point-Of-Use Water Treatment System Market, Revenue & Volume
Table 62: Product Launch 2023-2030Point-Of-Use Water Treatment System Market, Revenue & Volume
Table 63: Mergers & Acquistions 2023-2030Point-Of-Use Water Treatment System Market, Revenue & Volume
List of Figures
Figure 1: Overview of Point-Of-Use Water Treatment System Market 2023-2030
Figure 2: Market Share Analysis for Point-Of-Use Water Treatment System Market 2023 (US$)
Figure 3: Product Comparison in Point-Of-Use Water Treatment System Market 2023-2030 (US$)
Figure 4: End User Profile for Point-Of-Use Water Treatment System Market 2023-2030 (US$)
Figure 5: Patent Application and Grant in Point-Of-Use Water Treatment System Market 2013-2023* (US$)
Figure 6: Top 5 Companies Financial Analysis in Point-Of-Use Water Treatment System Market 2023-2030 (US$)
Figure 7: Market Entry Strategy in Point-Of-Use Water Treatment System Market 2023-2030
Figure 8: Ecosystem Analysis in Point-Of-Use Water Treatment System Market 2023
Figure 9: Average Selling Price in Point-Of-Use Water Treatment System Market 2023-2030
Figure 10: Top Opportunites in Point-Of-Use Water Treatment System Market 2023-2030
Figure 11: Market Life Cycle Analysis in Point-Of-Use Water Treatment System Market
Figure 12: GlobalBy TechnologyPoint-Of-Use Water Treatment System Market Revenue, 2023-2030 ($)
Figure 13: GlobalBy DevicesPoint-Of-Use Water Treatment System Market Revenue, 2023-2030 ($)
Figure 14: GlobalBy End UserPoint-Of-Use Water Treatment System Market Revenue, 2023-2030 ($)
Figure 15: Global Point-Of-Use Water Treatment System Market - By Geography
Figure 16: Global Point-Of-Use Water Treatment System Market Value & Volume, By Geography, 2023-2030 ($)
Figure 17: Global Point-Of-Use Water Treatment System Market CAGR, By Geography, 2023-2030 (%)
Figure 18: North America Point-Of-Use Water Treatment System Market Value & Volume, 2023-2030 ($)
Figure 19: US Point-Of-Use Water Treatment System Market Value & Volume, 2023-2030 ($)
Figure 20: US GDP and Population, 2023-2030 ($)
Figure 21: US GDP – Composition of 2023, By Sector of Origin
Figure 22: US Export and Import Value & Volume, 2023-2030 ($)
Figure 23: Canada Point-Of-Use Water Treatment System Market Value & Volume, 2023-2030 ($)
Figure 24: Canada GDP and Population, 2023-2030 ($)
Figure 25: Canada GDP – Composition of 2023, By Sector of Origin
Figure 26: Canada Export and Import Value & Volume, 2023-2030 ($)
Figure 27: Mexico Point-Of-Use Water Treatment System Market Value & Volume, 2023-2030 ($)
Figure 28: Mexico GDP and Population, 2023-2030 ($)
Figure 29: Mexico GDP – Composition of 2023, By Sector of Origin
Figure 30: Mexico Export and Import Value & Volume, 2023-2030 ($)
Figure 31: South America Point-Of-Use Water Treatment System Market Value & Volume, 2023-2030 ($)
Figure 32: Brazil Point-Of-Use Water Treatment System Market Value & Volume, 2023-2030 ($)
Figure 33: Brazil GDP and Population, 2023-2030 ($)
Figure 34: Brazil GDP – Composition of 2023, By Sector of Origin
Figure 35: Brazil Export and Import Value & Volume, 2023-2030 ($)
Figure 36: Venezuela Point-Of-Use Water Treatment System Market Value & Volume, 2023-2030 ($)
Figure 37: Venezuela GDP and Population, 2023-2030 ($)
Figure 38: Venezuela GDP – Composition of 2023, By Sector of Origin
Figure 39: Venezuela Export and Import Value & Volume, 2023-2030 ($)
Figure 40: Argentina Point-Of-Use Water Treatment System Market Value & Volume, 2023-2030 ($)
Figure 41: Argentina GDP and Population, 2023-2030 ($)
Figure 42: Argentina GDP – Composition of 2023, By Sector of Origin
Figure 43: Argentina Export and Import Value & Volume, 2023-2030 ($)
Figure 44: Ecuador Point-Of-Use Water Treatment System Market Value & Volume, 2023-2030 ($)
Figure 45: Ecuador GDP and Population, 2023-2030 ($)
Figure 46: Ecuador GDP – Composition of 2023, By Sector of Origin
Figure 47: Ecuador Export and Import Value & Volume, 2023-2030 ($)
Figure 48: Peru Point-Of-Use Water Treatment System Market Value & Volume, 2023-2030 ($)
Figure 49: Peru GDP and Population, 2023-2030 ($)
Figure 50: Peru GDP – Composition of 2023, By Sector of Origin
Figure 51: Peru Export and Import Value & Volume, 2023-2030 ($)
Figure 52: Colombia Point-Of-Use Water Treatment System Market Value & Volume, 2023-2030 ($)
Figure 53: Colombia GDP and Population, 2023-2030 ($)
Figure 54: Colombia GDP – Composition of 2023, By Sector of Origin
Figure 55: Colombia Export and Import Value & Volume, 2023-2030 ($)
Figure 56: Costa Rica Point-Of-Use Water Treatment System Market Value & Volume, 2023-2030 ($)
Figure 57: Costa Rica GDP and Population, 2023-2030 ($)
Figure 58: Costa Rica GDP – Composition of 2023, By Sector of Origin
Figure 59: Costa Rica Export and Import Value & Volume, 2023-2030 ($)
Figure 60: Europe Point-Of-Use Water Treatment System Market Value & Volume, 2023-2030 ($)
Figure 61: U.K Point-Of-Use Water Treatment System Market Value & Volume, 2023-2030 ($)
Figure 62: U.K GDP and Population, 2023-2030 ($)
Figure 63: U.K GDP – Composition of 2023, By Sector of Origin
Figure 64: U.K Export and Import Value & Volume, 2023-2030 ($)
Figure 65: Germany Point-Of-Use Water Treatment System Market Value & Volume, 2023-2030 ($)
Figure 66: Germany GDP and Population, 2023-2030 ($)
Figure 67: Germany GDP – Composition of 2023, By Sector of Origin
Figure 68: Germany Export and Import Value & Volume, 2023-2030 ($)
Figure 69: Italy Point-Of-Use Water Treatment System Market Value & Volume, 2023-2030 ($)
Figure 70: Italy GDP and Population, 2023-2030 ($)
Figure 71: Italy GDP – Composition of 2023, By Sector of Origin
Figure 72: Italy Export and Import Value & Volume, 2023-2030 ($)
Figure 73: France Point-Of-Use Water Treatment System Market Value & Volume, 2023-2030 ($)
Figure 74: France GDP and Population, 2023-2030 ($)
Figure 75: France GDP – Composition of 2023, By Sector of Origin
Figure 76: France Export and Import Value & Volume, 2023-2030 ($)
Figure 77: Netherlands Point-Of-Use Water Treatment System Market Value & Volume, 2023-2030 ($)
Figure 78: Netherlands GDP and Population, 2023-2030 ($)
Figure 79: Netherlands GDP – Composition of 2023, By Sector of Origin
Figure 80: Netherlands Export and Import Value & Volume, 2023-2030 ($)
Figure 81: Belgium Point-Of-Use Water Treatment System Market Value & Volume, 2023-2030 ($)
Figure 82: Belgium GDP and Population, 2023-2030 ($)
Figure 83: Belgium GDP – Composition of 2023, By Sector of Origin
Figure 84: Belgium Export and Import Value & Volume, 2023-2030 ($)
Figure 85: Spain Point-Of-Use Water Treatment System Market Value & Volume, 2023-2030 ($)
Figure 86: Spain GDP and Population, 2023-2030 ($)
Figure 87: Spain GDP – Composition of 2023, By Sector of Origin
Figure 88: Spain Export and Import Value & Volume, 2023-2030 ($)
Figure 89: Denmark Point-Of-Use Water Treatment System Market Value & Volume, 2023-2030 ($)
Figure 90: Denmark GDP and Population, 2023-2030 ($)
Figure 91: Denmark GDP – Composition of 2023, By Sector of Origin
Figure 92: Denmark Export and Import Value & Volume, 2023-2030 ($)
Figure 93: APAC Point-Of-Use Water Treatment System Market Value & Volume, 2023-2030 ($)
Figure 94: China Point-Of-Use Water Treatment System Market Value & Volume, 2023-2030
Figure 95: China GDP and Population, 2023-2030 ($)
Figure 96: China GDP – Composition of 2023, By Sector of Origin
Figure 97: China Export and Import Value & Volume, 2023-2030 ($)Point-Of-Use Water Treatment System Market China Export and Import Value & Volume, 2023-2030 ($)
Figure 98: Australia Point-Of-Use Water Treatment System Market Value & Volume, 2023-2030 ($)
Figure 99: Australia GDP and Population, 2023-2030 ($)
Figure 100: Australia GDP – Composition of 2023, By Sector of Origin
Figure 101: Australia Export and Import Value & Volume, 2023-2030 ($)
Figure 102: South Korea Point-Of-Use Water Treatment System Market Value & Volume, 2023-2030 ($)
Figure 103: South Korea GDP and Population, 2023-2030 ($)
Figure 104: South Korea GDP – Composition of 2023, By Sector of Origin
Figure 105: South Korea Export and Import Value & Volume, 2023-2030 ($)
Figure 106: India Point-Of-Use Water Treatment System Market Value & Volume, 2023-2030 ($)
Figure 107: India GDP and Population, 2023-2030 ($)
Figure 108: India GDP – Composition of 2023, By Sector of Origin
Figure 109: India Export and Import Value & Volume, 2023-2030 ($)
Figure 110: Taiwan Point-Of-Use Water Treatment System Market Value & Volume, 2023-2030 ($)
Figure 111: Taiwan GDP and Population, 2023-2030 ($)
Figure 112: Taiwan GDP – Composition of 2023, By Sector of Origin
Figure 113: Taiwan Export and Import Value & Volume, 2023-2030 ($)
Figure 114: Malaysia Point-Of-Use Water Treatment System Market Value & Volume, 2023-2030 ($)
Figure 115: Malaysia GDP and Population, 2023-2030 ($)
Figure 116: Malaysia GDP – Composition of 2023, By Sector of Origin
Figure 117: Malaysia Export and Import Value & Volume, 2023-2030 ($)
Figure 118: Hong Kong Point-Of-Use Water Treatment System Market Value & Volume, 2023-2030 ($)
Figure 119: Hong Kong GDP and Population, 2023-2030 ($)
Figure 120: Hong Kong GDP – Composition of 2023, By Sector of Origin
Figure 121: Hong Kong Export and Import Value & Volume, 2023-2030 ($)
Figure 122: Middle East & Africa Point-Of-Use Water Treatment System Market Middle East & Africa 3D Printing Market Value & Volume, 2023-2030 ($)
Figure 123: Russia Point-Of-Use Water Treatment System Market Value & Volume, 2023-2030 ($)
Figure 124: Russia GDP and Population, 2023-2030 ($)
Figure 125: Russia GDP – Composition of 2023, By Sector of Origin
Figure 126: Russia Export and Import Value & Volume, 2023-2030 ($)
Figure 127: Israel Point-Of-Use Water Treatment System Market Value & Volume, 2023-2030 ($)
Figure 128: Israel GDP and Population, 2023-2030 ($)
Figure 129: Israel GDP – Composition of 2023, By Sector of Origin
Figure 130: Israel Export and Import Value & Volume, 2023-2030 ($)
Figure 131: Entropy Share, By Strategies, 2023-2030* (%)Point-Of-Use Water Treatment System Market
Figure 132: Developments, 2023-2030*Point-Of-Use Water Treatment System Market
Figure 133: Company 1 Point-Of-Use Water Treatment System Market Net Revenue, By Years, 2023-2030* ($)
Figure 134: Company 1 Point-Of-Use Water Treatment System Market Net Revenue Share, By Business segments, 2023 (%)
Figure 135: Company 1 Point-Of-Use Water Treatment System Market Net Sales Share, By Geography, 2023 (%)
Figure 136: Company 2 Point-Of-Use Water Treatment System Market Net Revenue, By Years, 2023-2030* ($)
Figure 137: Company 2 Point-Of-Use Water Treatment System Market Net Revenue Share, By Business segments, 2023 (%)
Figure 138: Company 2 Point-Of-Use Water Treatment System Market Net Sales Share, By Geography, 2023 (%)
Figure 139: Company 3 Point-Of-Use Water Treatment System Market Net Revenue, By Years, 2023-2030* ($)
Figure 140: Company 3 Point-Of-Use Water Treatment System Market Net Revenue Share, By Business segments, 2023 (%)
Figure 141: Company 3 Point-Of-Use Water Treatment System Market Net Sales Share, By Geography, 2023 (%)
Figure 142: Company 4 Point-Of-Use Water Treatment System Market Net Revenue, By Years, 2023-2030* ($)
Figure 143: Company 4 Point-Of-Use Water Treatment System Market Net Revenue Share, By Business segments, 2023 (%)
Figure 144: Company 4 Point-Of-Use Water Treatment System Market Net Sales Share, By Geography, 2023 (%)
Figure 145: Company 5 Point-Of-Use Water Treatment System Market Net Revenue, By Years, 2023-2030* ($)
Figure 146: Company 5 Point-Of-Use Water Treatment System Market Net Revenue Share, By Business segments, 2023 (%)
Figure 147: Company 5 Point-Of-Use Water Treatment System Market Net Sales Share, By Geography, 2023 (%)
Figure 148: Company 6 Point-Of-Use Water Treatment System Market Net Revenue, By Years, 2023-2030* ($)
Figure 149: Company 6 Point-Of-Use Water Treatment System Market Net Revenue Share, By Business segments, 2023 (%)
Figure 150: Company 6 Point-Of-Use Water Treatment System Market Net Sales Share, By Geography, 2023 (%)
Figure 151: Company 7 Point-Of-Use Water Treatment System Market Net Revenue, By Years, 2023-2030* ($)
Figure 152: Company 7 Point-Of-Use Water Treatment System Market Net Revenue Share, By Business segments, 2023 (%)
Figure 153: Company 7 Point-Of-Use Water Treatment System Market Net Sales Share, By Geography, 2023 (%)
Figure 154: Company 8 Point-Of-Use Water Treatment System Market Net Revenue, By Years, 2023-2030* ($)
Figure 155: Company 8 Point-Of-Use Water Treatment System Market Net Revenue Share, By Business segments, 2023 (%)
Figure 156: Company 8 Point-Of-Use Water Treatment System Market Net Sales Share, By Geography, 2023 (%)
Figure 157: Company 9 Point-Of-Use Water Treatment System Market Net Revenue, By Years, 2023-2030* ($)
Figure 158: Company 9 Point-Of-Use Water Treatment System Market Net Revenue Share, By Business segments, 2023 (%)
Figure 159: Company 9 Point-Of-Use Water Treatment System Market Net Sales Share, By Geography, 2023 (%)
Figure 160: Company 10 Point-Of-Use Water Treatment System Market Net Revenue, By Years, 2023-2030* ($)
Figure 161: Company 10 Point-Of-Use Water Treatment System Market Net Revenue Share, By Business segments, 2023 (%)
Figure 162: Company 10 Point-Of-Use Water Treatment System Market Net Sales Share, By Geography, 2023 (%)
Figure 163: Company 11 Point-Of-Use Water Treatment System Market Net Revenue, By Years, 2023-2030* ($)
Figure 164: Company 11 Point-Of-Use Water Treatment System Market Net Revenue Share, By Business segments, 2023 (%)
Figure 165: Company 11 Point-Of-Use Water Treatment System Market Net Sales Share, By Geography, 2023 (%)
Figure 166: Company 12 Point-Of-Use Water Treatment System Market Net Revenue, By Years, 2023-2030* ($)
Figure 167: Company 12 Point-Of-Use Water Treatment System Market Net Revenue Share, By Business segments, 2023 (%)
Figure 168: Company 12 Point-Of-Use Water Treatment System Market Net Sales Share, By Geography, 2023 (%)
Figure 169: Company 13 Point-Of-Use Water Treatment System Market Net Revenue, By Years, 2023-2030* ($)
Figure 170: Company 13 Point-Of-Use Water Treatment System Market Net Revenue Share, By Business segments, 2023 (%)
Figure 171: Company 13 Point-Of-Use Water Treatment System Market Net Sales Share, By Geography, 2023 (%)
Figure 172: Company 14 Point-Of-Use Water Treatment System Market Net Revenue, By Years, 2023-2030* ($)
Figure 173: Company 14 Point-Of-Use Water Treatment System Market Net Revenue Share, By Business segments, 2023 (%)
Figure 174: Company 14 Point-Of-Use Water Treatment System Market Net Sales Share, By Geography, 2023 (%)
Figure 175: Company 15 Point-Of-Use Water Treatment System Market Net Revenue, By Years, 2023-2030* ($)
Figure 176: Company 15 Point-Of-Use Water Treatment System Market Net Revenue Share, By Business segments, 2023 (%)
Figure 177: Company 15 Point-Of-Use Water Treatment System Market Net Sales Share, By Geography, 2023 (%)